. 2023 Aug;531(12):1244-1260.
doi: 10.1002/cne.25493. Epub 2023 May 3.

Comparative analysis of structural modifications induced by monocular retinal inactivation and monocular deprivation in the developing cat lateral geniculate nucleus

Affiliations

Comparative analysis of structural modifications induced by monocular retinal inactivation and monocular deprivation in the developing cat lateral geniculate nucleus

Kevin R Duffy et al. J Comp Neurol. 2023 Aug.

Abstract

During a critical period of postnatal life, monocular deprivation (MD) by eyelid closure reduces the size of neurons in layers of the dorsal lateral geniculate nucleus (dLGN) connected to the deprived eye and shifts cortical ocular dominance in favor of the non-deprived eye. Temporary inactivation of the non-deprived eye can promote superior recovery from the effects of long-term MD compared to conventional occlusion therapy. In the current study, we assessed the modification of neuron size in the dLGN as a means of measuring the impact of a brief period of monocular inactivation (MI) imposed at different postnatal ages. The biggest impact of MI was observed when it occurred at the peak of the critical period. Unlike the effect of MD, structural plasticity following MI was observed in both the binocular and monocular segments of the dLGN. With increasing age, the capacity for inactivation to alter postsynaptic cell size diminished but was still significant beyond the critical period. In comparison to MD, inactivation produced effects that were about double in magnitude and exhibited efficacy at older ages. Notwithstanding the large neural alterations precipitated by MI, its effects were remediated with a short period of binocular experience, and vision through the previously inactivated eye fully recovered. These results demonstrate that MI is a potent means of modifying the visual pathway and does so at ages when occlusion is ineffective. The efficacy and longevity of inactivation to elicit plasticity highlight its potential to ameliorate disorders of the visual system such as amblyopia.

Keywords: critical period; dorsal lateral geniculate nucleus; monocular deprivation; monocular inactivation; neural plasticity; tetrodotoxin; visual cortex.


Conflict of interest statement

Conflict of Interest

The authors declare no conflict of interest.

Figures

Figure 1.
Figure 1.
Illustration of the cat primary visual pathway depicting the effect of MD on neurons in the dLGN and their projections to V1. Like monkeys and humans, layers of the cat dLGN are eye specific, each receiving input from either the left or right eye but not both. The more dorsal A layers of the dLGN receive input from the contralateral eye, while A1 layers receive input from the ipsilateral eye. Early in postnatal development, MD reduces the size of neuron somata within so-called binocular segments of deprived A and A1 layers (grey rectangles) relative to non-deprived counterparts (green rectangles). Axons of non-deprived and deprived dLGN neurons with spatially corresponding visual receptive fields, project to overlapping regions of V1 where they are subjected to binocular competition (V1b). The result of this competition is that deprived axons lose connections, resulting in less complex terminal fields compared to non-deprived counterparts. In contrast, neurons located within the so-called monocular segments of the dLGN (black rectangles), which are positioned on lateral flanks of the A layers (delineated by the dashed lines), are not subjected to binocular competition because they are spatially segregated from fellow-eye inputs in V1 (V1m). Therefore, unlike the binocular segment, deprived neurons within the monocular segment do not exhibit the same relative reduction in soma size. Illustration is based on data from Guillery and Stelzner (1970); Guillery (1972); Casagrande et al. (1978); Antonini and Stryker (1983).
Figure 2.
Figure 2.
The impact of a 14-day MD imposed at or beyond the critical period peak. Low magnification view of the left dLGN stained for Nissl substance from an animal that received 14 days of MD at 4 weeks of age (a) revealed a reduction of neuron soma size within the deprived layer (black arrow) compared to the non-deprived layer (white arrow). At higher magnification the difference between deprived eye (DE) and non-deprived eye (NDE) neuron size was evident in the binocular segment of the dLGN (b,c) but not within the monocular segment (d,e). Quantification of neuron soma area revealed a 25% reduction in the size of deprived neurons within the binocular segment (f), but this effect did not extend into the monocular segment where eye-specific neurons were comparable in size (g). A much smaller effect on dLGN cell size was observed when 14 days of MD was imposed at 10 weeks of age (h), and this was reflected by observation at higher magnification with no obvious alteration in neuron soma size within either the binocular (i,j) or monocular (k,l) segments. These observations were supported with quantification that revealed a diminished impact on neuron size in the binocular segment (m), and no effect in the monocular segment (n) when MD occurred at 10 weeks of age. Scale bars = 1 mm (a, h) and 50 μm (b-e and i-l). Red and blue data points indicate measurements from A and A1 layers, respectively. Asterisks in a and h indicate location of the monocular segment in the A layers. The timing of MD is shown in the lower right of panel a and h. Double asterisks indicate statistical significance below 0.05.
Figure 3.
Figure 3.
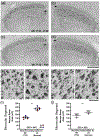
The effect of 10 days of MI imposed at 4 weeks of age, the peak of the critical period. Microscopic inspection of the left and right dLGN from two animals revealed a substantial loss of Nissl staining within layers serving the inactivated eye (IE; black arrows in a-d) relative to those serving the normal eye (NE; white arrows in a-d), and this effect was accompanied by a sizable reduction of neuron soma area within inactivated-eye layers of both the binocular (e,f) and monocular (g,h) segments. Stereological quantification of neuron soma area confirmed these observations by showing that inactivated-eye neurons were 44% smaller than those serving the normal eye within the binocular segment (i), which was about double the effect size in comparison to MD. Distinct from the effects of MD, MI rendered inactivated-eye neurons 20% smaller within the dLGN’s monocular segment (j). Scale bars = 1 mm (a-d) and 50 μm (e-h). Red and blue data points indicate measurements from A and A1 layers, respectively. Asterisks in a-d indicate location of the monocular segment in the A layers. The postnatal timing of MI is shown in the lower right of panel a and c. Double asterisks indicate statistical significance below 0.05.
Figure 4.
Figure 4.
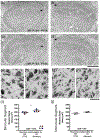
The impact of 10 days of MI started at 10 weeks of age when MD has a negligible effect on dLGN cell size. Examples of Nissl staining in the right and left dLGN from two animals (a-d) revealed a noticeable difference in layers serving the inactivated eye (black arrows in a-d) relative to those of the normal eye (white arrows in a-d). This was better appreciated at higher magnification, which showed that neurons were smaller within inactivated-eye (IE) layers compared to those of the normal eye (NE). This difference in neuron size was apparent in both the binocular (e,f) and monocular (g,h) segments. Quantification of neuron soma area supported these observations by showing that inactivated-eye neurons within the binocular segment were 23% smaller than those serving the normal eye (i), and 18% smaller within the monocular segment (j). Scale bars = 1 mm (a-d) and 50 μm (e-h). Red and blue data points indicate measurements from A and A1 layers, respectively. Asterisks in a-d indicate location of the monocular segment in the A layers. The postnatal timing of MI is shown in the lower left of panel a and c. Double asterisks indicate statistical significance below 0.05.
Figure 5.
Figure 5.
The consequence of 10 days of MI started at 22 weeks of age when the classical critical period has passed. Low magnification examples of Nissl staining within the right and left dLGN from two animals (a-d) revealed a minor change within the layers serving the inactivated eye (black arrows in a-d) compared to layers serving the normal eye (white arrows in a-d). At higher magnification it was obvious that neurons were only slightly smaller within inactivated-eye (IE) layers compared to those serving the normal eye (NE), which was evident within both the binocular (e,f) and monocular (g,h) segments. Quantification of neuron soma area mirrored these observations by showing that inactivated-eye neurons in the binocular segment were only 10% smaller than those serving the normal eye (i), and within the monocular segment the difference was similar at 8% (j). Scale bars = 1 mm (a-d) and 50 μm (e-h). Red and blue data points indicate measurements from A and A1 layers, respectively. Asterisks in a-d indicate location of the monocular segment in the A layers. The postnatal timing of MI is shown in the lower right of panel a and c. Double asterisks indicate statistical significance below 0.05.
Figure 6.
Figure 6.
The effect of a fixed duration of MI imposed at different ages across postnatal development. Within the binocular segment, the effect of 10 days of MI (filled circles) was clearly reduced with age (a). Between 4 and 22 weeks of age, there was a 75% reduction in the efficacy of inactivation, though, importantly, a small effect still remained even at the oldest age examined. In comparison to MD (open circles), MI elicited greater change within the dLGN, yielding effects that were about double in magnitude. Within the monocular segment (b), the impact of MI was likewise reduced with age but less so in comparison to the binocular segment. A clear distinction between the effect of MD and MI was also observed within the monocular segment: whereas the size of neurons in the monocular segment exhibit little change with MD, MI had an effect on neuron size even at the oldest age examined. Subtraction of the differences in ODI within the monocular segment from the differences in the binocular segment revealed that the developmental profiles for MD and MI groups were similar (c), suggesting the effect of MD and MI mediated by binocular competition is comparable.
Figure 7.
Figure 7.
Recovery from the effects of 10 days of MI applied at 10 weeks of age. Examples of Nissl staining in the right and left dLGN from two animals (a-d) that received MI followed by 10 days of binocular vision (BV) revealed no obvious difference in layers serving the previously inactivated eye (black arrows in a-d) relative to those of the normal eye (white arrows in a-d). Previously inactivated layers (IE) contained neurons that were comparable in size to those within layers serving the normal eye (NE), which was evident at high magnification for both the binocular (e,f) and monocular (g,h) segments. Quantification of neuron soma area revealed balance between the eye-specific layers that was comparable to normal (Fong et al., 2016), and this was true for measurements from the binocular (i) and monocular (j) segments. This indicates that the modification provoked by MI at 10 weeks of age is temporary, and resolves with a short period of binocular vision. Scale bars = 1 mm (a-d) and 50 μm (e-h). Red and blue data points indicate measurements from A and A1 layers, respectively. The postnatal timing of MI is shown in the lower right of panel of a and c.
Figure 8.
Figure 8.
Measurement of VEPs elicited by separate stimulation of the left and right eye before, during, and after 10 days of right eye inactivation. For each graph in a-f, spatial frequency is plotted on the abscissa, and the summed power from the Fourier analysis is plotted on the ordinate. The trace containing solid black circles represents the sum of visually-evoked power, while the trace with open circles shows the non-visual baseline power. Visually-evoked power elicited by a grey screen served as a control, and should be about equal for the two traces. Data are shown for an example animal in which VEP power from the left and right eye are balanced (traces with black circles) prior to any visual manipulation (a,b). VEPs power measured during right-eye inactivation was reduced to baseline levels for that eye, while responses elicited from the left eye remained high (c,d). VEP power from the same animal is shown after it was provided 10 days of binocular vision following the period of MI (e,f). Restoration of normal-appearing VEPs were measured for the previously inactivated eye after the period of binocular vision, and this was in balance with VEP power measured from the left eye. The balance of VEPs measured between the eyes was calculated using an ocular dominance index (ODI), which indicates the percentage difference between eyes and is displayed in the upper right corner of the right eye graph (b,d,f). VEP power measurements were plotted for the left (g) and right (h) eye before (Pre-TTX), during (TTX), and after (Post-TTX) right eye inactivation for 10 days. While left eye VEP power remained unchanged across conditions, VEP power for the right eye was significantly reduced during the period of inactivation but recovered to normal levels with provision of binocular vision. Squares and circles represent data from separate animals; green and magenta represent left and right visual cortex, respectively; solid and half symbols represent data from 0.05 cpd and 0.1 cpd grating stimuli, respectively.

References

    1. Antonini A, Stryker MP (1993). Rapid remodeling of axonal arbors in the visual cortex. Science, 260, 1819–1821. - PubMed
    1. Bach M, Meign T (1999) Do’s and don’ts in Fourier analysis of steady-state potentials. Documenta Ophthalmologica. Advances in Ophthalmology, 99, 69–82. - PubMed
    1. Bickford ME, Guido W, Godwim DW (1998). Neurofilament proteins in Y-cells of the cat lateral geniculate nucleus: normal expression and alteration with visual deprivation. Journal of Neuroscience, 18, 6549–6557. - PMC - PubMed
    1. Blakemore C, & Van Sluyters RC (1974). Reversal of the physiological effects of monocular deprivation in kittens: further evidence for a sensitive period. The Journal of Physiology, 237, 195–216. - PMC - PubMed
    1. Birch EE, & Stager DR (1988). Prevalence of good visual actuity following surgery for congenital unilateral cataract. Archives of Ophthalmology, 106, 40–43. - PubMed

Publication types

LinkOut - more resources