

Low temperature and mTOR inhibition favor stem cell maintenance in human keratinocyte cultures
- PMID: 37139607
- PMCID: PMC10240198
- DOI: 10.15252/embr.202255439
Low temperature and mTOR inhibition favor stem cell maintenance in human keratinocyte cultures
Abstract
Adult autologous human epidermal stem cells can be extensively expanded ex vivo for cell and gene therapy. Identifying the mechanisms involved in stem cell maintenance and defining culture conditions to maintain stemness is critical, because an inadequate environment can result in the rapid conversion of stem cells into progenitors/transient amplifying cells (clonal conversion), with deleterious consequences on the quality of the transplants and their ability to engraft. Here, we demonstrate that cultured human epidermal stem cells respond to a small drop in temperature through thermoTRP channels via mTOR signaling. Exposure of cells to rapamycin or a small drop in temperature induces the nuclear translocation of mTOR with an impact on gene expression. We also demonstrate by single-cell analysis that long-term inhibition of mTORC1 reduces clonal conversion and favors the maintenance of stemness. Taken together, our results demonstrate that human keratinocyte stem cells can adapt to environmental changes (e.g., small variations in temperature) through mTOR signaling and constant inhibition of mTORC1 favors stem cell maintenance, a finding of high importance for regenerative medicine applications.
Keywords: TRP channels; keratinocyte stem cells; mTOR; microenvironment; temperature.
© 2023 The Authors. Published under the terms of the CC BY 4.0 license.
Conflict of interest statement
The authors declare that they have no conflict of interest.
Figures
- A, B
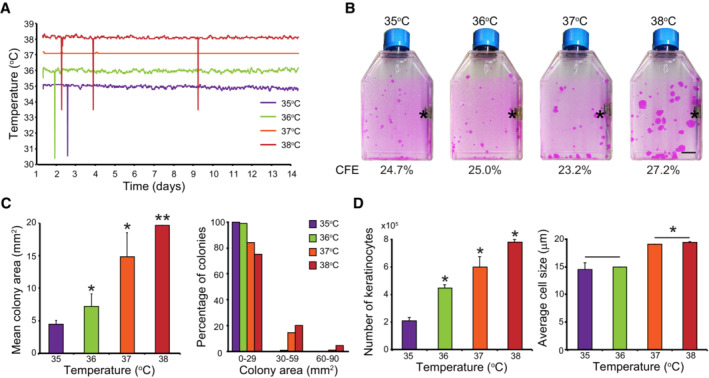
One hundred human keratinocytes (YF29, passage V) were cultured in duplicate for 12 days in individual Thermo Scientific Heracell 150 incubators with the temperature set at 35, 36, 37, or 38°C. Temperature of each incubator was monitored with independent thermo probes (see Fig EV1). (A) In parallel, the temperature of the culture medium was recorded every 10 s using immerged RFID temperature sensors (white stars in panel B; see also Fig EV1C). Sharp spikes resulted from wireless communication artifacts. (B) Cells were fixed and stained with 1% Rhodamine B. Temperature did not affect colony‐forming efficiency (CFE) but impacted colony size; colonies were smaller when temperatures were below 37°C and larger at 38°C. Asterisks indicate thermo probes for monitoring the temperature. Scale bar, 10 mm.
- C, D
Human keratinocytes (YF29) were cultured in mass for 7 days at different temperatures before the cultures were dissociated. (C) Colony size was quantified using an image processing software (ImageJ). (D) The number and the size of the cells were determined using a Tali™ cytometer. Temperature impacted both cell number and size.
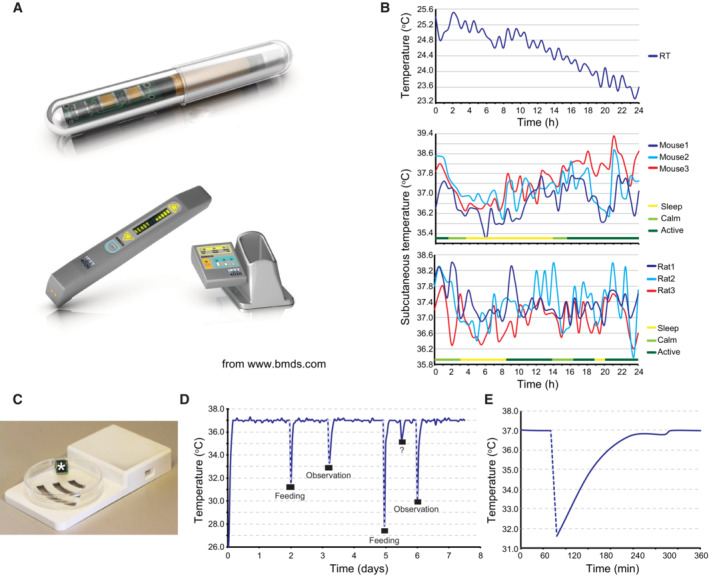
Implantable IPTT‐300 transponder and its DAS‐7006/7 s reader system from BioMedic Data Systems, Seaford DE, USA (
www.bmds.com ). Actual size of the implantable transponder: length 14 mm and diameter 2 mm.Subcutaneous temperature of mice and rats constantly fluctuates. Three mice and three rats were each implanted subcutaneously with an IPTT‐300 transponder (BioMedic Data Systems); the temperature and the behavior (active, calm, sleep) of each animal were then monitored over a 24 h. Room temperature (RT) was simultaneously monitored with a nonimplanted transponder.
Picture of an EPFL‐designed submersible RFID temperature sensor and its reading base station (Laboratory of Microengineering for Manufacturing). The culture vessel was a 100 mm size Petri dish.
Cultured human keratinocytes were subjected to sharp temperature fluctuations when removal from the culture incubator (Nuaire 8700E) for medium change (feeding) or microscopic observation. Temperature of the culture medium was recorded over a week using immersed temperature sensors. Note that an unknown event (opening of the incubator door?) occurred between the fifth and sixth day of culture.
Zoom of the temperature curve at the first medium change shown in B demonstrates that recovery to the set temperature (37°C) takes more than 2 h.
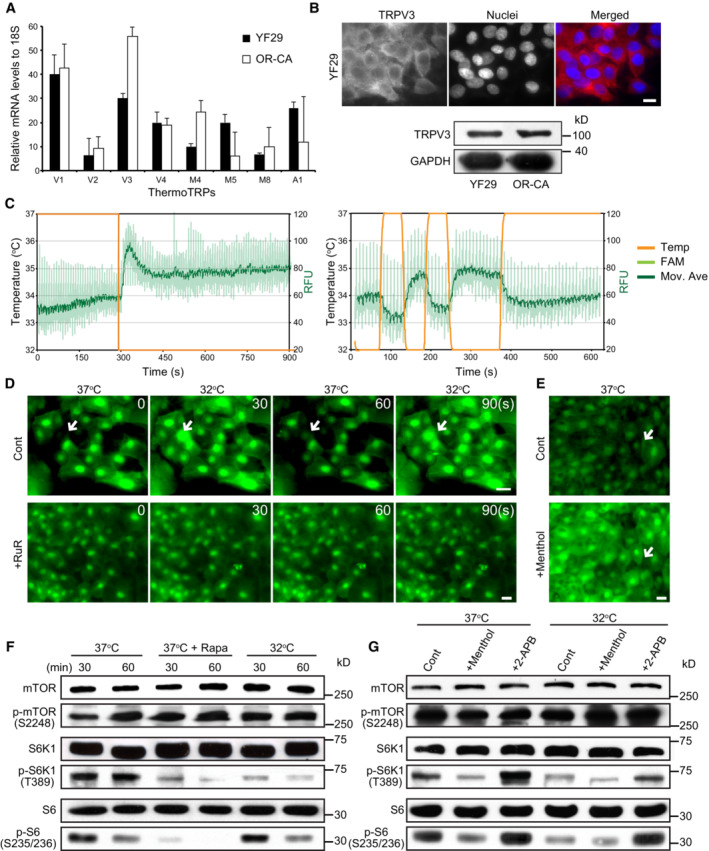
- A
The transcripts of eight thermoTRP channels were quantified by qPCR in two different strains of human diploid keratinocytes (YF29 and OR‐CA). Data are presented as the mean ± SEM (n = 3 biological replicates).
- B
TRPV3 protein was detected in both strains using immunocytochemistry and western blotting. Scale bar = 10 μm.
- C
ThermoTRP functionality was assessed as described (Reubish et al, 2009). Briefly, cultured human keratinocytes were labeled with a fluorescent calcium dye (Fluo‐4) and exposed to brief temperature fluctuations using a RT–PCR machine (32–37°C and back to 32°C in 1‐min cycle). Two representative experiments demonstrate a significant increase in Fluo‐4 fluorescence when the temperature decreases.
- D, E
Live imaging of cultured keratinocytes (YF29) labeled with Fluo‐4 in the presence of a TRPV antagonist (Ruthenium red (RuR) 500 μM) or agonist (menthol 500 μM) and subjected to brief temperature fluctuations from 37 to 32°C. The heating/cooling device and its calibration are shown in Fig EV2. The device was placed in a Zeiss inverted microscope equipped with a culture chamber with temperature set at 37°C and monitored with an independent thermo probe (SK‐L200 Datalogger Sato Japan). (D) Temperature change induced intracellular flux of calcium, which was blocked by treatment with RuR. Scale bars, 20 μm. The temperature was switched between 32 and 37°C every 30 s. (E) Menthol induces an intracellular flux of calcium. RuR and menthol were added to the keratinocyte cultures 1 h before starting the temperature changes. Arrows indicate keratinocytes in which the fluorescent signals significantly changed. Scale bar, 20 μm.
- F, G
YF29 cells were cultured for 7 days at 37°C in a Nuaire 8700E culture incubator. Cells were then maintained at 37°C or switched to an adjacent incubator with temperature set at 32°C. Temperature was monitored with independent thermo probes (see Fig EV1) in the presence or absence of rapamycin (100 nM), or a cold agonist (menthol—500 μM), a warm agonist (2‐APB—200 μM) and the vehicle (control—ethanol 70%) for 30 and 60 min. (F) mTORC1 kinase activity decreases in the presence of rapamycin and when the temperature is switched from 37 to 32°C. (G) mTORC1 kinase activity decreases in the presence of menthol and increases in presence of 2‐APB, indicating that ThermoTRP and mTOR signaling are connected. Rapamycin (Rapa), menthol, and 2‐APB were added in the keratinocyte cultures 1 h before starting the temperature changes.
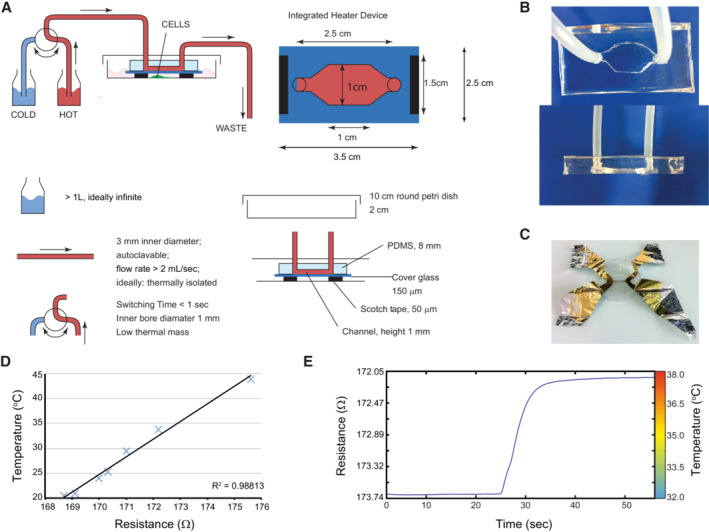
Schematic representation of the heating/cooling system. The device was designed to perfectly fit a 100 mm Petri dish and consists of a transparent polydimethylsiloxane (PDMS) chamber cast on a microscope slide cover glass. Two holes are pierced at each extremity of the chamber to allow connection of the chamber with the help of tubing to two separate bottles filled with water, immersed in individual water baths set at different temperatures. An external valve allows temperature variation in the chamber by switching the water flow between water baths.
Top and side views of the PDMS chamber.
Four‐point measurement of the electrical resistance of a thin aluminum foil was used to calibrate the device.
The relation between temperature and resistance was always linear in the experimental temperature range.
Example of the calibration curve of the device used for the imaging experiments is presented in Fig 2D and E.
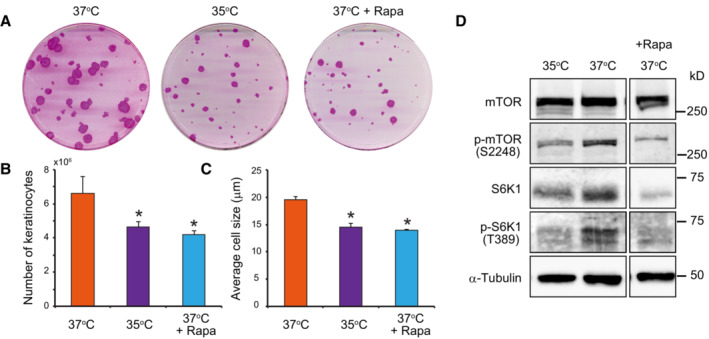
Colony‐forming efficiency (CFE) of keratinocytes was unaltered when keratinocytes were cultured at 35°C or in the presence of 100 nM rapamycin. However, the mean area of colonies was smaller when compared to cells cultured at 37°C.
Culture at 35°C and treatment with rapamycin decreased keratinocyte proliferation as shown by the lower total number of cells after 7 days of culture compared with in the control condition.
Culture at 35°C and treatment with rapamycin also reduced cell growth as shown by a smaller mean diameter of keratinocytes compared with that in the control condition after 7 days of culture.
Long‐term exposure to temperatures below 37°C decreased mTORC1 kinase activity.
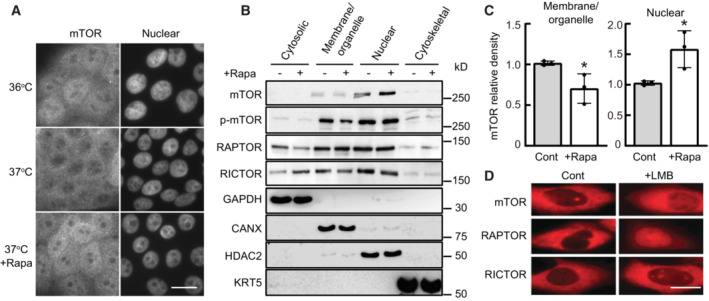
Human keratinocytes (YF29) were cultured in individual Thermo Scientific Heracell 150 incubators with the temperature set at 36 or 37°C for 4 days and incubated with rapamycin (100 nM) for 4 h before they were immunostained with a primary rabbit polyclonal mTOR antibody (T2949 Sigma‐Aldrich) and with an Alexa Fluor 568 secondary antibody. mTOR nuclear signal was visible after rapamycin treatment or exposure to 36°C. Scale bar, 20 μm.
Proteins were extracted from different YF29 subcellular components with ProteoExtract™ Subcellular Proteome Extraction kit (Calbiochem). The purity of each subcellular fraction was confirmed using specific markers, GAPDH for the cytosolic fraction, calnexin (CANX) for the membrane and organelles fraction, keratin 5 (KRT5) for the cytoskeletal fraction and HDAC2 for the nuclear fraction. mTOR, p‐mTOR, RICTOR, and RAPTOR were identified both in the membranes/organelles and nuclear fractions by western blotting. RICTOR and RAPTOR were also identified in the cytosolic fraction.
Western blot bands were scanned and their density measured using Scion image software (Scion Corporation). This experiment indicated that exposure to rapamycin increased the level of nuclear mTOR approximately 1.5‐fold while decreasing the level of cytoplasmic mTOR. Data are presented as the mean ± SD (n = 3 biological replicates). *P < 0.05 (two‐tailed Student's t‐test).
CHO cells engineered to transiently express SNAP‐mTOR, SNAP‐RAPTOR, and SNAP‐RICTOR (Gautier et al, 2008) were incubated with the nuclear export inhibitor leptomycin B (LMB; 6.4 ng/ml) for 6 h at 37°C. Cells were labeled with TMR‐Star (1 μM) for 30 min, washed and then imaged. This experiment demonstrated that mTOR, RAPTOR, and RICTOR accumulated in the nucleus after LMB treatment. Scale bars, 10 μm.
- A
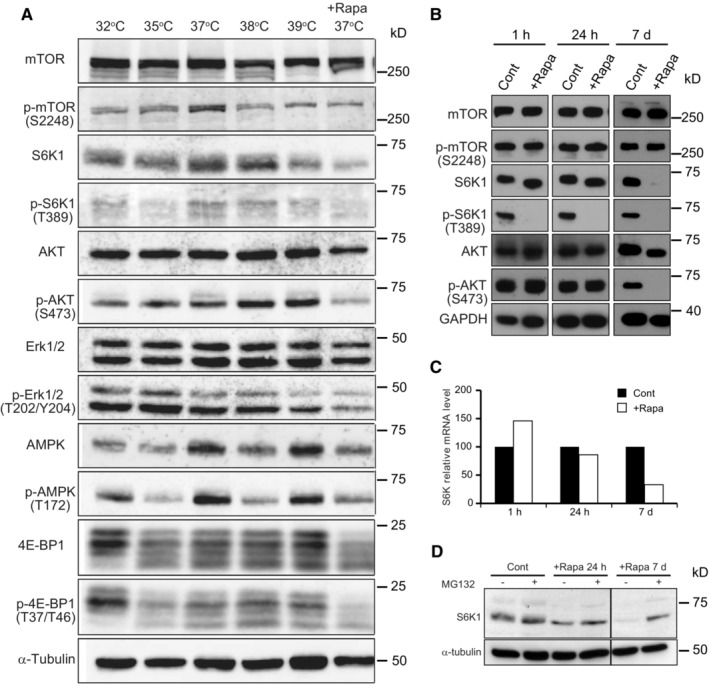
YF29 keratinocytes were cultured for 7 days at 32, 35, 37, and 37°C in the presence of rapamycin (100 nM). Note that phosphorylation levels of ERK are completely independent of temperature, demonstrating that the decrease in phosphorylated S6K1 is not linked to a general effect of temperature on enzyme activity. Thermo Scientific Heracell 150 incubators with temperatures set at 32, 35, 36, 37, and 38°C.
- B–D
YF29 keratinocytes were cultured for 7 days before proteins were extracted and expression of S6K1 was analyzed by western blotting and qPCR. Rapamycin (100 nM) was added either for the entire duration of the culture (7 days) or the last 24 h, or for the last 1 h. (B) As expected, a short rapamycin exposure inhibited S6K1 phosphorylation without affecting S6K1, whereas a long rapamycin exposure (7 days) significantly affected the detection of S6K1. (C) qPCR experiments indicate that the level of expression of S6K1 mRNAs decreases with long rapamycin exposure. (D) MG132 (1 μM), a specific proteasome inhibitor, was added to YF29 cells grown in the absence for the presence of rapamycin for a day (24 h) or for 7 days (7 d) before proteins were extracted. These experiments demonstrate that a decrease in expression and increase in protein degradation are responsible for the low levels of S6K1 after 7 days of rapamycin exposure to rapamycin.
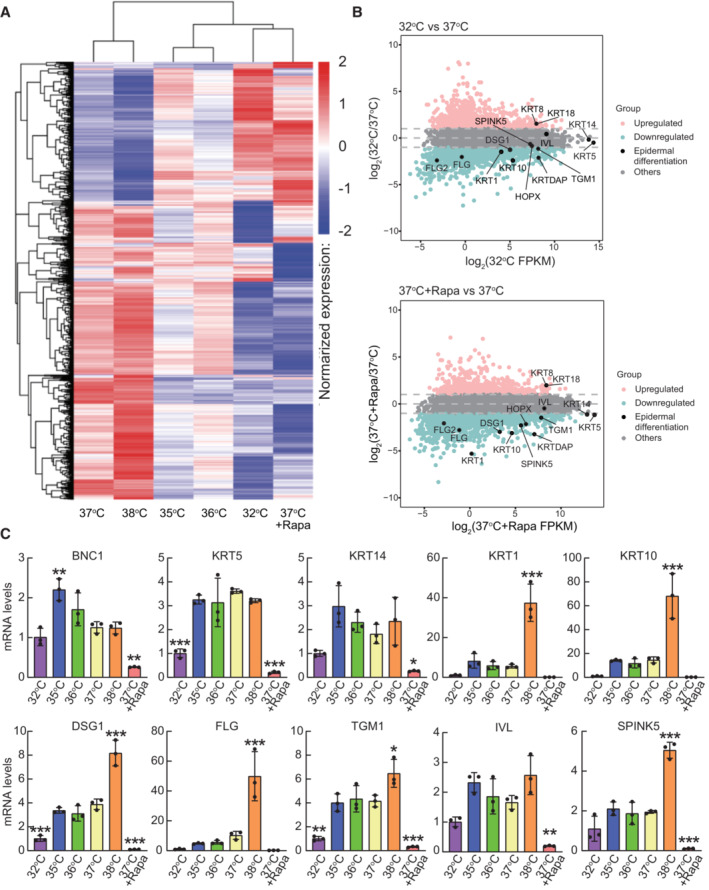
Cluster analysis of gene expression differences is shown by the log10 (FPKM+1) value. Red denotes genes with high expression levels, and blue denotes genes with low expression levels. The color range from blue to red represents the log10 (FPKM+1) value from small to large.
MA plot shows all the genes without low expression or log2FC = 0. Genes indicated in pink: upregulated (≥ 1 log2(FC)), blue: downregulated (≤ −1 log2(FC)), gray: others (−1 < log2(FC) < 1) and black: epidermal differentiation genes. Log2(FC) values were calculated using the edgeR package.
Quantitative PCR analysis of epidermal differentiation‐associated genes. Data are presented as the mean ± SD (n = 3 biological replicates). *P < 0.05, **P < 0.01, ***P < 0.001 (one‐way ANOVA with Dunnett's multiple comparisons test vs 37°C).
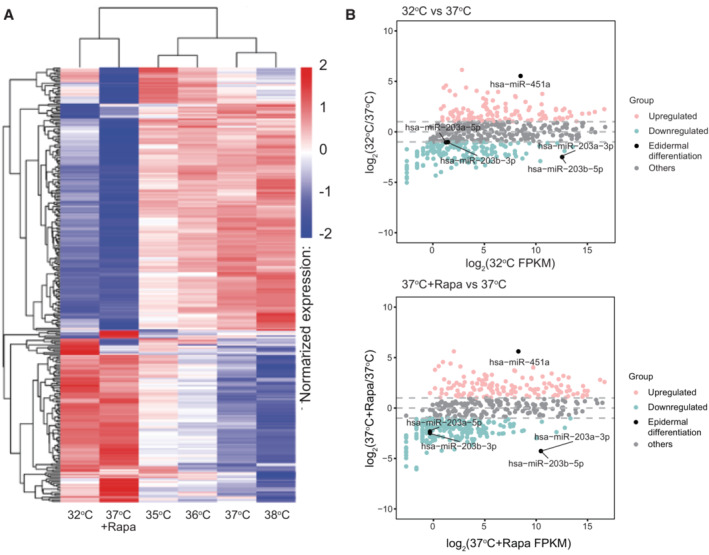
Cluster analysis of miRNA expression differences using the log10 (TPM + 1) value. Red denotes miRNAs with high expression levels, and blue denotes miRNAs with low expression levels. The color range from blue to red represents the log10 (TPM + 1) value from small to large.
The MA plot showing all miRNAs without low expression or log2FC = 0. miRNAs indicated in pink: upregulated (≥ 1 log2(FC)), blue: downregulated (≤ −1 log2(FC)), gray: others (−1 < log2(FC) < 1) and black: miRNAs related to epidermal differentiation. log2(FC) values are calculated using the edgeR package.
- A, B
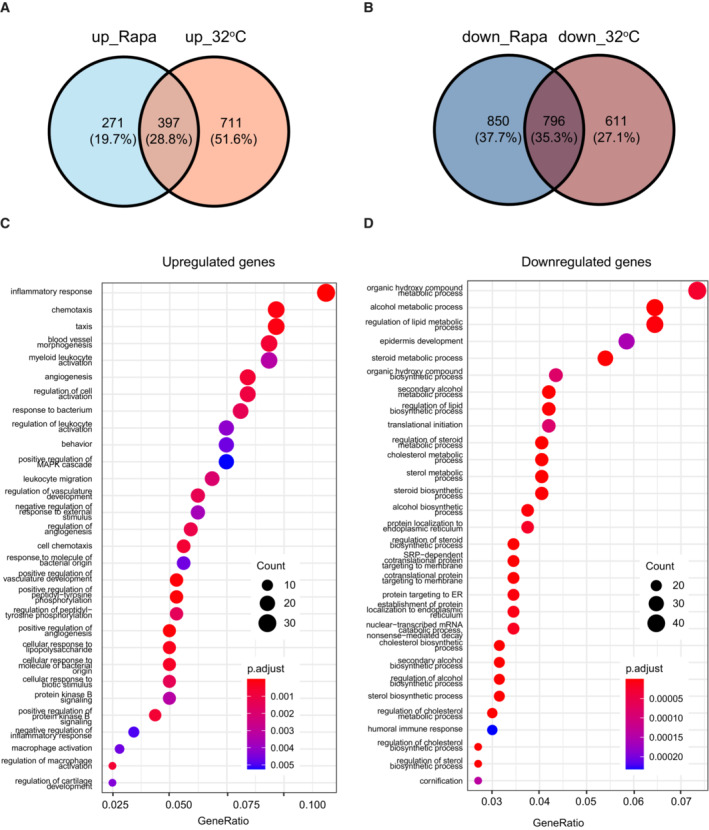
Venn diagrams of upregulated (A) or downregulated (B) genes in keratinocytes cultured at 32°C or treated with 100 nM rapamycin compared with gene expression in the control culture (37°C).
- C, D
Gene ontology (GO) analysis of genes upregulated (C) or downregulated (D) genes under both conditions in keratinocytes cultured at 32°C or treated with 100 nM rapamycin compared with gene expression in the control culture (37°C).
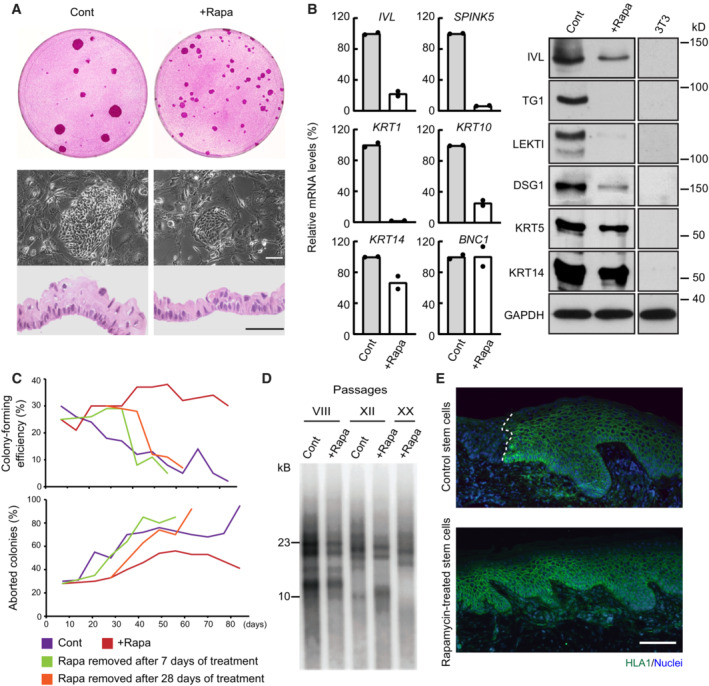
Cultured human keratinocytes (YF29 passage VII) treated with rapamycin (100 nM) formed smaller colonies and a thinner epithelium when confluent. Scale bars, 50 μm.
Cultured human keratinocytes (YF29 passage III) treated with rapamycin maintained a basal phenotype as shown by the expression of several basal (KRT14, BNC1) and terminal differentiation markers (SPINK5, IVL, KRT1, and KRT10) using quantitative PCR (left panel) and western blotting (right panel). Data are presented as the mean (n = 2 biological replicates).
A holoclone (Barrandon & Green, 1987) was isolated from YF29 strain and serially passaged once a week for more than 13 weeks in the presence or absence of rapamycin (100 nM). A colony‐forming efficiency was performed at each passage for each condition to determine the number of growing and aborted colonies. Rapamycin significantly increased the number of progressively growing colonies while decreasing the number of terminally differentiated (aborted) colonies, demonstrating a drastic reduction in clonal conversion. Nevertheless, clonal conversion resumed when rapamycin was withdrawn after 7 or 28 days of culture.
Telomere length was analyzed on DNA extracted from YF29 keratinocytes with or without rapamycin treatment at passages VIII, XII, and XX (keratinocytes grown without rapamycin did not reach passage XX because of clonal conversion—see panel C). Telomere shortening could be observed through passages even if keratinocytes were continuously treated with rapamycin.
Rapamycin‐treated keratinocytes (YF29 passage IV) can fully regenerate an epidermis when transplanted onto SCID mice; grafts were harvested after 71 days and immunostained with an HLA‐1 antibody to identify the human cells (white dotted line indicates the boundary between mouse and human epidermis). Scale bar, 100 μm.
References
-
- Asakawa M, Yoshioka T, Matsutani T, Hikita I, Suzuki M, Oshima I, Tsukahara K, Arimura A, Horikawa T, Hirasawa T et al (2006) Association of a mutation in TRPV3 with defective hair growth in rodents. J Invest Dermatol 126: 2664–2672 - PubMed
-
- Atanaskova Mesinkovska N (2018) Emerging unconventional therapies for alopecia areata. J Investig Dermatol Symp Proc 19: S32–S33 - PubMed
-
- Barrandon Y, Grasset N, Zaffalon A, Gorostidi F, Claudinot S, Droz‐Georget SL, Nanba D, Rochat A (2012) Capturing epidermal stemness for regenerative medicine. Semin Cell Dev Biol 23: 937–944 - PubMed
Publication types
MeSH terms
Substances
LinkOut - more resources
Full Text Sources
Molecular Biology Databases
Miscellaneous
