

Termination of STING responses is mediated via ESCRT-dependent degradation
- PMID: 37139896
- PMCID: PMC10267698
- DOI: 10.15252/embj.2022112712
Termination of STING responses is mediated via ESCRT-dependent degradation
Abstract
cGAS-STING signalling is induced by detection of foreign or mislocalised host double-stranded (ds)DNA within the cytosol. STING acts as the major signalling hub, where it controls production of type I interferons and inflammatory cytokines. Basally, STING resides on the ER membrane. Following activation STING traffics to the Golgi to initiate downstream signalling and subsequently to endolysosomal compartments for degradation and termination of signalling. While STING is known to be degraded within lysosomes, the mechanisms controlling its delivery remain poorly defined. Here we utilised a proteomics-based approach to assess phosphorylation changes in primary murine macrophages following STING activation. This identified numerous phosphorylation events in proteins involved in intracellular and vesicular transport. We utilised high-temporal microscopy to track STING vesicular transport in live macrophages. We subsequently identified that the endosomal complexes required for transport (ESCRT) pathway detects ubiquitinated STING on vesicles, which facilitates the degradation of STING in murine macrophages. Disruption of ESCRT functionality greatly enhanced STING signalling and cytokine production, thus characterising a mechanism controlling effective termination of STING signalling.
Keywords: ESCRT; cGAS-STING; innate immunity; lysosomal degradation; vesicular trafficking.
© 2023 The Authors. Published under the terms of the CC BY 4.0 license.
Conflict of interest statement
The authors declare that they have no conflict of interest.
Figures
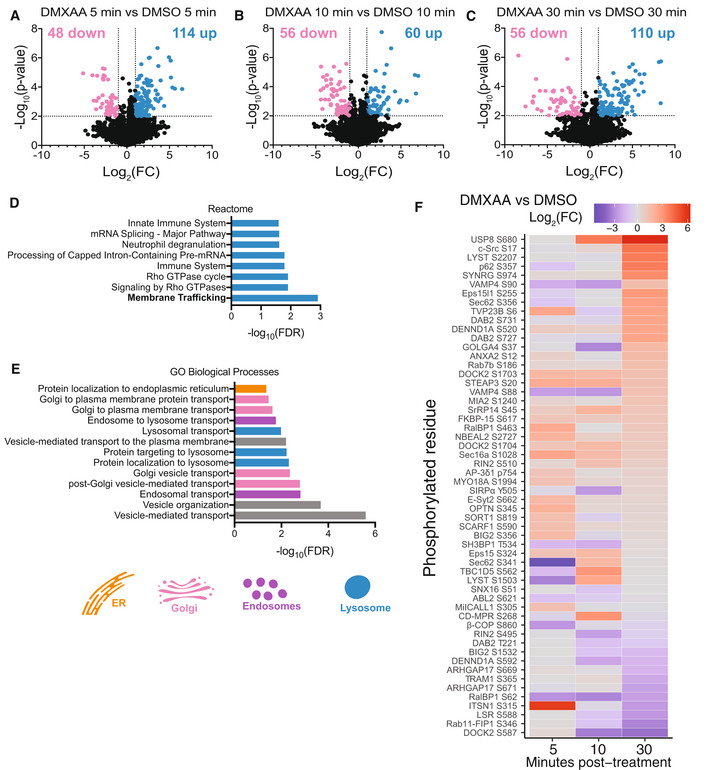
- A–C
Volcano plots depicting significantly up (blue) and down (pink) regulated phosphorylation events for DMXAA vs. DMSO groups for 5 min (A), 10 min (B) and 30 min (C) timepoints. −Log10(P‐value) is plotted on the y‐axis vs. Log2(Fold change [FC]) on the x‐axis. Significantly regulated events display P‐value > 0.01 and Log2(FC) > 1 or < −1.
- D
Pathway analysis was performed for all proteins with phosphorylation changes found across all three timepoints. Significantly enriched Reactome pathways are plotted with significance value displayed as −Log10(False discovery rate [FDR]).
- E
Gene ontology (GO) analysis was performed for all proteins with phosphorylation changes found across all three timepoints. Numerous significant Biological Processes terms were identified. Terms related to membrane/vesicular trafficking are plotted with significance value displayed as −Log10(FDR).
- F
The intensity of phosphorylated peptides that contributed to the GO terms in (E) was plotted in a heatmap over time. Data are shown as Log2(FC) of DMXAA vs DMSO for each time point.
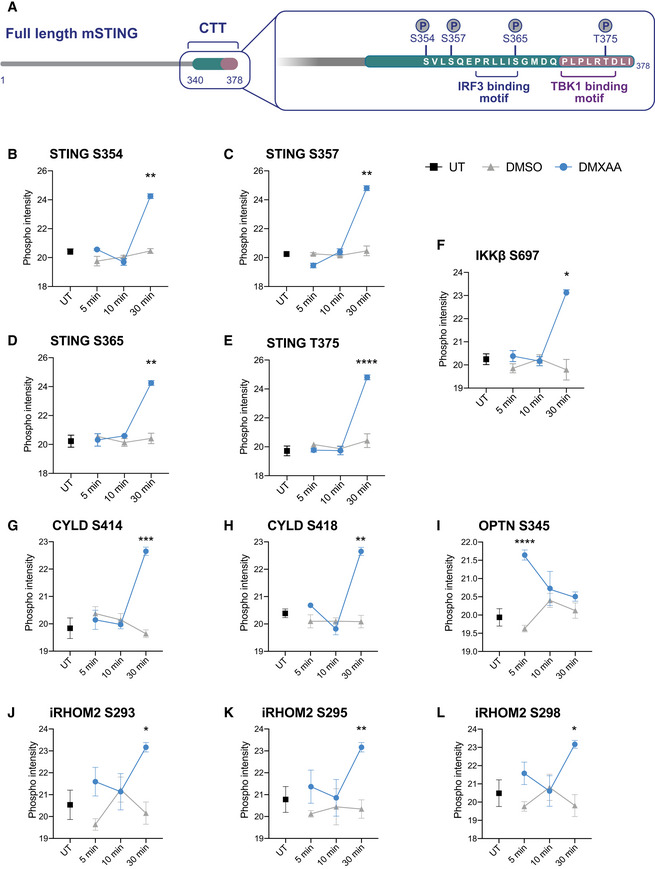
- A
Schematic of the C‐terminal tail (CTT) of STING where multiple phosphorylation sites were identified.
- B–L
The measured intensity values from the phosphoproteomics screen for phosphorylated peptides corresponding to STING (B–E), IKKβ (F), CYLD (G–H), OPTN (I), iRHOM2 (J–L), were plotted for UT, DMSO and DMXAA‐treated conditions. The phosphorylated residue is indicated within the graph title. Data shown as mean ± SEM for four replicates. Statistical analysis was performed using unpaired Student's t‐test. *P < 0.05, **P < 0.01, ***P < 0.001, ****P < 0.0001.

- A–F
The measured intensity values from the phosphoproteomics screen for phosphorylated peptides corresponding to Rab7a (A), CHMP4B (B), LYST (C), TOM1 (D), ATP6V1G3 (E) and CD‐MPR (F) were plotted for UT, DMSO and DMXAA‐treated conditions. The phosphorylated residue is indicated within the graph title. Data shown as mean ± SEM for four replicates. Statistical analysis was performed using unpaired Student's t‐test. *P < 0.05, **P < 0.01, ****P < 0.0001.
- G
Gene ontology (GO) analysis was performed for all proteins found with phosphorylation changes across all three timepoints. Proteins characterised within the organelles STING traffics through were identified using “Cellular components”. Proteins localised to the Golgi, endosomes, lysosomes and clathrin‐coated vesicles are depicted on a schematic of STING trafficking.

- A
Sting −/− iBMDMs expressing mRuby3‐STING (magenta) and eGFP‐Golgin84 (green) were imaged live on the 3i marianas spinning disk microscope. Z stack images were acquired either before (i.e. untreated) or after 50 μg/ml DMXAA treatment (i.e. image captured at 12 min post DMXAA treatment). Data are shown as a maximum intensity projection (MIP) of Z stack images. Scale bar = 5 μm.
- B
Increase in Golgi accumulation of eGFP signal starting from 2 min after 50 μg/ml DMXAA stimulation of eGFP‐STING iBMDMs and presented as Golgi/ER intensity in arbitrary units (a.u.) over time. Line of best fit is shown in red. Data are shown as the mean ± SD (N = 8 cells) and representative of three individual experiments.
- C
eGFP intensity loss from the Golgi starting from 20 min after 50 μg/ml DMXAA stimulation of eGFP‐STING iBMDMs and presented as intensity of the Golgi (a.u.) over time. Line of best fit is shown in red. Data are shown as the mean ± SD (N = 12 cells) and representative of three individual experiments.
- D
Sting −/− iBMDMs expressing mRuby3‐STING were imaged live on the spinning disk microscope. Representative images of timelapse showing STING vesicles exiting the Golgi for a recording starting 27 min after 50 μg/ml DMXAA treatment. Data are shown as a MIP of Z stack images. Square region of interest (ROI) indicates zoomed insert. Scale bar = 5 μm. Corresponds to Movie EV4.
- E
eGFP‐positive small vesicle regions were counted for individual cells over time starting from 20 min after 50 μg/ml DMXAA stimulation of eGFP‐STING iBMDMs and presented as the number of endosomes per cell. Data are shown as the mean ± SD (N = 11 cells) and representative of three individual experiments.
- F
Sting −/− iBMDMs expressing eGFP‐STING were imaged live on the spinning disk microscope. A representative image of timelapse showing transport of STING vesicles for a recording starting 1 h 18 min after 50 μg/ml DMXAA treatment. Data are shown as a MIP of Z stack images. Square ROI indicates zoomed insert. Scale bar = 5 μm. Corresponds to Movie EV6.
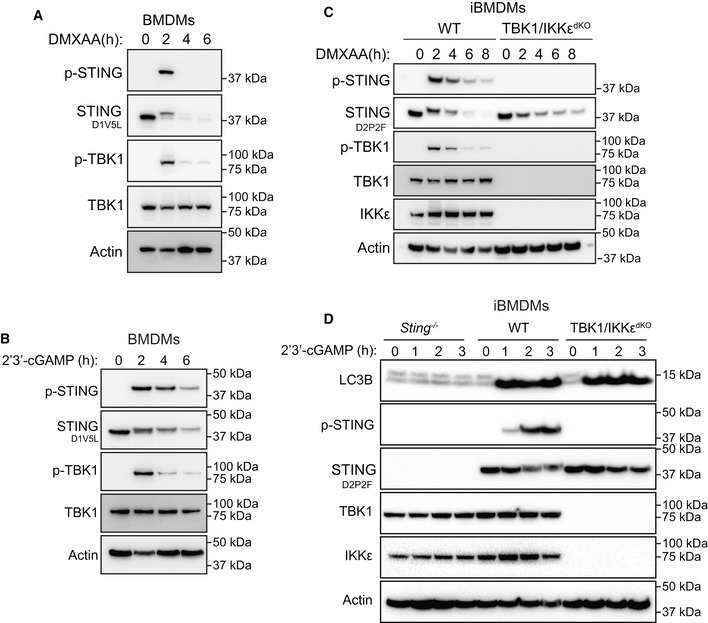
- A
Primary BMDMs were left untreated or treated with 25 μg/ml DMXAA for 2, 4 or 6 h. Cells were lysed for immunoblot with the indicated antibodies. Data shown are representative of three independent experiments.
- B
Primary BMDMs were left untreated or treated with 10 μg/ml 2′3′‐cGAM(PS)2 for 2, 4 or 6 h. Cells were lysed for immunoblot with the indicated antibodies. Data shown are representative of three independent experiments.
- C
WT or TBK1/IKKε double CRISPR‐Cas9 knockout (dKO) iBMDMs were left untreated or treated with 25 μg/ml DMXAA for 2, 4, 6 or 8 h. Cells were lysed for immunoblot with the indicated antibodies. Data shown are representative of three independent experiments.
- D
Sting −/−, WT or TBK1/IKKε dKO iBMDMs were left untreated or treated with 10 μg/ml 2′3′‐cGAM(PS)2 for 1, 2, or 3 h. Cells were lysed for immunoblot with the indicated antibodies. Data shown are representative of three independent experiments.
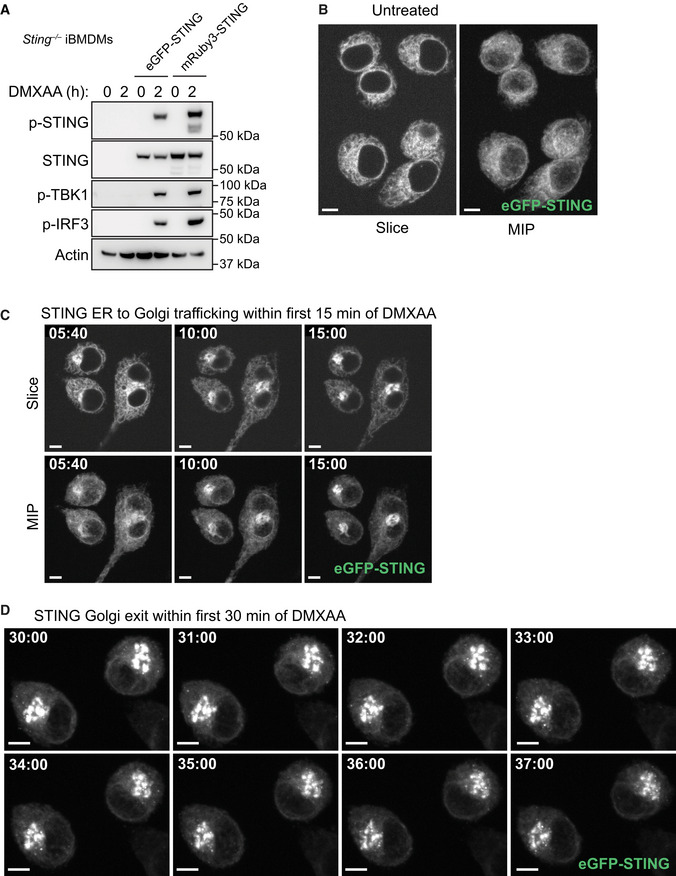
- A
Sting −/− iBMDMs alone or Sting −/− iBMDMs reconstituted with either eGFP‐ or mRuby3‐tagged STING were treated with 50 μg/ml BMDMs for 2 h. Cells were lysed for immunoblot with the indicated antibodies. Data shown are representative of three independent experiments.
- B
Sting −/− iBMDMs expressing eGFP‐STING were imaged using spinning disk microscopy in resting conditions. Data are shown as both a single Z slice and maximum intensity projection (MIP) of Z stack images. Data shown are representative of three independent experiments. Scale bar = 5 μm.
- C
Sting −/− iBMDMs expressing eGFP‐STING were imaged live on the spinning disk microscope. Images display a time series as indicated, showing STING translocation from ER to Golgi after 50 μg/ml DMXAA treatment. Data are shown as both a single Z slice and MIP of Z stack images. Data shown are representative of three independent experiments. Scale bar = 5 μm. Corresponds to Movie EV2.
- D
Sting −/− iBMDMs expressing eGFP‐STING were imaged live on the spinning disk microscope. Images display a time series as indicated, showing STING vesicles exiting the Golgi for a recording starting 30 min after 50 μg/ml DMXAA treatment. Data are shown as a MIP of Z stack images. Data shown are representative of three independent experiments. Scale bar = 5 μm. Corresponds to Movie EV5.
- A
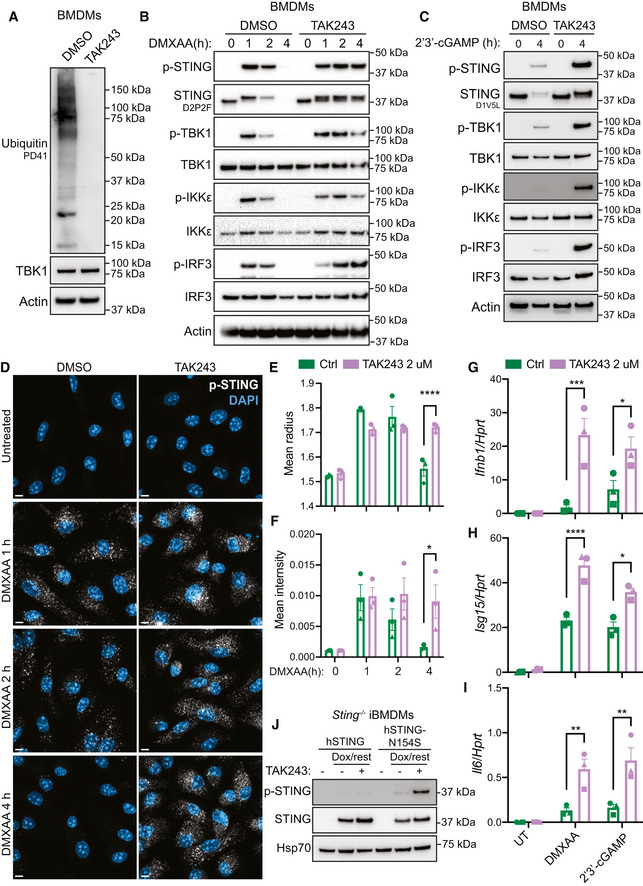
Primary BMDMs were treated with 2 μM TAK243 or DMSO vehicle control for 4.5 h. Cells were lysed for immunoblot with the indicated antibodies. Data shown are representative of three independent experiments.
- B
Primary BMDMs were treated with 2 μM TAK243 or DMSO vehicle control for 30 min before being either left untreated or treated with 25 μg/ml DMXAA for 1, 2 or 4 h. Cells were lysed for immunoblot with the indicated antibodies. Data shown are representative of three independent experiments.
- C
Primary BMDMs were treated with 2 μM TAK243 or DMSO vehicle control for 30 min before being either left untreated or treated with 10 μg/ml 2′3′‐cGAM(PS)2 for 4 h. Cells were lysed for immunoblot with the indicated antibodies. Data shown are representative of three independent experiments.
- D
Primary BMDMs were treated with 2 μM TAK243 or DMSO vehicle control for 30 min before being either left untreated (UT) or treated with 25 μg/ml DMXAA for 1, 2 or 4 h. Cells were fixed and stained for p‐STING (white) and the nucleus (DAPI; blue), before Z stack images were acquired on the LSM980 confocal microscope. Images are displayed as a maximum intensity projection (MIP) of Z stack images. Scale bar = 5 μm. Data shown are representative of three independent experiments.
- E, F
The size (i.e. mean radius) (E) and mean intensity (F) of individual p‐STING punctate regions was quantified using CellProfiler. Data are shown as mean ± SEM combined from N = 3 independent experiments. Statistical analysis was performed using two‐way ANOVA using Bonferroni's multiple comparisons test, where *P < 0.05, ****P < 0.0001. A representative experiment used for quantification is shown in (D).
- G–I
Primary BMDMs were treated with 2 μM TAK243 or DMSO vehicle control for 30 min before being either left untreated (UT) or treated with 25 μg/ml DMXAA or 10 μg/ml 2′3′‐cGAM(PS)2 for 4 h. Cells were lysed for RNA purification and the expression of Ifnb1 (G), Isg15 (H) and Il6 (I) was analysed by qPCR. Data are shown as mean ± SEM combined from N = 3 independent experiments. Statistical analysis was performed using two‐way ANOVA using Bonferroni's multiple comparisons test, where *P < 0.05, **P < 0.01, ***P < 0.001, ****P < 0.0001.
- J
Sting −/− iBMDMs expressing either WT hSTING or hSTING‐N154S were left untreated or treated with 1 μg/ml doxycycline (Dox) for 2 h. Cells were then washed and left to recover for a further 8 h in the absence or presence of 2 μM TAK243. Cells were lysed for immunoblot with indicated antibodies. Data shown are representative of three independent experiments.
- A
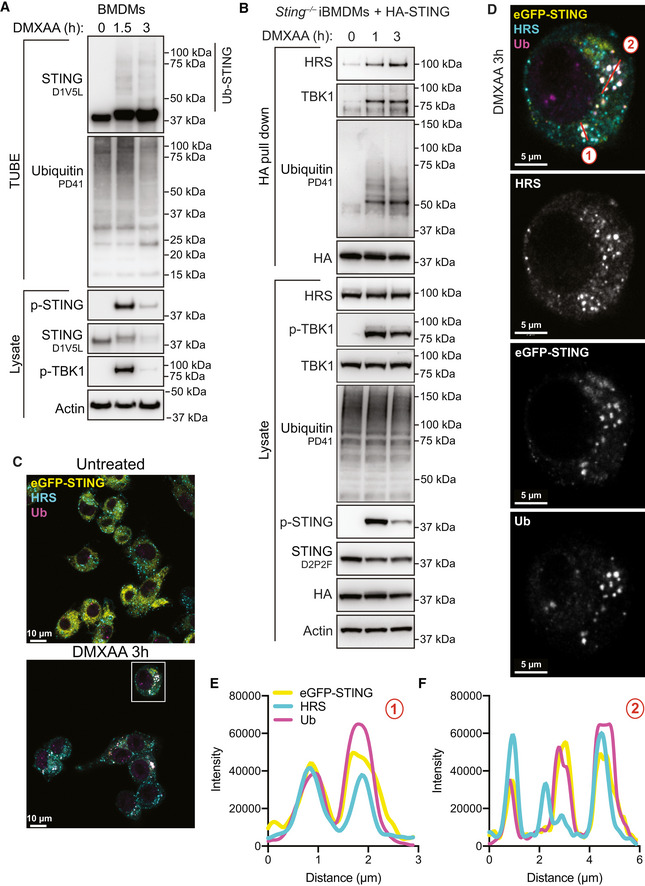
Primary BMDMs were left untreated or treated with 50 μg/ml DMXAA for 1.5 or 3 h. Cells were lysed and a portion of lysate underwent immunoblot with the indicated antibodies (i.e. lysate). The remaining lysate was incubated with TUBE beads to isolate ubiquitinated proteins. TUBE samples underwent immunoblot with the indicated antibodies. Data are representative of two independent experiments.
- B
Sting −/− iBMDMs expressing HA‐STING were left UT or treated with 50 μg/ml DMXAA for 1 or 3 h. Cells were lysed and a portion of lysate underwent immunoblot with the indicated antibodies (i.e. lysate). The remaining lysate underwent immunoprecipitation with an anti‐HA antibody (i.e. HA pull down). Samples then underwent immunoblot with the indicated antibodies. Data representative of three independent experiments.
- C
Sting −/− iBMDMs expressing eGFP‐STING (yellow) were left UT or treated with 50 μg/ml DMXAA for 3 h. Cells were fixed and underwent immunofluorescence staining for conjugated ubiquitin (Ub; magenta) and HRS (cyan). Z stack images were acquired on the LSM980 confocal microscope. Images are displayed as merged images for a single Z slice. Scale bar = 10 μm. Data shown are representative of three independent experiments.
- D
Square ROI indicates zoomed insert from (C), displayed as both merged and single colour images. Scale bar = 5 μm. Two colour merged images can be found in Fig EV4D.
- E, F
The intensity profiles were plotted for each channel for two‐line regions as indicated in (D).

- A
WT or TBK1/IKKεdKO iBMDMs were left untreated (i.e. 0 h) or treated with 50 μg/ml DMXAA for 1 or 3 h. Cells were lysed and a portion of lysate underwent immunoblot with the indicated antibodies (i.e. lysate). The remaining lysate was incubated with TUBE beads to isolate ubiquitinated proteins (i.e. TUBE). TUBE samples underwent immunoblot with the indicated antibodies. Data representative of three independent experiments.
- B
Sting −/− iBMDMs or Sting −/− iBMDMs expressing HA‐STING were left untreated or treated with 50 μg/ml DMXAA for 3 h. Cells were lysed and a portion of lysate underwent immunoblot with the indicated antibodies (i.e. lysate). The remaining lysate underwent immunoprecipitation with an anti‐HA antibody (i.e. HA pull down). Samples then underwent immunoblot with the indicated antibodies. Data representative of three independent experiments.
- C
Primary BMDMs were left untreated or treated with 50 μg/ml DMXAA for 3 h. Cells were lysed and a portion of lysate underwent immunoblot with the indicated antibodies (i.e. lysate). The remaining lysate underwent immunoprecipitation with an anti‐STING antibody (i.e. STING pull down). Samples then underwent immunoblot with the indicated antibodies. Data representative of three independent experiments.
- D
Sting −/− iBMDMs expressing eGFP‐STING (yellow) were treated with 50 μg/ml DMXAA for 3 h. Cells were fixed and underwent immunofluorescence staining for conjugated ubiquitin (Ub; magenta) and HRS (cyan). Data show two channel merged images relating to those found in Fig 5D. Scale bar = 5 μm.
- A
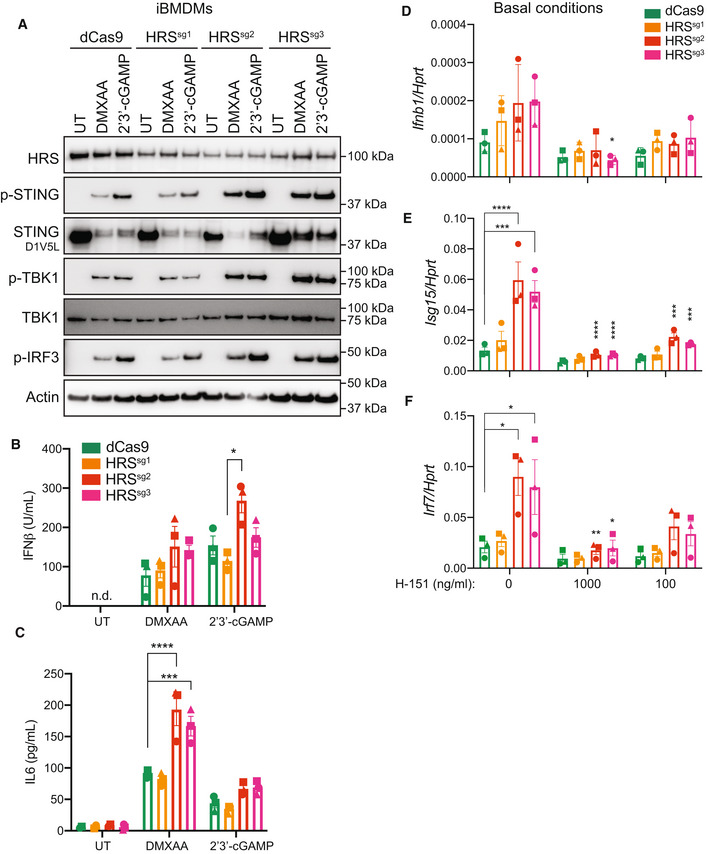
dCas9‐KRAB expressing iBMDMs, without (i.e. dCas9 alone) or with HRS‐targeting sgRNAs (i.e., sg1, sg2 or sg3) were treated for 48 h with 1 μg/ml doxycycline (Dox) to induce sgRNA expression. Cells were then left untreated (UT), or treated with 20 μg/ml DMXAA or 10 μg/ml 2′3′‐cGAM(PS)2 for 6 h. Cells were lysed for immunoblot with the indicated antibodies. Data shown are representative of three independent experiments.
- B, C
dCas9‐KRAB expressing iBMDMs, without (i.e. dCas9 alone) or with HRS‐targeting sgRNAs (i.e. sg1, sg2 or sg3) were treated for 48 h with 1 μg/ml Dox to induce sgRNA expression. Cells were then left UT, or treated with 20 μg/ml DMXAA or 5 μg/ml 2′3′‐cGAM(PS)2 for 6 h. Cell supernatant was collected and assayed for secreted IFNβ (B) and IL6 (C) by ELISA. Data are shown as mean ± SEM combined from N = 3 independent experiments. Statistical analysis was performed using two‐way ANOVA using Bonferroni's multiple comparisons test, where *P < 0.05, ***P < 0.001, ****P < 0.0001. n.d., not detected.
- D–F
dCas9‐KRAB expressing iBMDMs, without (i.e. dCas9 alone) or with HRS‐targeting sgRNAs (i.e. sg1, sg2 or sg3) were treated for 24 h with 1 μg/ml Dox to induce sgRNA expression. iBMDMs were further treated with 1 μg/ml (i.e. 1,000 ng/ml) or 100 ng/ml H‐151 as indicated and incubated for a further 24 h. Cells were lysed for RNA purification and the expression of Ifnb1 (D), Isg15 (E) and Irf7 (F) was analysed by qPCR. Data are shown as mean ± SEM combined from N = 3 independent experiments. Statistical analysis was performed using two‐way ANOVA using Tukey's multiple comparisons test, where *P < 0.05, **P < 0.01, ***P < 0.001, ****P < 0.0001. Bars display significant differences between dCas9 and sgRNA knockdowns in the absence of H‐151. Additional asterisks represent significant differences between the absence or presence of H‐151 across the same cell line.
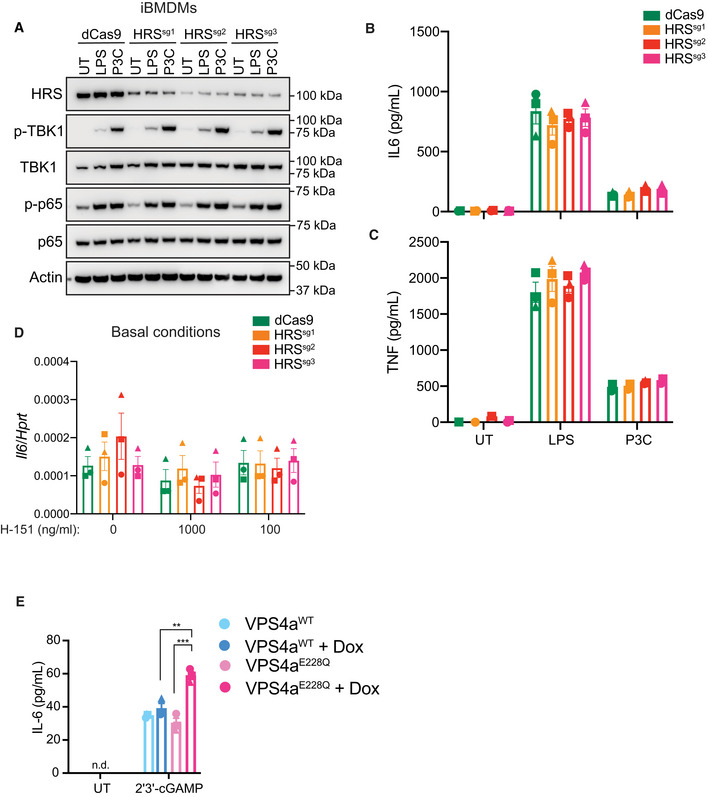
- A–C
dCas9‐KRAB expressing iBMDMs, without (i.e. dCas9 alone) or with HRS‐targeting sgRNAs (i.e. sg1, sg2 or sg3) were treated for 48 h with 1 μg/ml doxycycline (Dox) to induce sgRNA expression. Cells were then left untreated (UT), or treated with 500 ng/ml LPS or 200 ng/ml Pam3CSK4 (P3C) for 6 h. A Cells were lysed for immunoblot with the indicated antibodies. Data shown are representative of three independent experiments. (B, C) Cell supernatant was collected and assayed for secreted IL‐6 (B) or TNF (C) by ELISA. Data are shown as mean ± SEM combined from N = 3 independent experiments. Statistical analysis was performed using two‐way ANOVA using Bonferroni's multiple comparisons test, where no statically significant differences were observed across cell lines for the same treatment.
- D
dCas9‐KRAB expressing iBMDMs, without (i.e. dCas9 alone) or with HRS‐targeting sgRNAs (i.e. sg1, sg2 or sg3) were treated for 24 h with 1 μg/ml Dox to induce sgRNA expression. iBMDMs were further treated with 1 μg/ml (i.e., 1,000 ng/ml) or 100 ng/ml H‐151 as indicated and incubated for a further 24 h. Cells were lysed for RNA purification and the expression of Il6 was analysed by qPCR. Data are shown as mean ± SEM combined from N = 3 independent experiments. Statistical analysis was performed using two‐way ANOVA using Bonferroni's multiple comparisons test, where no statistically significant changes were observed.
- E
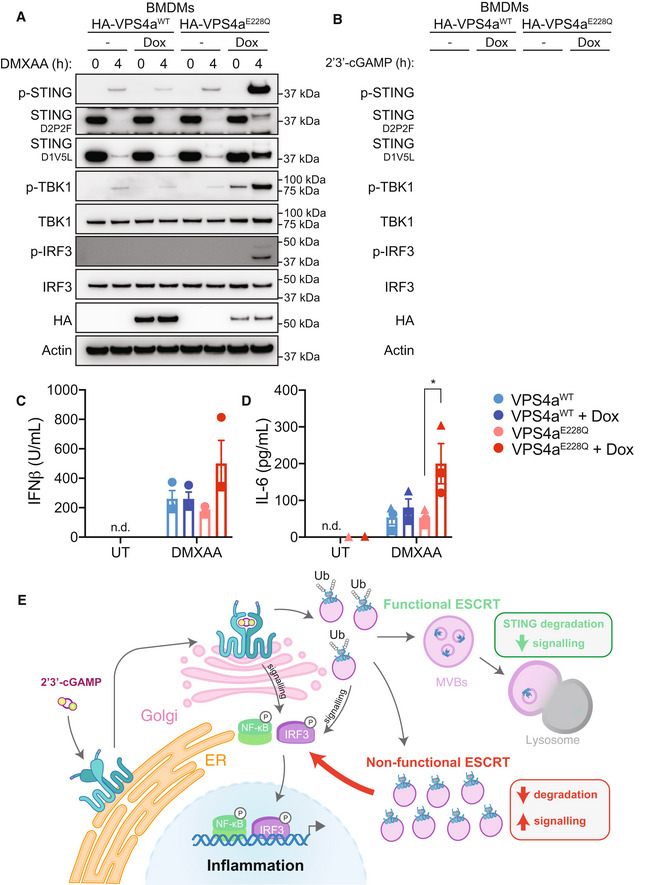
VPS4aWT or VPS4aE228Q dominant negative BMDMs were left UT or treated with 1 μg/ml Dox for 4 h. iBMDMs were then further left UT or treated with 10 μg/ml 2′3′‐cGAM(PS)2 for 4 h. Cell supernatant was collected and secreted IL‐6 was measured by ELISA. Data are shown as mean ± SEM combined from N = 3 independent experiments. Statistical analysis was performed using one‐way ANOVA using Bonferroni's multiple comparisons test, where **P < 0.01, ***P < 0.001. n.d., not detected.
- A, B
VPS4aWT or VPS4aE228Q dominant negative BMDMs were left untreated (UT) or treated with 1 μg/ml doxycycline (Dox) for 4 h. BMDMs were then further left UT or treated with 25 μg/ml DMXAA (A) or 10 μg/ml 2′3′‐cGAM(PS)2 (B) for 4 h. Cells were lysed for immunoblot with the indicated antibodies. Data shown are representative of 2 independent experiments for (A) and 3 independent experiments for (B).
- C, D
VPS4aWT or VPS4aE228Q dominant negative BMDMs were left UT or treated with 1 μg/ml Dox for 4 h. BMDMs were then further left UT or treated with 25 μg/ml DMXAA for 4 h. Cell supernatant was collected and secreted IFNβ (C) or IL‐6 (D) was measured by ELISA. Data are shown as mean ± SEM combined from N = 3 independent experiments. Statistical analysis was performed using one‐way ANOVA. using Bonferroni's multiple comparions test, where *P < 0.01. n.d., not detected.
- E
A proposed model for ESCRT‐dependent degradation and termination of STING‐mediated immune responses.
References
-
- Baker PJ, Masters SL (2018) Generation of genetic knockouts in myeloid cell lines using a lentiviral CRISPR/Cas9 system. Methods Mol Biol 1714: 41–55 - PubMed
-
- Baker PJ, De Nardo D, Moghaddas F, Tran LS, Bachem A, Nguyen T, Hayman T, Tye H, Vince JE, Bedoui S et al (2017) Posttranslational modification as a critical determinant of cytoplasmic innate immune recognition. Physiol Rev 97: 1165–1209 - PubMed
-
- Balka KR, De Nardo D (2021) Molecular and spatial mechanisms governing STING signalling. FEBS J 288: 5504–5529 - PubMed
-
- Balka KR, Louis C, Saunders TL, Smith AM, Calleja DJ, D'Silva DB, Moghaddas F, Tailler M, Lawlor KE, Zhan Y et al (2020) TBK1 and IKKepsilon act redundantly to mediate STING‐induced NF‐kappaB responses in myeloid cells. Cell Rep 31: 107492 - PubMed
Publication types
MeSH terms
Substances
LinkOut - more resources
Full Text Sources
Research Materials
