. 2023 Jul 5;51(W1):W484-W492.
doi: 10.1093/nar/gkad326.

Proksee: in-depth characterization and visualization of bacterial genomes

Affiliations

Proksee: in-depth characterization and visualization of bacterial genomes

Jason R Grant et al. Nucleic Acids Res. .

Abstract

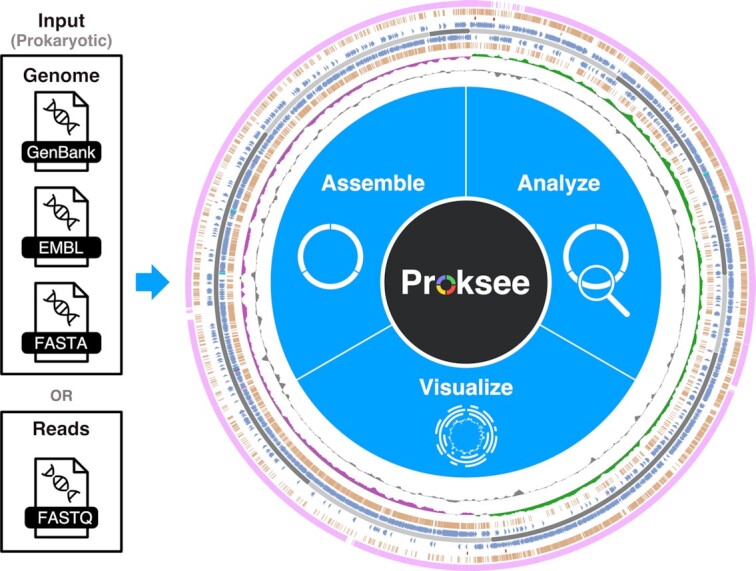
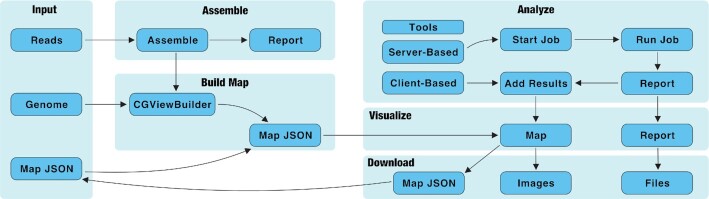
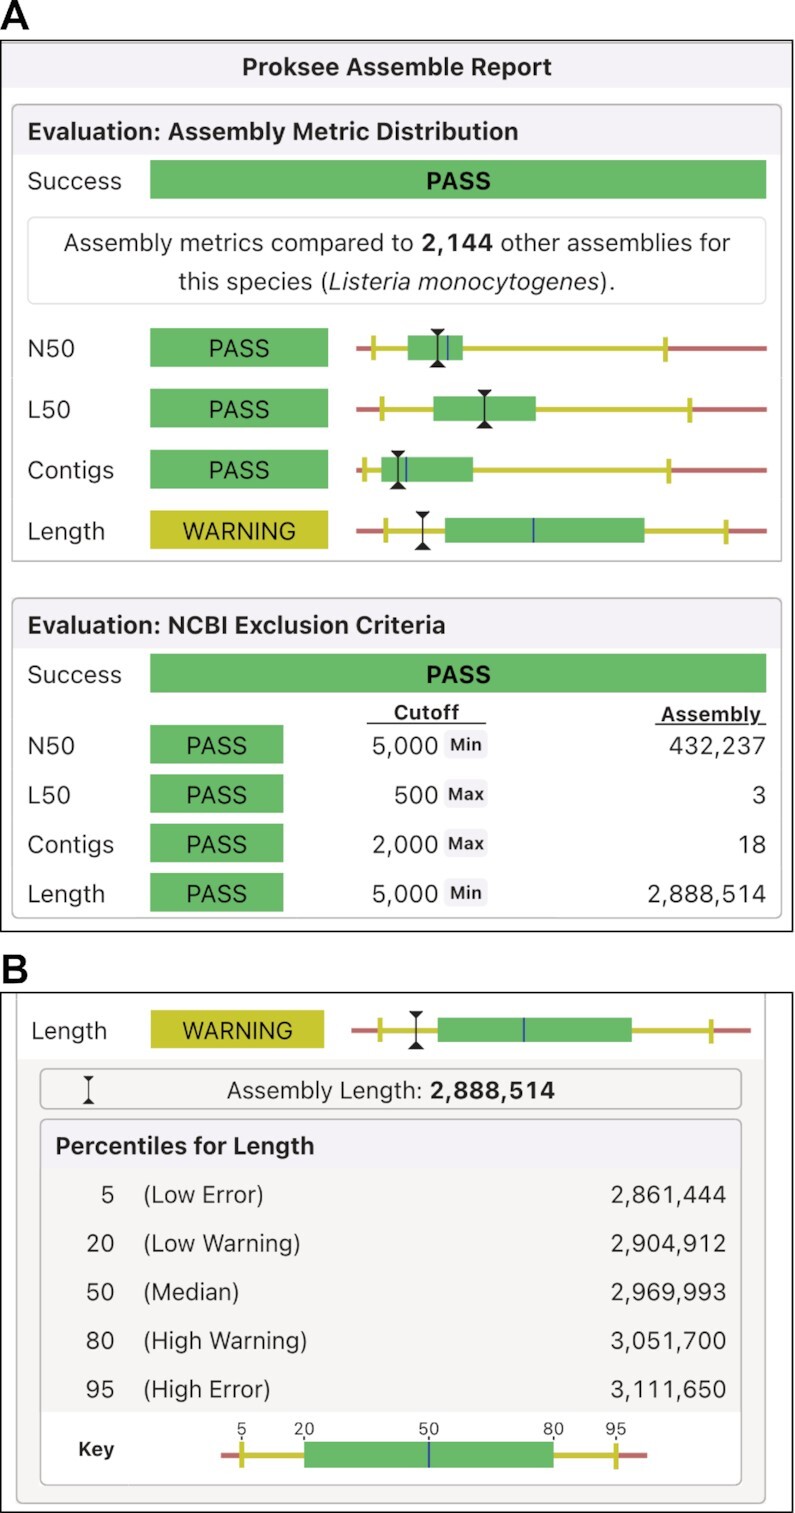
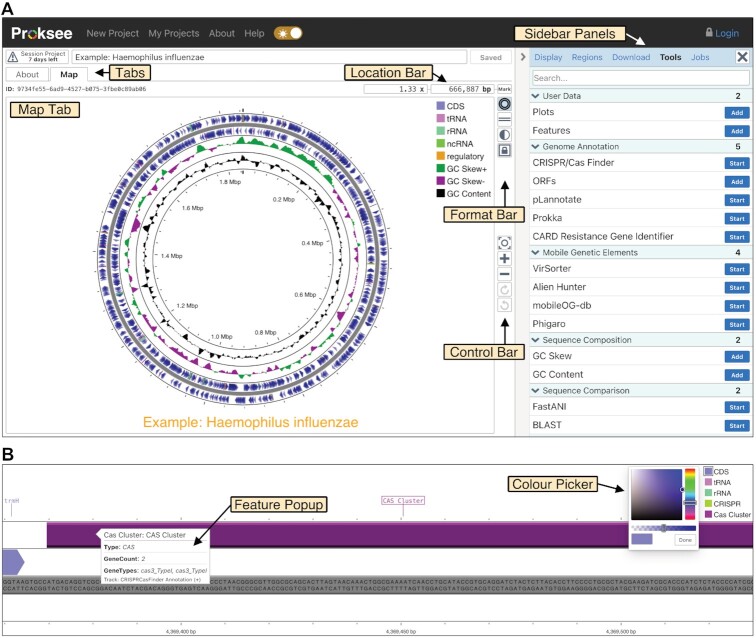
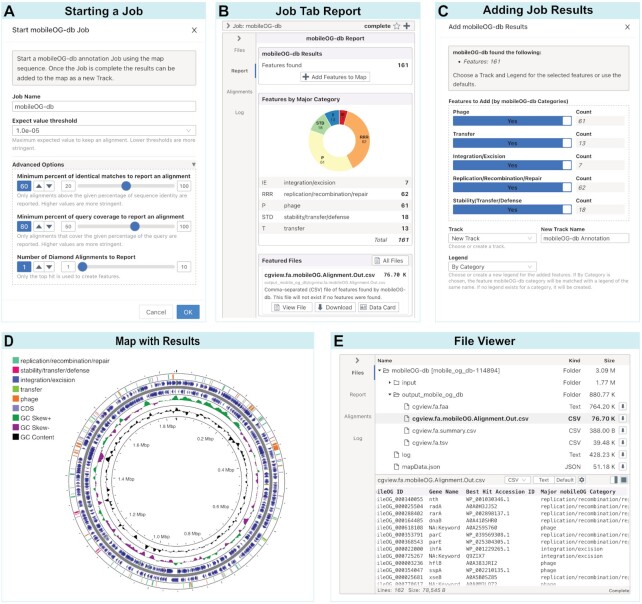
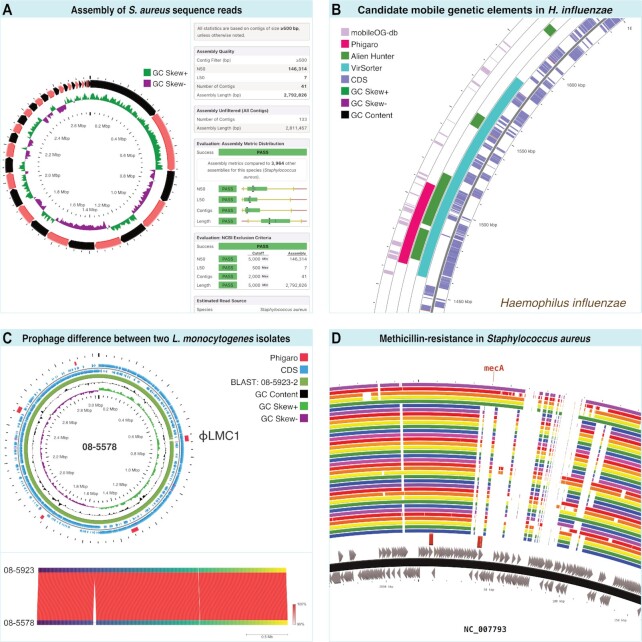
Proksee (https://proksee.ca) provides users with a powerful, easy-to-use, and feature-rich system for assembling, annotating, analysing, and visualizing bacterial genomes. Proksee accepts Illumina sequence reads as compressed FASTQ files or pre-assembled contigs in raw, FASTA, or GenBank format. Alternatively, users can supply a GenBank accession or a previously generated Proksee map in JSON format. Proksee then performs assembly (for raw sequence data), generates a graphical map, and provides an interface for customizing the map and launching further analysis jobs. Notable features of Proksee include unique and informative assembly metrics provided via a custom reference database of assemblies; a deeply integrated high-performance genome browser for viewing and comparing analysis results at individual base resolution (developed specifically for Proksee); an ever-growing list of embedded analysis tools whose results can be seamlessly added to the map or searched and explored in other formats; and the option to export graphical maps, analysis results, and log files for data sharing and research reproducibility. All these features are provided via a carefully designed multi-server cloud-based system that can easily scale to meet user demand and that ensures the web server is robust and responsive.


Figures

Graphical Abstract
Graphical Abstract
Proksee assembles, analyzes and visualizes prokaryotic genomes from a variety of inputs.
Figure 1.
Figure 1.
Proksee workflow. Proksee accepts sequencing reads, complete genomes, or map JSON as input. Genomes and reads (after being assembled) are converted into map JSON with the CGViewBuilder script. Map JSON is converted to a graphical map using CGView.js. Analyses are performed with server-based or client-based tools. Client-based tools (e.g. GC Skew) are run directly on a user's computer and the results are added to the map immediately. Server-based tool (e.g. Prokka) are run on worker servers and the results can be reviewed and added to the map when the job is complete. Server-based tools (including Assemble) produce a report with links to view and download files. Images of the map can be downloaded in SVG or PNG format. Map JSON can also be downloaded as a map archive which can be reloaded into Proksee later for further editing or to perform additional analyses.
Figure 2.
Figure 2.
Assembly report. (A) Assembly metric distribution (top) shows the assembly values compared to Proksee's custom reference database of existing assemblies for the same species. NCBI exclusion criteria (bottom) compare the assembly to NCBI’s reference sequence exclusion criteria. (B) Metric distribution details are shown when a metric is clicked. The distribution is displayed as a bar plot with the median length shown as a blue vertical line; the 20th percentile to the 80th percentile shown as a green box; the 5th to 20th percentile and 80th to 95th percentile shown as yellow lines; and above the 95th or below the 5th percentile shown as red. A black I-beam indicates the value of each metric for the project assembly.
Figure 3.
Figure 3.
Project page and map viewer. (A) The project page has a set of tabbed windows on the left (Map Tab shown) and a sidebar with multiple panels on the right (Tool Panel shown). The Map Tab consists of the interactive map as well as the following elements: the Location Bar for viewing, editing, or bookmarking the current position on the map; the Format Bar for changing the map layout (linear or circular), inverting map colours, or changing the aspect ratio; and the Control Bar for zooming, panning, or resetting the map. (B) A zoomed in view of the map showing the map sequence in the backbone, a popup from hovering over a feature (CAS Cluster), and the colour picker.
Figure 4.
Figure 4.
Server-based tool workflow. The mobileOG-db tool is shown as an example. (A) Starting a server-based tool will show the Start Dialog where the name for the job can be provided as well as any tool-specific options. (B) Completed jobs display a report card with a summary of features found and a button to add them to the map. The report also includes a list of featured files (i.e. key results files) with links to view or download each file. (C) Add Dialog for adding job results to the map with options for selecting which features to add and which track and legend to use for the added features. (D) Map with added features. Shown are the original features (i.e. CDS, tRNA, rRNA) extracted from a GenBank file (NZ_CP007470), the mobileOG-db features split into five categories (e.g. stability/transfer/defense, replication/recombination/repair, integration/excision, transfer and phage) and the results of the GC Content and GC Skew tool. (E) File Card showing the file tree of input and output files for this job (top) and the file viewer for one of the output files (bottom).
Figure 5.
Figure 5.
Case studies performed using Proksee. (A) Genome map showing contig boundaries and GC Skew following assembly of Staphylococcus aureus reads (left), and Assembly Report showing assembly metrics (right). (B) Zoomed in view of region of Haemophilus influenzae genome containing mobile genetic elements as identified using a variety of Proksee tools. (C) Prophage ϕLMC1 found in Listeria monocytogenes strain 08-5578 but not strain 08-5923 based on BLAST (top) and FastANI (bottom) comparisons. (D) Identification of methicillin-resistance gene (mecA) in Staphylococcus aureus genome and assessment of presence in 36 related genomes using BLAST.

References

    1. Bankevich A., Nurk S., Antipov D., Gurevich A.A., Dvorkin M., Kulikov A.S., Lesin V.M., Nikolenko S.I., Pham S., Prjibelski A.D.et al. .. SPAdes: a new genome assembly algorithm and its applications to single-cell sequencing. J. Comput. Biol. J. Comput. Mol. Cell Biol. 2012; 19:455–477. - PMC - PubMed
    1. Souvorov A., Agarwala R., Lipman D.J.. SKESA: strategic k-mer extension for scrupulous assemblies. Genome Biol. 2018; 19:153. - PMC - PubMed
    1. Chen I.-M.A., Chu K., Palaniappan K., Ratner A., Huang J., Huntemann M., Hajek P., Ritter S.J., Webb C., Wu D.et al. .. The IMG/M data management and analysis system v.7: content updates and new features. Nucleic Acids Res. 2023; 51:D723–D732. - PMC - PubMed
    1. Vallenet D., Calteau A., Dubois M., Amours P., Bazin A., Beuvin M., Burlot L., Bussell X., Fouteau S., Gautreau G.et al. .. MicroScope: an integrated platform for the annotation and exploration of microbial gene functions through genomic, pangenomic and metabolic comparative analysis. Nucleic Acids Res. 2020; 48:D579–D589. - PMC - PubMed
    1. Olson R.D., Assaf R., Brettin T., Conrad N., Cucinell C., Davis J.J., Dempsey D.M., Dickerman A., Dietrich E.M., Kenyon R.W.et al. .. Introducing the Bacterial and Viral Bioinformatics Resource Center (BV-BRC): a resource combining PATRIC, IRD and ViPR. Nucleic Acids Res. 2023; 51:D678–D689. - PMC - PubMed

Publication types