. 2023 Jul 7;13(7):1696-1719.
doi: 10.1158/2159-8290.CD-22-1315.

An African-Specific Variant of TP53 Reveals PADI4 as a Regulator of p53-Mediated Tumor Suppression

Affiliations

An African-Specific Variant of TP53 Reveals PADI4 as a Regulator of p53-Mediated Tumor Suppression

Alexandra Indeglia et al. Cancer Discov. .

Abstract

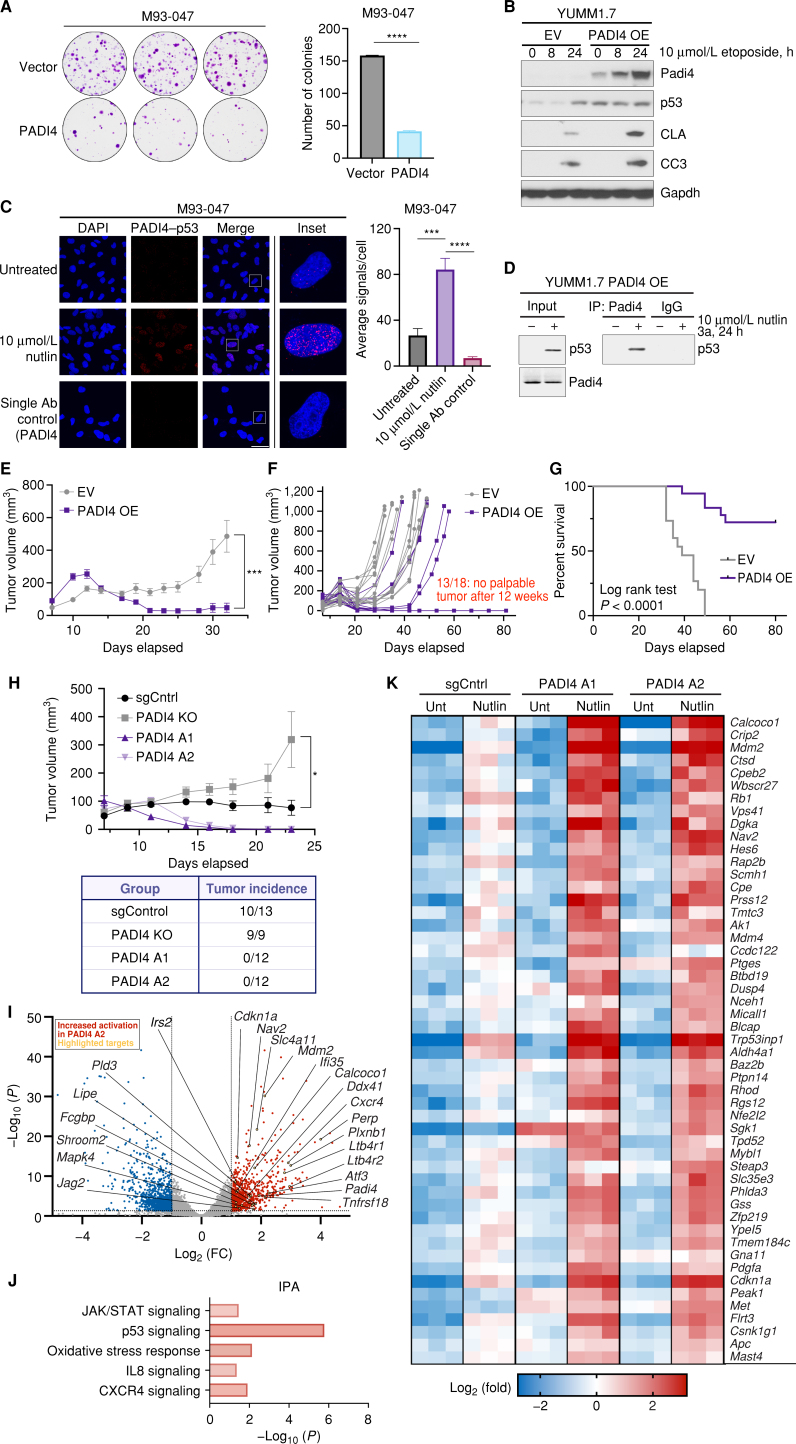
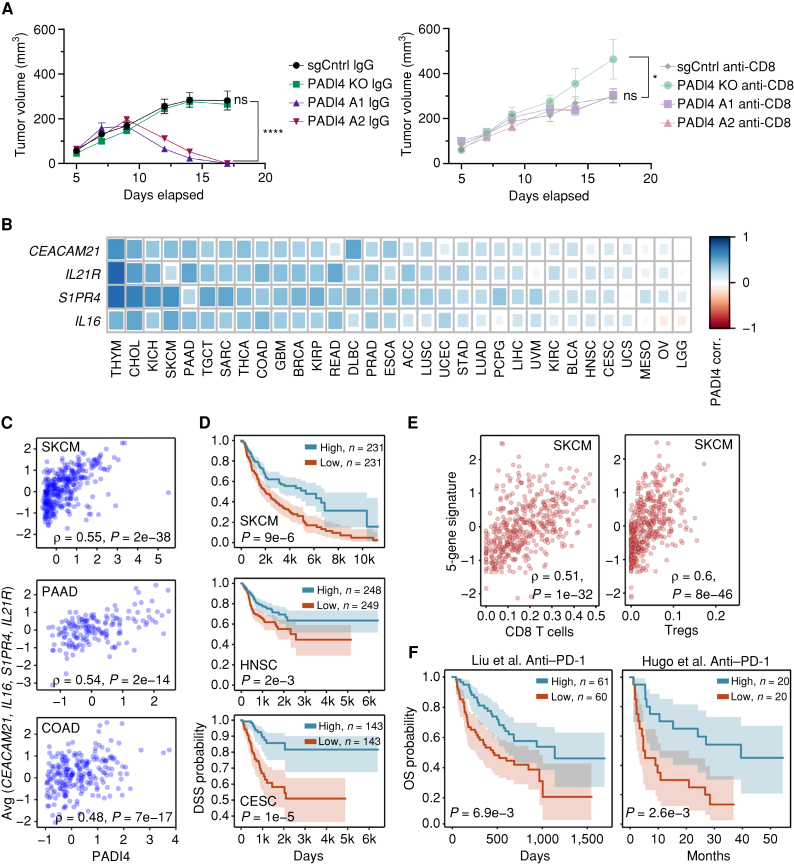
TP53 is the most frequently mutated gene in cancer, yet key target genes for p53-mediated tumor suppression remain unidentified. Here, we characterize a rare, African-specific germline variant of TP53 in the DNA-binding domain Tyr107His (Y107H). Nuclear magnetic resonance and crystal structures reveal that Y107H is structurally similar to wild-type p53. Consistent with this, we find that Y107H can suppress tumor colony formation and is impaired for the transactivation of only a small subset of p53 target genes; this includes the epigenetic modifier PADI4, which deiminates arginine to the nonnatural amino acid citrulline. Surprisingly, we show that Y107H mice develop spontaneous cancers and metastases and that Y107H shows impaired tumor suppression in two other models. We show that PADI4 is itself tumor suppressive and that it requires an intact immune system for tumor suppression. We identify a p53-PADI4 gene signature that is predictive of survival and the efficacy of immune-checkpoint inhibitors.

Significance: We analyze the African-centric Y107H hypomorphic variant and show that it confers increased cancer risk; we use Y107H in order to identify PADI4 as a key tumor-suppressive p53 target gene that contributes to an immune modulation signature and that is predictive of cancer survival and the success of immunotherapy. See related commentary by Bhatta and Cooks, p. 1518. This article is highlighted in the In This Issue feature, p. 1501.


Figures

Figure 1. Impaired colony suppression but increased apoptosis in Y107H cells and tissues. A, Colony formation assays in H1299 cells transfected with CMV vector, WT p53, or expression constructs containing the P47S or Y107H variant. Quantification of percent colony formation ± SD of triplicate wells from the same experiment. B, Human LCLs containing either WT p53, heterozygous for the Y107H variant (Y107H/WT), or heterozygous for R273H (R273H/WT) were treated with 0.1 μmol/L doxorubicin (Doxo) for 0, 8, or 24 hours and assessed by immunoblot for the indicated antibodies. C, Homozygous WT, Y107H, or p53−/− MEFs were treated with 1 μmol/L doxorubicin for 0, 8, or 24 hours and assessed by immunoblot for the indicated antibodies. D, Representative IHC from Hupki WT mice and Y107H variant mice irradiated with 5 Gy after 4 hours (n = 3 mice per condition) and stained with the indicated antibodies. Scale bar, 50 μm. γ-IR, gamma radiation. E, Percentages of positive cells from IHC of WT and Y107H mice in D. Averages ± SEM from at least three random images from n = 3 mice per condition. *, P < 0.05; **, P < 0.01; ***, P < 0.001; ns, not significant, two-tailed unpaired t test.
Figure 1.
Impaired colony suppression but increased apoptosis in Y107H cells and tissues. A, Colony formation assays in H1299 cells transfected with CMV vector, WT p53, or expression constructs containing the P47S or Y107H variant. Quantification of percent colony formation ± SD of triplicate wells from the same experiment. B, Human LCLs containing either WT p53, heterozygous for the Y107H variant (Y107H/WT), or heterozygous for R273H (R273H/WT) were treated with 0.1 μmol/L doxorubicin (Doxo) for 0, 8, or 24 hours and assessed by immunoblot for the indicated antibodies. C, Homozygous WT, Y107H, or p53−/− MEFs were treated with 1 μmol/L doxorubicin for 0, 8, or 24 hours and assessed by immunoblot for the indicated antibodies. D, Representative IHC from Hupki WT mice and Y107H variant mice irradiated with 5 Gy after 4 hours (n = 3 mice per condition) and stained with the indicated antibodies. Scale bar, 50 μm. γ-IR, gamma radiation. E, Percentages of positive cells from IHC of WT and Y107H mice in D. Averages ± SEM from at least three random images from n = 3 mice per condition. *, P < 0.05; **, P < 0.01; ***, P < 0.001; ns, not significant, two-tailed unpaired t test.
Figure 2. The Y107H variant is impaired for transactivation of a subset of p53 target genes, including PADI4, PLTP, and HHAT. A, Heat map of significantly upregulated p53 target genes from WT and Y107H LCLs in response to 10 μmol/L nutlin at 24 hours. Top, genes that are less responsive in Y107H. Columns, independent biological replicates (n = 3). B, Volcano plot of top differentially regulated genes between WT and Y107H LCLs treated with 10 μmol/L nutlin at 24 hours. Genes within the p53 pathway with significantly less response (blue) or more response (red) of at least 2-fold in Y107H vs. WT cells after nutlin treatment are highlighted. Selected p53 targets are highlighted and labeled (yellow). C, Quantitative PCR analysis of mean expression ± SD of CDKN1A (p21), PADI4, PLTP, and HHAT expression levels in WT and Y107H LCLs after 0, 8, and 24 hours of 10 μmol/L nutlin (n = 3 biological replicates). Expression is normalized to GAPDH. D, Western blot of PADI4 and the p53 target proteins indicated in WT and Y107H cells after 0, 8, and 24 hours of 10 μmol/L nutlin. Densitometry values are included for PADI4 protein levels at 24 hours of nutlin treatment, normalized to GAPDH. Analyses are representative of multiple independent replicates. E, Western blot of PADI4 and the p53 target proteins indicated in LCLs with WT p53 and multiple hypomorphic variants of p53. All lines are heterozygous for the hypomorph—that is, hypomorph/WT. R273H is a p53 hotspot mutant. Results are representative of at least 3 independent replicates. F and G, IHC from Hupki WT, Y107H, and PADI4 knockout (KO) mice irradiated with 5 Gy and analyzed after 4 hours (n = 3 mice per condition) and stained for PADI4 expression in the spleen (F) and thymus (G). Scale bar, 50 μm. H, Quantification of percent positive cells from IHC of WT, Y107H, and PADI4 KO mice in (F and G). γ-IR, gamma radiation. Averages ± SEM from at least three random images from n = 3 mice per condition. *, P < 0.05; **, P < 0.01; ***, P < 0.001; ****, P < 0.0001; ns, not significant, two-tailed unpaired t test.
Figure 2.
The Y107H variant is impaired for transactivation of a subset of p53 target genes, including PADI4, PLTP, and HHAT. A, Heat map of significantly upregulated p53 target genes from WT and Y107H LCLs in response to 10 μmol/L nutlin at 24 hours. Top, genes that are less responsive in Y107H. Columns, independent biological replicates (n = 3). B, Volcano plot of top differentially regulated genes between WT and Y107H LCLs treated with 10 μmol/L nutlin at 24 hours. Genes within the p53 pathway with significantly less response (blue) or more response (red) of at least 2-fold in Y107H vs. WT cells after nutlin treatment are highlighted. Selected p53 targets are highlighted and labeled (yellow). C, Quantitative PCR analysis of mean expression ± SD of CDKN1A (p21), PADI4, PLTP, and HHAT expression levels in WT and Y107H LCLs after 0, 8, and 24 hours of 10 μmol/L nutlin (n = 3 biological replicates). Expression is normalized to GAPDH. D, Western blot of PADI4 and the p53 target proteins indicated in WT and Y107H cells after 0, 8, and 24 hours of 10 μmol/L nutlin. Densitometry values are included for PADI4 protein levels at 24 hours of nutlin treatment, normalized to GAPDH. Analyses are representative of multiple independent replicates. E, Western blot of PADI4 and the p53 target proteins indicated in LCLs with WT p53 and multiple hypomorphic variants of p53. All lines are heterozygous for the hypomorph—that is, hypomorph/WT. R273H is a p53 hotspot mutant. Results are representative of at least 3 independent replicates. F and G, IHC from Hupki WT, Y107H, and PADI4 knockout (KO) mice irradiated with 5 Gy and analyzed after 4 hours (n = 3 mice per condition) and stained for PADI4 expression in the spleen (F) and thymus (G). Scale bar, 50 μm. H, Quantification of percent positive cells from IHC of WT, Y107H, and PADI4 KO mice in (F and G). γ-IR, gamma radiation. Averages ± SEM from at least three random images from n = 3 mice per condition. *, P < 0.05; **, P < 0.01; ***, P < 0.001; ****, P < 0.0001; ns, not significant, two-tailed unpaired t test.
Figure 3. Y107H variant shows decreased thermal stability and increased propensity to misfold. A, NMR 1H-15N heteronuclear single quantum coherence spectra of WT (red) and Y107H (blue) core domain. Peaks exhibiting chemical shifts are labeled with the corresponding residue for all with available assignments. B, Insets of chemical shifts between WT and Y107H. C, Mapping residues with altered chemical shift (yellow) to the protein structure shows that altered residues are spatially grouped near the site of the Y107H mutation (Y107 shown in pink). DNA is included here to indicate the position of the DNA-binding site. D, Crystal structure of Y107H. Superposition of p53Y107H [yellow, Protein Data Bank (PDB): 8E7A] with p53R273H/S240R (cyan, PDB: 4IBY). Y107H mutation is shown in magenta. The Zn2+ ion is drawn as a gray sphere. E, Inset of H107 (magenta) environment in the p53Y107H structure. F, The Y107H mutation thermodynamically destabilizes the core domain, as measured via DSF. Mean Tm values ± SEM are shown (n = 4 technical replicates). ****, P < 0.0001, two-tailed unpaired t test. G, Aggregation kinetics of the core domain of WT and Y107H at 40°C using ThioT. Aggregation is monitored by relative fluorescence units (RFU) ± SEM to determine ThioT binding (n = 3 independent replicates). H, WT and Y107H primary MEFs were untreated or treated with 5 μmol/L cisplatin (CDDP) for 24 hours and analyzed by indirect immunofluorescence using mutant p53 conformation-specific antibody (pAb240). Scale bar, 25 μm. I and J, Quantification of the fraction of cells containing staining for mutant conformation (I; pAb240) and total (J; CM5) p53. Data are presented as mean ± SD. n = 25 random fields of view (>250 cells) from each of 2 independent experiments. ****, P < 0.0001; ns, not significant, one-way ANOVA followed by the Tukey multiple comparisons test.
Figure 3.
Y107H variant shows decreased thermal stability and increased propensity to misfold. A, NMR 1H-15N heteronuclear single quantum coherence spectra of WT (red) and Y107H (blue) core domain. Peaks exhibiting chemical shifts are labeled with the corresponding residue for all with available assignments. B, Insets of chemical shifts between WT and Y107H. C, Mapping residues with altered chemical shift (yellow) to the protein structure shows that altered residues are spatially grouped near the site of the Y107H mutation (Y107 shown in pink). DNA is included here to indicate the position of the DNA-binding site. D, Crystal structure of Y107H. Superposition of p53Y107H [yellow, Protein Data Bank (PDB): 8E7A] with p53R273H/S240R (cyan, PDB: 4IBY). Y107H mutation is shown in magenta. The Zn2+ ion is drawn as a gray sphere. E, Inset of H107 (magenta) environment in the p53Y107H structure. F, The Y107H mutation thermodynamically destabilizes the core domain, as measured via DSF. Mean Tm values ± SEM are shown (n = 4 technical replicates). ****, P < 0.0001, two-tailed unpaired t test. G, Aggregation kinetics of the core domain of WT and Y107H at 40°C using ThioT. Aggregation is monitored by relative fluorescence units (RFU) ± SEM to determine ThioT binding (n = 3 independent replicates). H, WT and Y107H primary MEFs were untreated or treated with 5 μmol/L cisplatin (CDDP) for 24 hours and analyzed by indirect immunofluorescence using mutant p53 conformation-specific antibody (pAb240). Scale bar, 25 μm. I and J, Quantification of the fraction of cells containing staining for mutant conformation (I; pAb240) and total (J; CM5) p53. Data are presented as mean ± SD. n = 25 random fields of view (>250 cells) from each of 2 independent experiments. ****, P < 0.0001; ns, not significant, one-way ANOVA followed by the Tukey multiple comparisons test.
Figure 4. Y107H mice show significantly increased cancer risk. A, Kaplan–Meier analysis of survival between Hupki WT p53 (n = 36) and Y107H mice (n = 35). P = 0.001 using a log-rank test. B, Summary of cancer incidence in Hupki WT and Y107H mice. Data are representative of 36 WT and 35 Y107H mice. BCL, B-cell lymphoma; HCC, hepatocellular carcinoma; HS, histiocytic sarcoma. C, Hematoxylin and eosin staining of tumors from the Y107H mouse. Top left, HCC in the liver. Top middle, breast carcinoma (BCA). Top right, hemangiosarcoma (HSA) within the liver. Bottom left, adrenocortical carcinoma (ACCA). Bottom middle, osteosarcoma (OSA) metastasized to the lung. (The * indicates it is not the primary tumor site but a metastatic lesion in the lung.) Bottom right, BCL in an enlarged lymph node. Scale bar, 100 μm. D, Kaplan–Meier analysis of survival between WT (n = 15) and Y107H (n = 15) mice after fractionated radiation. P = 0.06 using the log-rank test. E, Proportion of WT and Y107H mice that underwent fractionated radiation with thymic tumors. Analyzed proportion of mice with disseminated lymphoma using Fisher exact test; **, P = 0.008. TCL, T-cell lymphoma. F, Representative images of liver, spleen, and thymus sizes at the time of harvest in Y107H mice compared with WT following fractionated radiotherapy. Scale bar, 80 mm. G–I, Mean weights ± SEM of thymus (G), spleen (H), and liver (I) tissue from healthy age-matched mice or mice that underwent fractionated radiotherapy. J, Tumor growth of E1A/Ras-transformed MEFs with WT p53 (n = 12) or the Y107H variant (n = 12) subcutaneously injected into NOD scid gamma mice. K–M, Tumor weights (K), tumor volumes (L), and representative tumor sizes (M) from WT and Y107H E1A/Ras xenografts, shown as mean weights ± SEM. *, P < 0.05; **, P < 0.01; ****, P < 0.0001; ns, not significant, two-tailed paired t test with Welch correction.
Figure 4.
Y107H mice show significantly increased cancer risk. A, Kaplan–Meier analysis of survival between Hupki WT p53 (n = 36) and Y107H mice (n = 35). P = 0.001 using a log-rank test. B, Summary of cancer incidence in Hupki WT and Y107H mice. Data are representative of 36 WT and 35 Y107H mice. BCL, B-cell lymphoma; HCC, hepatocellular carcinoma; HS, histiocytic sarcoma. C, Hematoxylin and eosin staining of tumors from the Y107H mouse. Top left, HCC in the liver. Top middle, breast carcinoma (BCA). Top right, hemangiosarcoma (HSA) within the liver. Bottom left, adrenocortical carcinoma (ACCA). Bottom middle, osteosarcoma (OSA) metastasized to the lung. (The * indicates it is not the primary tumor site but a metastatic lesion in the lung.) Bottom right, BCL in an enlarged lymph node. Scale bar, 100 μm. D, Kaplan–Meier analysis of survival between WT (n = 15) and Y107H (n = 15) mice after fractionated radiation. P = 0.06 using the log-rank test. E, Proportion of WT and Y107H mice that underwent fractionated radiation with thymic tumors. Analyzed proportion of mice with disseminated lymphoma using Fisher exact test; **, P = 0.008. TCL, T-cell lymphoma. F, Representative images of liver, spleen, and thymus sizes at the time of harvest in Y107H mice compared with WT following fractionated radiotherapy. Scale bar, 80 mm. G–I, Mean weights ± SEM of thymus (G), spleen (H), and liver (I) tissue from healthy age-matched mice or mice that underwent fractionated radiotherapy. J, Tumor growth of E1A/Ras-transformed MEFs with WT p53 (n = 12) or the Y107H variant (n = 12) subcutaneously injected into NOD scid gamma mice. K–M, Tumor weights (K), tumor volumes (L), and representative tumor sizes (M) from WT and Y107H E1A/Ras xenografts, shown as mean weights ± SEM. *, P < 0.05; **, P < 0.01; ****, P < 0.0001; ns, not significant, two-tailed paired t test with Welch correction.
Figure 5. Y107H colorectal cancer cells show increased sensitivity to the glutaminase inhibitor CB-839. A, Schematic of CRISPR generation of HCT116 colorectal cancer cells with the Y107H mutation (clones A11 and C2) and subsequent screen for compounds that induce enhanced loss of viability in Y107H clones. (Created with BioRender.com.) B, Log IC50 of compounds against HCT116 cells with WT p53 or the Y107H clones A11 and C2. Compounds showing significantly increased sensitivity in both Y107H clones are indicated. C, Tumor growth of HCT116 cells with WT p53 or Y107H clone A11 in NSG mice (n = 10–12 per group) after treatment of vehicle or CB-839. After tumors reached 50 mm3, vehicle or CB-839 was administered 2× daily by oral gavage. Linear mixed model estimated difference in decreased tumor growth rate (mm3/day) by treatment with CB-839. ****, P < 0.0001; ns, not significant. D, Final tumor volume, shown as mean volume ± SEM of HCT116 tumors treated with vehicle or CB-839. ****, P < 0.0001; ns, not significant. E, Representative images of HCT116 tumors treated with vehicle or CB-839. F, Representative IHC from HCT116 tumors (n = 3–5 mice per condition) treated with vehicle or CB-839 and stained for the indicated antibodies. Scale bar, 50 μm. G, Percentages of positive cells of IHC HCT116 tumors. Averages ± SEM from at least three random images from n = 3–5 mice per condition. H, HCT116 cells were treated with 40 μmol/L CB-839 for 24 hours and assessed by Western blot for the indicated antibodies. **, P < 0.01; ****, P < 0.0001; ns, not significant, two-tailed unpaired t test with Welch correction.
Figure 5.
Y107H colorectal cancer cells show increased sensitivity to the glutaminase inhibitor CB-839. A, Schematic of CRISPR generation of HCT116 colorectal cancer cells with the Y107H mutation (clones A11 and C2) and subsequent screen for compounds that induce enhanced loss of viability in Y107H clones. (Created with BioRender.com.) B, Log IC50 of compounds against HCT116 cells with WT p53 or the Y107H clones A11 and C2. Compounds showing significantly increased sensitivity in both Y107H clones are indicated. C, Tumor growth of HCT116 cells with WT p53 or Y107H clone A11 in NSG mice (n = 10–12 per group) after treatment of vehicle or CB-839. After tumors reached 50 mm3, vehicle or CB-839 was administered 2× daily by oral gavage. Linear mixed model estimated difference in decreased tumor growth rate (mm3/day) by treatment with CB-839. ****, P < 0.0001; ns, not significant. D, Final tumor volume, shown as mean volume ± SEM of HCT116 tumors treated with vehicle or CB-839. ****, P < 0.0001; ns, not significant. E, Representative images of HCT116 tumors treated with vehicle or CB-839. F, Representative IHC from HCT116 tumors (n = 3–5 mice per condition) treated with vehicle or CB-839 and stained for the indicated antibodies. Scale bar, 50 μm. G, Percentages of positive cells of IHC HCT116 tumors. Averages ± SEM from at least three random images from n = 3–5 mice per condition. H, HCT116 cells were treated with 40 μmol/L CB-839 for 24 hours and assessed by Western blot for the indicated antibodies. **, P < 0.01; ****, P < 0.0001; ns, not significant, two-tailed unpaired t test with Welch correction.
Figure 6. PADI4 interacts with p53 and has tumor-suppressive properties. A, Colony formation assays in M93-047 cells transfected with CMV vector alone or expression construct containing WT PADI4. Quantification of mean colony number ± SD of triplicate wells from the same experiment. B, YUMM1.7 cells were stably transfected with CMV vector alone or an expression construct containing WT murine PADI4. Cells were treated with 10 μmol/L etoposide for the indicated time points and subjected to Western blot analysis. EV, empty vector; OE, overexpression. C, M93-047 cells were treated with 10 μmol/L nutlin for 24 hours, and PADI4–p53 interaction was assessed using a proximity ligation assay. White boxes denote the enlarged insets. Scale bar, 50 μm. Quantification of the average number of proximity ligation assay signals per cell is expressed as mean ± SD. n = 6 random fields of view (>100 cells). Ab, antibody. D, Immunoprecipitation (IP) of PADI4 from YUMM1.7 cells with stable transfection of murine PADI4 after treatment with vehicle or 10 μmol/L nutlin for 24 hours. Immunoprecipitation of PADI4- or IgG-negative control was followed by immunoblotting for p53. E–G, Tumor volumes (E), spider plots (F), and survival curve (G) of YUMM1.7 cells with stable transfection of vector (n = 16) or PADI4 (n = 18) subcutaneously injected into C57Bl/6 mice. For tumor volumes, data are represented as mean ± SEM. *, P < 0.05; ***, P < 0.001, two-tailed unpaired t test with Welch correction. Survival curve, P < 0.0001 using a log-rank test. H, Average tumor volumes of tumor-bearing C57Bl/6 mice subcutaneously injected with YUMM1.7 cells expressing CRISPR machinery for sgControl (n = 13), PADI4 KO (n = 9), or two independent pools of CRISPRa activation guides for PADI4 (n = 12 each). Bottom, tumor incidence for each group is shown in the table. Data, mean ± SEM. I, Volcano plot of differentially regulated genes between YUMM1.7 sgControl and PADI4 activation pool 2 treated with 10 μmol/L nutlin for 24 hours. Genes with significantly less responsive (blue) or more responsive (red) of at least 2-fold are highlighted. Selected genes are labeled. J, IPA of genes significantly increased in expression in response to nutlin in both PADI4 activation clones compared with sgControl as identified by RNA-seq. K, Heat map of top differentially expressed p53 target genes from YUMM1.7 sgControl and both PADI4 activation pools treated with 10 μmol/L nutlin for 24 hours. Columns indicate independent biological replicates (n = 3). Unt, untreated.
Figure 6.
PADI4 interacts with p53 and has tumor-suppressive properties. A, Colony formation assays in M93-047 cells transfected with CMV vector alone or expression construct containing WT PADI4. Quantification of mean colony number ± SD of triplicate wells from the same experiment. B, YUMM1.7 cells were stably transfected with CMV vector alone or an expression construct containing WT murine PADI4. Cells were treated with 10 μmol/L etoposide for the indicated time points and subjected to Western blot analysis. EV, empty vector; OE, overexpression. C, M93-047 cells were treated with 10 μmol/L nutlin for 24 hours, and PADI4–p53 interaction was assessed using a proximity ligation assay. White boxes denote the enlarged insets. Scale bar, 50 μm. Quantification of the average number of proximity ligation assay signals per cell is expressed as mean ± SD. n = 6 random fields of view (>100 cells). Ab, antibody. D, Immunoprecipitation (IP) of PADI4 from YUMM1.7 cells with stable transfection of murine PADI4 after treatment with vehicle or 10 μmol/L nutlin for 24 hours. Immunoprecipitation of PADI4- or IgG-negative control was followed by immunoblotting for p53. EG, Tumor volumes (E), spider plots (F), and survival curve (G) of YUMM1.7 cells with stable transfection of vector (n = 16) or PADI4 (n = 18) subcutaneously injected into C57Bl/6 mice. For tumor volumes, data are represented as mean ± SEM. *, P < 0.05; ***, P < 0.001, two-tailed unpaired t test with Welch correction. Survival curve, P < 0.0001 using a log-rank test. H, Average tumor volumes of tumor-bearing C57Bl/6 mice subcutaneously injected with YUMM1.7 cells expressing CRISPR machinery for sgControl (n = 13), PADI4 KO (n = 9), or two independent pools of CRISPRa activation guides for PADI4 (n = 12 each). Bottom, tumor incidence for each group is shown in the table. Data, mean ± SEM. I, Volcano plot of differentially regulated genes between YUMM1.7 sgControl and PADI4 activation pool 2 treated with 10 μmol/L nutlin for 24 hours. Genes with significantly less responsive (blue) or more responsive (red) of at least 2-fold are highlighted. Selected genes are labeled. J, IPA of genes significantly increased in expression in response to nutlin in both PADI4 activation clones compared with sgControl as identified by RNA-seq. K, Heat map of top differentially expressed p53 target genes from YUMM1.7 sgControl and both PADI4 activation pools treated with 10 μmol/L nutlin for 24 hours. Columns indicate independent biological replicates (n = 3). Unt, untreated.
Figure 7. PADI4 suppresses tumor growth in an immune-dependent manner; a PADI4 gene signature predicts survival in cancer and response to anti–PD-1. A, Average tumor volumes of tumor-bearing C57Bl/6 mice subcutaneously injected with YUMM1.7 cells expressing CRISPR machinery for sgControl (sgCntrl), PADI4 KO, or two independent pools of CRISPRa activation guides for PADI4. Mice were intraperitoneally injected with IgG (left graph) or anti-CD8 (right graph) prior to tumor injection and once weekly after injection. n = 10 mice per condition. *, P < 0.05; ****, P < 0.0001; ns, not significant, two-tailed unpaired t test with Welch correction. B, Heat map showing the Spearman rank correlation coefficients correlating the gene expression levels of four genes that are impaired for transactivation by Y107H (CEACAM21, IL16, S1PR4, and IL21R) and correlated with PADI4 expression across TCGA cancer types. C, Scatter plots correlating PADI4 (x-axes) with the average (Avg) gene expression level of four genes transactivated by Y107H (y-axes) in TCGA skin cutaneous melanoma (SKCM), pancreatic ductal adenocarcinoma (PAAD), and colon adenocarcinoma (COAD). Spearman rank correlation coefficients and P values are indicated. DSS, disease-specific survival. D, Kaplan–Meier survival curves comparing the survival between patients with a high vs. low (using the median as threshold) 5-gene score (averaging the levels of PADI4, CEACAM21, IL16, S1PR4, and IL21R) in TCGA SKCM, head and neck squamous cell carcinoma (HNSC), and cervical squamous cell carcinoma (CESC). Log-rank P values are indicated. E, Scatter plots correlating CIBERSORT-inferred CD8+ T cells and regulatory T cells (Treg; x-axes) with the 5-gene score (y-axes). Spearman rank correlation coefficients and P values are indicated. F, Kaplan–Meier survival curves comparing the survival between patients with a high vs. low (using the median as threshold) 5-gene score in two melanoma cohorts of patients treated with anti–PD-1. Log-rank P values are indicated. OS, overall survival.
Figure 7.
PADI4 suppresses tumor growth in an immune-dependent manner; a PADI4 gene signature predicts survival in cancer and response to anti–PD-1. A, Average tumor volumes of tumor-bearing C57Bl/6 mice subcutaneously injected with YUMM1.7 cells expressing CRISPR machinery for sgControl (sgCntrl), PADI4 KO, or two independent pools of CRISPRa activation guides for PADI4. Mice were intraperitoneally injected with IgG (left graph) or anti-CD8 (right graph) prior to tumor injection and once weekly after injection. n = 10 mice per condition. *, P < 0.05; ****, P < 0.0001; ns, not significant, two-tailed unpaired t test with Welch correction. B, Heat map showing the Spearman rank correlation coefficients correlating the gene expression levels of four genes that are impaired for transactivation by Y107H (CEACAM21, IL16, S1PR4, and IL21R) and correlated with PADI4 expression across TCGA cancer types. C, Scatter plots correlating PADI4 (x-axes) with the average (Avg) gene expression level of four genes transactivated by Y107H (y-axes) in TCGA skin cutaneous melanoma (SKCM), pancreatic ductal adenocarcinoma (PAAD), and colon adenocarcinoma (COAD). Spearman rank correlation coefficients and P values are indicated. DSS, disease-specific survival. D, Kaplan–Meier survival curves comparing the survival between patients with a high vs. low (using the median as threshold) 5-gene score (averaging the levels of PADI4, CEACAM21, IL16, S1PR4, and IL21R) in TCGA SKCM, head and neck squamous cell carcinoma (HNSC), and cervical squamous cell carcinoma (CESC). Log-rank P values are indicated. E, Scatter plots correlating CIBERSORT-inferred CD8+ T cells and regulatory T cells (Treg; x-axes) with the 5-gene score (y-axes). Spearman rank correlation coefficients and P values are indicated. F, Kaplan–Meier survival curves comparing the survival between patients with a high vs. low (using the median as threshold) 5-gene score in two melanoma cohorts of patients treated with anti–PD-1. Log-rank P values are indicated. OS, overall survival.

Comment in

References

    1. Fischer M. Census and evaluation of p53 target genes. Oncogene 2017;36:3943–56. - PMC - PubMed
    1. Pfister NT, Prives C. Transcriptional regulation by wild-type and cancer-related mutant forms of p53. Cold Spring Harb Perspect Med 2017;7:a026054. - PMC - PubMed
    1. Vousden KH, Prives C. Blinded by the light: the growing complexity of p53. Cell 2009;137:413–31. - PubMed
    1. Kandoth C, McLellan MD, Vandin F, Ye K, Niu B, Lu C, et al. Mutational landscape and significance across 12 major cancer types. Nature 2013;502:333–9. - PMC - PubMed
    1. Zhang C, Liu J, Xu D, Zhang T, Hu W, Feng Z. Gain-of-function mutant p53 in cancer progression and therapy. J Mol Cell Biol 2020;12:674–87. - PMC - PubMed

Publication types