. 2023 Aug 7;220(8):e20221941.
doi: 10.1084/jem.20221941. Epub 2023 May 4.

Intracellular trafficking of HLA-E and its regulation

Affiliations

Intracellular trafficking of HLA-E and its regulation

Wanlin He et al. J Exp Med. .

Abstract

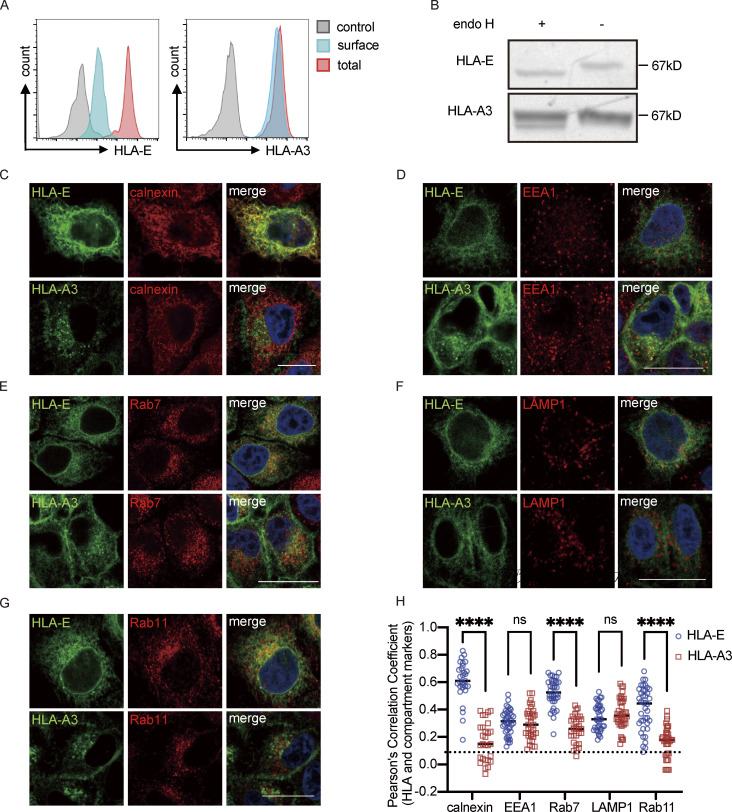
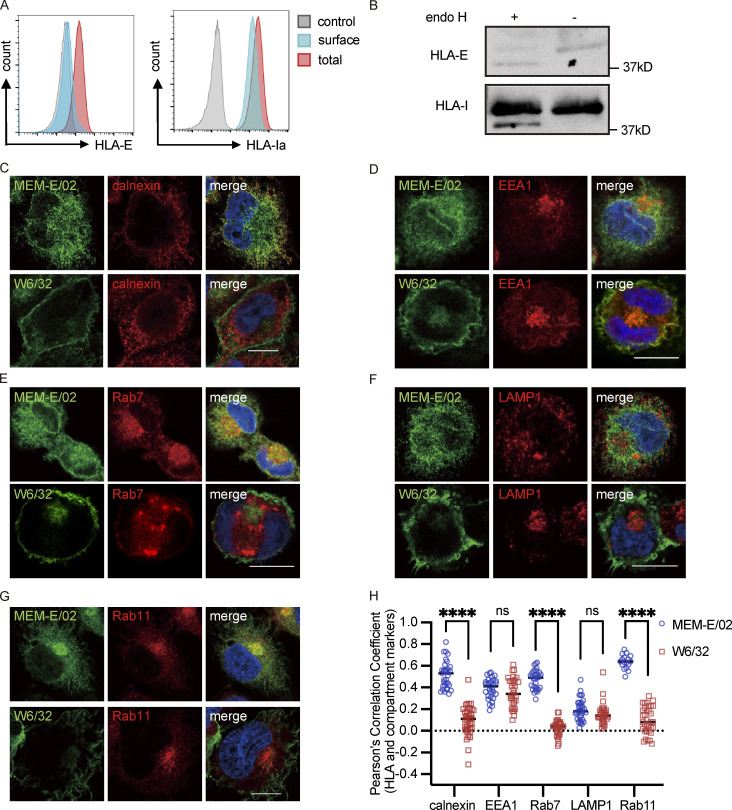
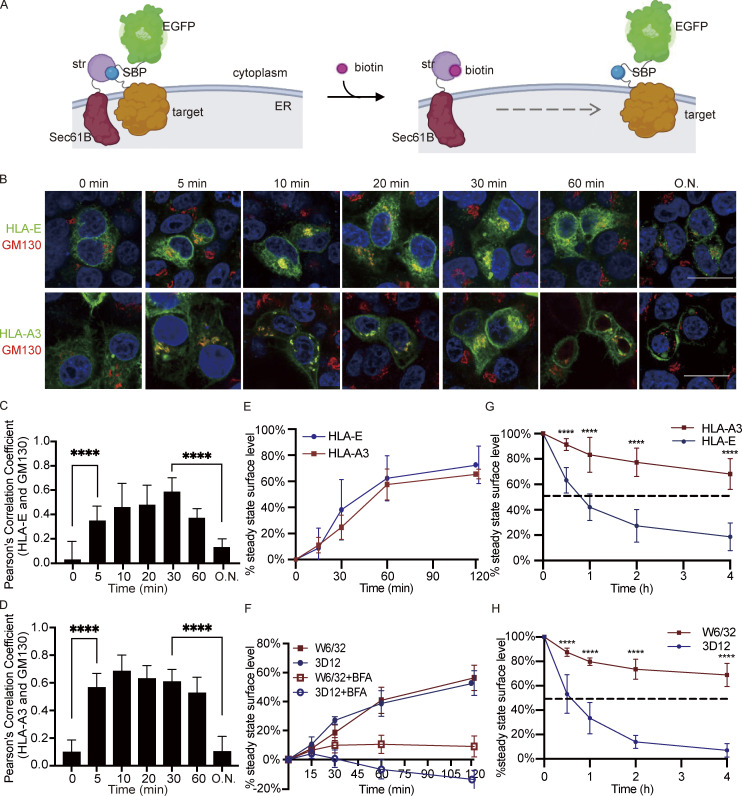
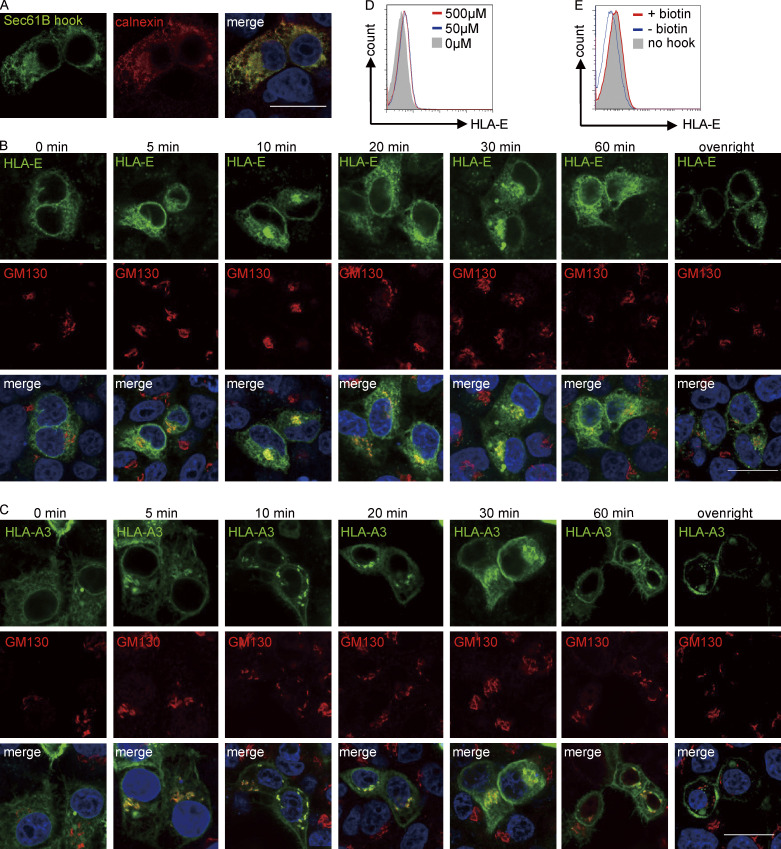
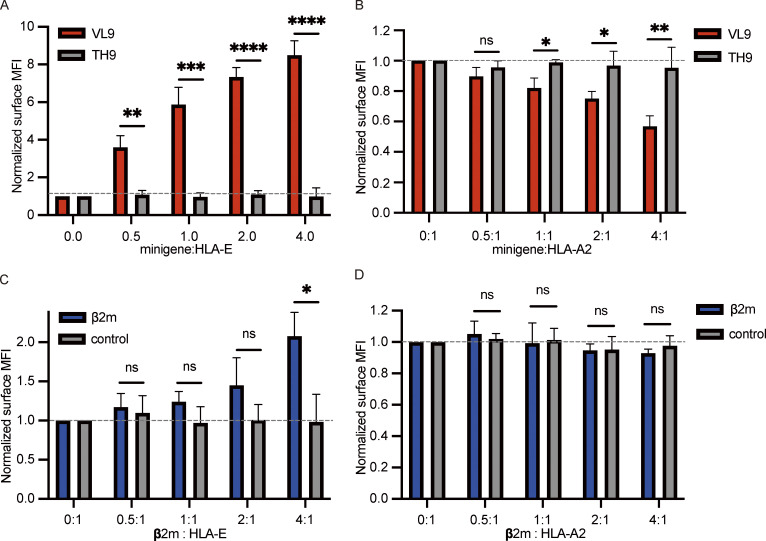
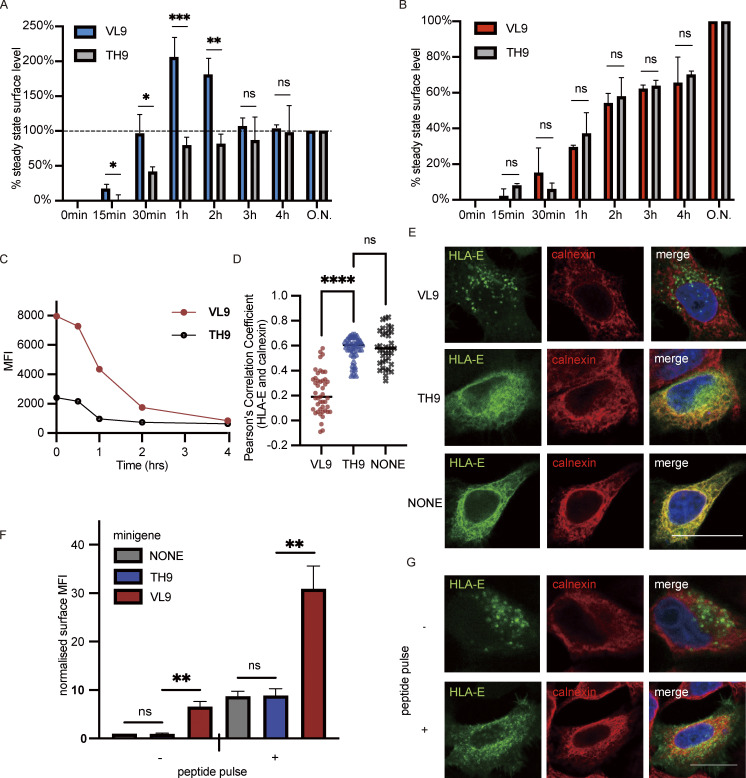
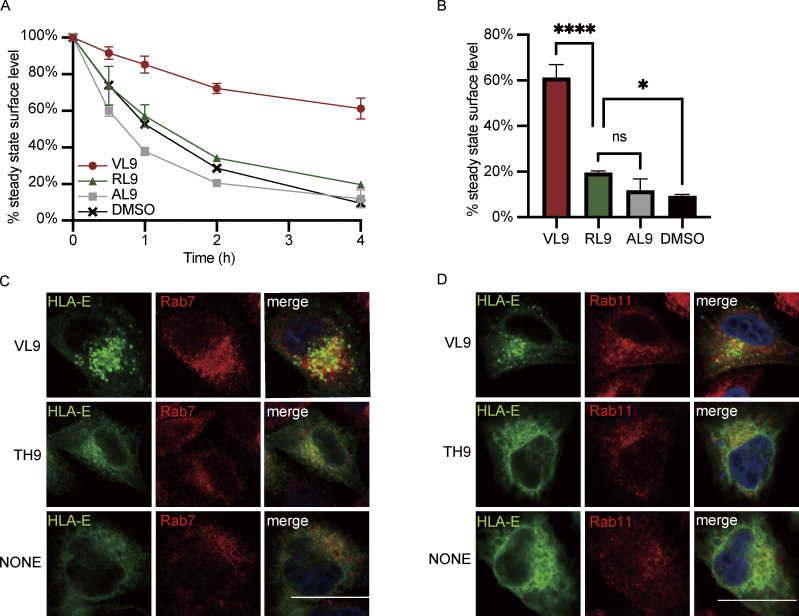
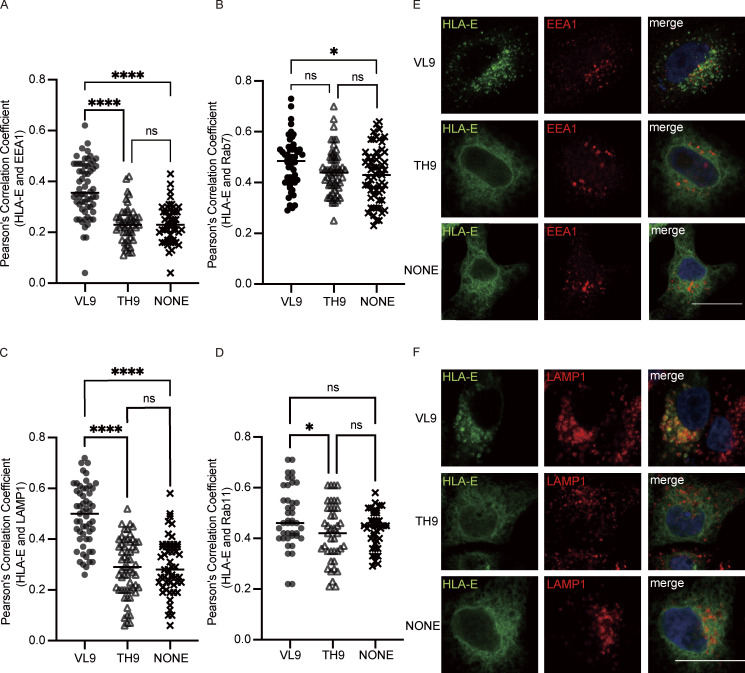
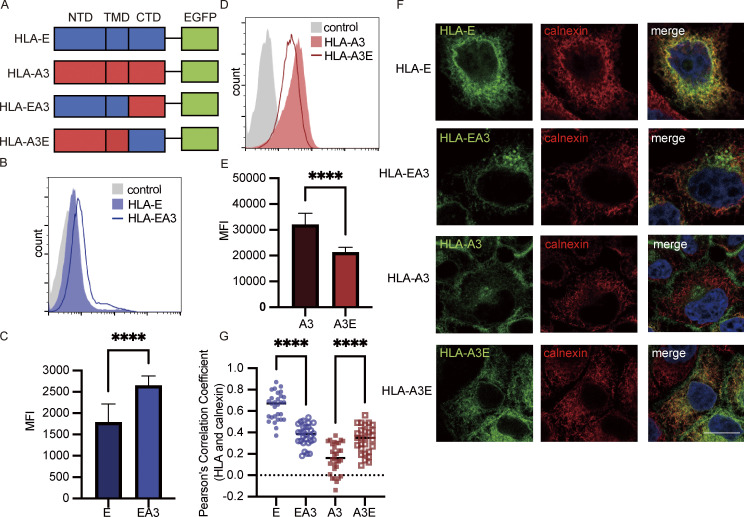
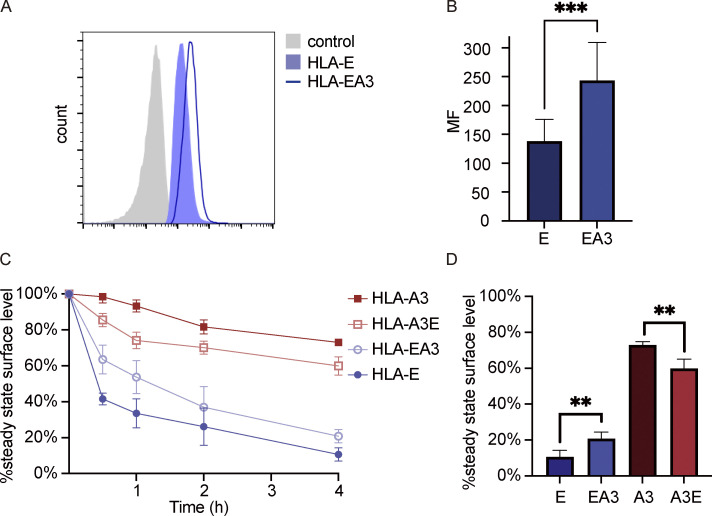
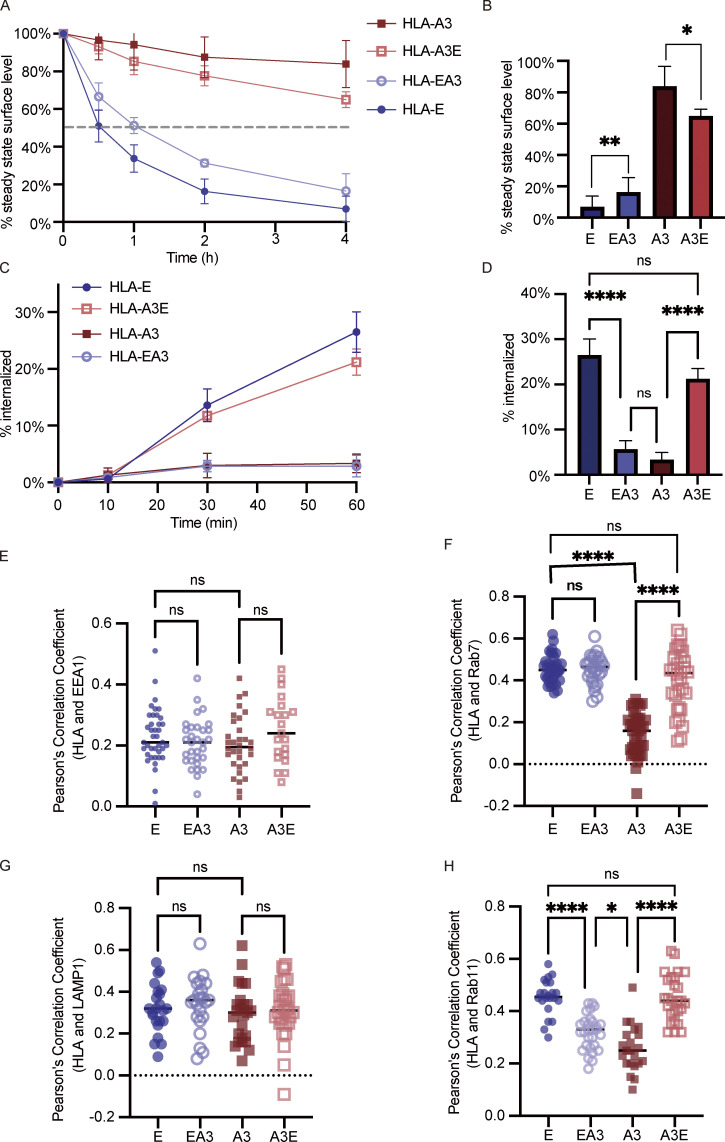
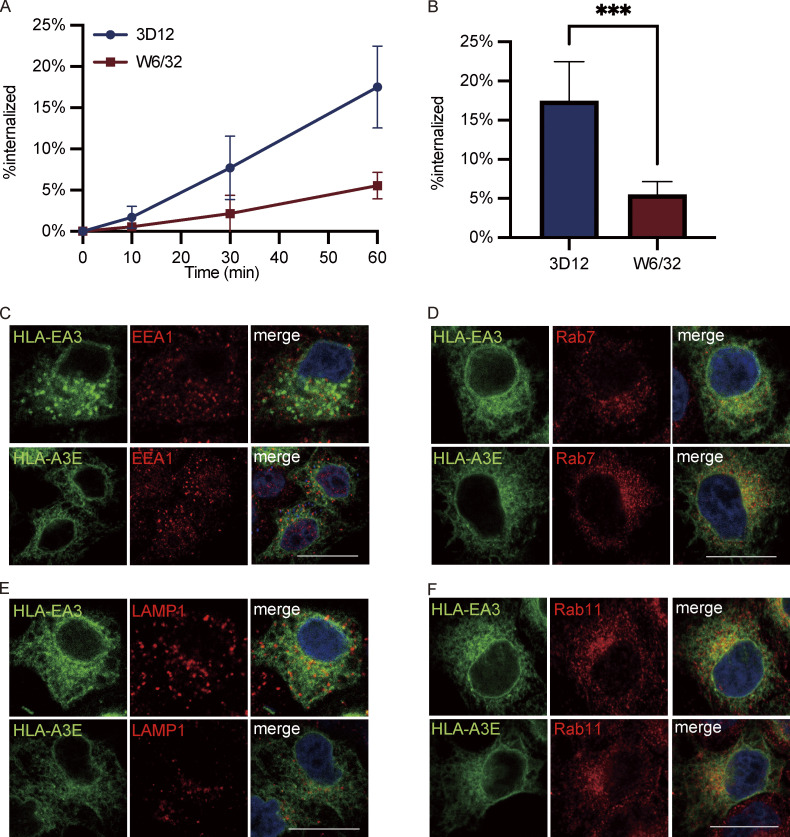
Interest in MHC-E-restricted CD8+ T cell responses has been aroused by the discovery of their efficacy in controlling simian immunodeficiency virus (SIV) infection in a vaccine model. The development of vaccines and immunotherapies utilizing human MHC-E (HLA-E)-restricted CD8+ T cell response requires an understanding of the pathway(s) of HLA-E transport and antigen presentation, which have not been clearly defined previously. We show here that, unlike classical HLA class I, which rapidly exits the endoplasmic reticulum (ER) after synthesis, HLA-E is largely retained because of a limited supply of high-affinity peptides, with further fine-tuning by its cytoplasmic tail. Once at the cell surface, HLA-E is unstable and is rapidly internalized. The cytoplasmic tail plays a crucial role in facilitating HLA-E internalization, which results in its enrichment in late and recycling endosomes. Our data reveal distinctive transport patterns and delicate regulatory mechanisms of HLA-E, which help to explain its unusual immunological functions.


Conflict of interest statement

Disclosures: A.J. McMichael reported grants from NIAID, BMGF, and the Chinese Academy of Medical Sciences–Oxford University Institute during the conduct of the study, personal fees from T-Cypher Bio, and “other” from E-Biotherapy outside the submitted work. In addition, A.J. McMichael, S. Brackenridge, and G.M. Gillespie are named inventors on a patent for HLA-E–binding epitope discovery issued, a patent for stabilizing peptide–HLA-E complexes issued, a patent for TCRs for anti-HIV T cells issued, a patent for antibodies that target HLA-E–host peptide complexes and uses thereof issued and a patent for monoclonal antibodies specific for cancer peptide–HLA-E pending. A.J. McMichael is also a named co-inventor of a patent for HLA-E binding, with royalties paid. He has ongoing discussions about forming a spin-out company, E-Biotherapy. This company is presently dormant. No other disclosures were reported.

Figures

Figure 1.
Figure 1.
Intracellular distribution of HLA-E. (A) HeLa.E or HeLa.A3 were collected for flow cytometry analysis. Representative graphs of total expression (red) and surface expression (blue) of HLA-E or HLA-A3 are shown. MFI of the unstained sample (gray) was used as the negative control. MFIs shown here are representative of observations made in six independent experiments. (B) Lysates of HeLa.E or HeLa.A3 were treated with Endo H, followed by detection with immunoblotting using an anti-EGFP antibody. Figures shown here are representative of three independent experiments. (C–G) Representative micrographs of HeLa.E or HeLa.A3. After fixation and permeabilization, cells were stained with antibodies against marker proteins for ER (calnexin; C), early endosome (EEA1; D), late endosome (Rab7; E), lysosome (LAMP1; F), and recycling endosome (Rab11; G), followed by detection with Alexa568-conjugated secondary antibody. Scale bars = 20 μm. Micrographs shown here are representative of two independent experiments. (H) Quantification of colocalization of HLA-E or HLA-A3 with different marker proteins from Fig. 1, C–G. The PCC values of each cell and the mean values are shown with 20–40 cells per sample. Statistical analysis was performed using unpaired two-tailed Student’s t test with Welch’s correction. Asterisks show the statistical significance between indicated groups: ns, not significant; ****, P < 0.0001. Source data are available for this figure: SourceData F1.
Figure S1.
Figure S1.
Intracellular distribution of HLA-E in THP1-derived macrophages. (A) THP1-derived macrophages were collected for flow cytometry analysis. Representative graphs of total expression (red) and surface expression (blue) of HLA-E or HLA-Ia are shown. MFI of the unstained sample (gray) was used as the negative control. MFIs shown here are representative of observations made in six independent experiments. (B) Lysates of THP1-derived macrophages were treated with Endo H, followed by detection with immunoblotting. Figures shown here are representative of three independent experiments. (C–G) Representative micrographs of THP1-derived macrophages. Cells were fixed, permeabilized, and co-stained with rabbit antibodies against different marker proteins (ER [calnexin; C], early endosome [EEA1; D], late endosome [Rab7; E], lysosome [LAMP1; F], recycling endosome [Rab11; G]), and mouse antibodies against different HLA-Imolecules (HLA-E [MEM-E/02], HLA-Ia [W6/32]). Cells were then stained with anti-rabbit Alexa568 and anti-mouse Alexa488 secondary antibodies. Scale bars = 10 μm. Micrographs shown here are representative of two independent experiments. (H) Quantification of colocalization of HLA-E or HLA-Ia with different marker proteins from Fig. S1, C–G. The PCC values of each cell and the mean values are shown with 30–40 cells per sample. Statistical analysis was performed using unpaired two-tailed Student’s t test with Welch’s correction. Asterisks show the statistical significance between indicated groups: ns, not significant; ****, P < 0.0001. Source data are available for this figure: SourceData FS1.
Figure 2.
Figure 2.
Intracellular transport of HLA-E. (A) Schematic diagram of the RUSH system. The reporter complex contains the target protein (HLA-E or HLA-A3) with SBP and EGFP fused to the C terminus. The hook contains streptavidin (str) fused to the N terminus of the ER-resident protein Sec61B, which retains the reporter complex in the ER through the interaction between SBP and streptavidin. Biotin binds to streptavidin and enables the trafficking of the target protein out of ER. The figure was adapted from Boncompain et al. (2012) and created with BioRender.com. (B–D) HeLa cells were transiently cotransfected with Sec61B-streptavidin and HLA-E_SBP_EGFP or HLA-A3_SBP_EGFP. At different time points after biotin addition, cells were fixed, permeabilized, and stained with an antibody against the Golgi marker protein GM130, followed by detection with an Alexa568-conjugated secondary antibody. (B) Representative micrographs of two independent experiments. Scale bars = 20 μm. (C and D) Quantification of Golgi colocalization for HLA-E (C) or HLA-A3 (D). O.N., overnight. At each time point, PCC was calculated for 10–20 individual cells, and the data are shown as mean ± SD (error bars). (E) HEK 293T cells were transiently cotransfected with Sec61B-streptavidin and HLA-E_SBP_EGFP (blue circle) or HLA-A3_SBP_EGFP (red square). At different time points after biotin addition, cells were collected for flow cytometry analysis. The stable cell surface MFI after the biotin addition overnight was set to 100%, the MFI before biotin addition was set to 0%, and the other values were normalized accordingly. Data were collected for three biological runs and are shown as mean ± SD (error bars). (F) Surface HLA molecules on THP1-derived macrophages were stripped off by citric acid, and then cells were incubated in media with (hollow) or without (solid) BFA for different time points before flow cytometry analysis. The average cell surface MFI for time point zero was set to 0%, the average cell surface MFI without acid stripping was set to 100%, and the following values were normalized as its percentage. Data were collected for three biological runs and are shown as mean ± SD (error bars). (G and H) HeLa cells stably expressing HLA-A3 (red square) or HLA-E (blue circle; F) or THP1-derived macrophages (G) were incubated in media containing BFA for different time points, and surface expression of HLA molecules was assessed. The average cell surface MFI for time point zero was set to 100%, and the following values were normalized as their percentage. The dashed lines represent 50%. Data were collected for three biological runs and are shown as mean ± SD (error bars). Statistical analysis was performed using unpaired two-tailed Student’s t test with Welch’s correction. Asterisks show the statistical significance between indicated groups: ****, P < 0.0001.
Figure S2.
Figure S2.
Application of the RUSH system to study intracellular transport. (A) Representative micrographs of HeLa cells transiently expressing the hook Sec61B_streptavidin. Cells were fixed, permeabilized, and stained with a mouse antibody against streptavidin and a rabbit antibody against the ER marker protein calnexin, followed by detection with anti-mouse Alexa488 and anti-rabbit Alexa568 secondary antibodies. Scale bar = 20 μm. Micrographs shown here are representative of two independent experiments. (B and C) Representative micrographs of HeLa cells transiently expressing Sec61B_streptavidin and HLA-E_SBP_EGFP (B) or HLA-A3_SBP_EGFP (C). At different time points after biotin addition, cells were fixed, permeabilized, and stained with an antibody against the Golgi marker protein GM130, followed by detection with an Alexa568-conjugated secondary antibody. Scale bars = 20 μm. Micrographs shown here are representative of two independent experiments. (D) HEK 293T cells were transiently cotransfected with Sec61B-streptavidin and HLA-E_SBP_EGFP. 8 h after transfection, different concentrations of biotin were added. 24 h after transfection, cells were collected for flow cytometry analysis, and surface expression of HLA-E was assessed. MFIs shown here are representative of observations made in three independent experiments. (E) HEK 293T cells were transiently transfected with HLA-E_SBP_EGFP (gray area) or cotransfected with Sec61B-streptavidin and HLA-E_SBP_EGFP (red and blue lines). 8 h after transfection, biotin (50 μM final) was added to the +biotin group (red line). 24 h after transfection, cells were collected for flow cytometry analysis, and surface expression of HLA-E was assessed. MFIs shown here are representative of observations made in three experiments.
Figure 3.
Figure 3.
The effect of peptides and β2m on HLA-E surface expression. (A and B) HEK 293T cells were transiently cotransfected with HLA-E_EGFP and different peptide minigenes. (C and D) HEK 293T cells were transiently cotransfected with HLA-E_EGFP and β2m_EGFP or EGFP (control). The amount of HLA-E plasmid and total plasmid were the same in all samples. Expression of HLA-E and endogenous HLA-A2 were assessed. The surface level was normalized to the MFI of the sample only transfected with HLA-E_EGFP. MFIs were collected for three biological runs, and data are shown as mean ± SD (error bars). Statistical analysis was performed using unpaired two-tailed Student’s t test with Welch’s correction. Asterisks show the statistical significance between indicated groups: ns, not significant; *, P < 0.05; **, P < 0.01; ***, P < 0.001; ****, P < 0.0001.
Figure 4.
Figure 4.
VL9 peptide increases HLA-E surface expression mainly by promoting ER export. (A and B) HEK 293T cells were transiently cotransfected with different peptide minigenes and the RUSH system with Sec61B-streptavidin as the hook and HLA-E_SBP_EGFP (A) or HLA-A3_SBP_EGFP (B) as the reporter protein. At different time points after biotin addition, the surface expression of HLA-E or HLA-A3 was assessed. The stable cell surface MFI after the biotin addition overnight was set to 100%, the MFI before biotin addition was set to 0%, and the other values were normalized accordingly. Data were collected for three biological runs and are shown as mean ± SD (error bars). (C) HEK 293T cells transiently cotransfected with HLA-E_EGFP and different peptide minigenes were incubated in media containing BFA for different time points, and surface expression of HLA-E molecules was assessed. The average cell surface MFIs are shown, and the results are representative of observations made in three experiments. (D and E) HeLa cells were transiently transfected with HLA-E_EGFP or co-transfected with HLA-E_EGFP and different peptide minigenes. Cells were fixed, permeabilized, and stained with an antibody against the ER marker protein calnexin, followed by detection with an Alexa647-conjugated secondary antibody. (D) Quantification of ER colocalization. PCC was calculated for 30–50 individual cells, and the PCC values of each cell and the mean values are shown. (E) Representative confocal micrographs of different conditions. Scale bar = 20 μm. Micrographs shown here are representative of two independent experiments. (F) HEK 293T cells were transiently cotransfected with HLA-E_EGFP and different peptide minigenes. 8 h after transfection, VL9 peptide (100 μM final) was added to the peptide pulse–positive group, and an equal amount of DMSO was added to the peptide pulse–negative group as the control. 24 h after transfection, cells were collected for flow cytometry analysis. The surface expression of HLA-E was normalized to the MFI of the control group with neither minigene transfection nor peptide pulse treatment. (G) Representative micrographs of HeLa cells transiently transfected with HLA-E_EGFP and VL9 peptide minigene. 8 h after transfection, VL9 peptide (100 nM) was added to the peptide pulse–positive group, and an equal amount of DMSO was added to the peptide pulse–negative group as the control. 24 h after transfection, cells were fixed, permeabilized, and stained with an antibody against the ER marker protein calnexin, followed by detection with an Alexa647-conjugated secondary antibody. Scale bar = 20 μm. Micrographs shown here are representative of two independent experiments. Statistical analysis was performed using unpaired two-tailed Student’s t test with Welch’s correction (A and B) or one-way ANOVA with Tukey’s post-hoc test (D and F). Asterisks show the statistical significance between indicated groups: ns, not significant; *, P < 0.05; **, P < 0.01; ***, P < 0.001; ****, P < 0.0001.
Figure S3.
Figure S3.
Functions of HLA-E peptides. (A and B) K562E cells were first incubated in media containing different peptides for 3 h before BFA addition. After BFA incubation for different time points, the surface expression of HLA-E molecules was assessed. (A) The average cell surface MFI for time point zero of each sample was set to 100% and the following values were normalized as its percentage. (B) Percentage of surface HLA-E after BFA incubation for 4 h. MFIs were collected and plotted for three biological runs, and data are shown as mean ± SD (error bars). Statistical analysis was performed using one-way ANOVA with Tukey’s post-hoc test. Asterisks show the statistical significance between indicated groups: ns, not significant; *, P < 0.05; ****, P < 0.0001. (C and D) Representative micrographs of HeLa cells transiently transfected with HLA-E_EGFP or cotransfected with HLA-E_EGFP and different peptide minigenes. Cells were fixed, permeabilized, and stained with antibodies against protein markers of the late endosome (Rab7; C) or the recycling endosome (Rab11; D). Cells were then stained with Alexa647-conjugated secondary antibody. Scale bar = 20 μm. Micrographs shown here are representative of two independent experiments.
Figure 5.
Figure 5.
VL9 peptide enriches HLA-E in early endosomes and lysosomes. HeLa cells were transiently transfected with HLA-E_EGFP or cotransfected with HLA-E_EGFP and different peptide minigenes. Cells were fixed, permeabilized, and stained with antibodies against protein markers of the early endosome (EEA1), late endosome (Rab7), lysosome (LAMP1), or recycling endosome (Rab11). Cells were then stained with Alexa647-conjugated secondary antibody. (A–D) Quantification of colocalization of HLA-E with different marker proteins. The PCC values of each cell and the mean values are shown with 30–60 cells per sample. Statistical analysis was performed using one-way ANOVA with Tukey’s post-hoc test. Asterisks show the statistical significance between indicated groups: ns, not significant; *, P < 0.05; ****, P < 0.0001. (E and F) Representative confocal micrographs of HLA-E colocalizing with early endosome (E) or lysosome (F) under different conditions. Scale bar = 20 μm. Data shown are representative of two independent experiments.
Figure 6.
Figure 6.
HLA-E cytoplasmic tail contributes to intracellular accumulation. (A) Schematic representation of different HLA constructs. HLA-EA3 has the N-terminal domain (NTD) and transmembrane domain (TMD) of HLA-E and the cytoplasmic tail (CTD) of HLA-A3. HLA-A3E has the NTD and TMD of HLA-A3 and the CTD of HLA-A3. All constructs were tagged with EGFP on the C terminus. (B–E) HeLa cells stably expressing different HLA molecules were collected for flow cytometry analysis. (B) Representative graph of surface MFI of HLA-E (light blue area) and HLA-EA3 (dark blue line). (D) Representative graph of surface MFI of HLA-A3 (light red area) or HLA-A3E (dark red line). MFI of the unstained sample (gray area) was used as the negative control. MFIs shown here are representative of observations made in six experiments. (C and E) MFIs were collected and plotted for six biological runs, and data are shown as mean ± SD (error bars). (F and G) HeLa cells stably expressing different HLA molecules were fixed, permeabilized, and stained with an antibody against the ER marker protein calnexin, followed by detection with an Alexa568-conjugated secondary antibody. (F) Representative confocal micrographs of HeLa cells stably expressing different HLA molecules. Scale bar = 20 μm. Micrographs shown here are representative of two independent experiments. (G) Quantification of colocalization of different constructs with the ER marker protein calnexin. The PCC values of each cell and the mean values are shown with 20–40 cells per sample. Statistical analysis was performed using paired two-tailed Student’s t test (C and E) or unpaired two-tailed Student’s t test with Welch’s correction (G). Asterisks show the statistical significance between indicated groups: ****, P < 0.0001.
Figure S4.
Figure S4.
EGFP tagging does not seem to significantly affect the function of HLA-E cytoplasmic tail. (A and B) HEK293T cells were transiently cotransfected with EGFP and HLA-E or HLA-EA3 without EGFP tagging. 24 h after transfection, cells were collected for flow cytometry analysis (gated on GFP+ cells). Expression of HLA molecules was assessed with anti-HLA-E antibody (3D12). (A) Representative graph of surface MFI of HLA-E (light blue area) and HLA-EA3 (dark blue line). MFI of unstained samples (gray area) was used as the negative control. MFI shown here is representative of the observations made in five experiments. (B) MFI were collected and plotted for five biological runs, and data were shown as mean ± SD (error bars). (C and D) HEK293T cells were transiently cotransfected with EGFP and different HLA constructs without EGFP tagging. 24 h after transfection, cells were incubated in media containing BFA for different time points, and the surface expression of HLA molecules was assessed. (C) The average cell surface MFI for time point zero was set to 100% and the following values were normalized as its percentage. (D) The percentage of HLA on the cell surface after BFA incubation for 4 h. Data were collected for six biological runs and are shown as mean ± SD (error bars). Statistical analysis was performed using paired (B) or unpaired (D) two-tailed Student’s t test. Asterisks show the statistical significance between indicated groups: **, P < 0.01; ***, P < 0.001.
Figure 7.
Figure 7.
HLA-E cytoplasmic tail facilitates internalization and endosomal enrichment. (A and B) HeLa cells stably expressing different HLA constructs were incubated in media containing BFA for different time points, and surface expression of HLA molecules was assessed. (A) The average cell surface MFI for time point zero was set to 100% and the following values were normalized as their percentage. The dashed line represents 50%. (B) The percentage of HLA on the cell surface after BFA incubation for 4 h. Data were collected for four biological runs and are shown as mean ± SD (error bars). (C and D) Surface HLA molecules of HeLa stable cell lines were labeled, and then the cells were incubated in media containing primaquine. After different time points of internalization, samples were collected, and uninternalized surface antibody–HLA complexes were stripped off using citric acid. (C) The MFI of antibody-labeled cells without acid stripping was set to 100%, and the MFI of antibody-labeled cells with acid stripping but without internalization was set to 0%. The percentage of internalization was quantified by the normalization of MFI increase accordingly. (D) The percentage of HLA internalized after 1 h. Data were collected for four biological runs and are shown as mean ± SD (error bars). (E–H) HeLa cells stably expressing different HLA constructs were fixed, permeabilized, and stained with antibodies against protein markers for early endosome (EEA1; E), late endosome (Rab7; F), lysosome (LAMP1; G), or recycling endosome (Rab11; H). Cells were then stained with Alexa568-conjugated secondary antibody. The colocalization of HLA-E, HLA-EA3, HLA-A3, and HLA-A3E with different endosomal compartment markers was quantified using PCC, with 20–40 cells per sample. The PCC values of each cell and the mean values are shown. Micrographs shown here are representative of two independent experiments. Statistical analysis was performed using one-way ANOVA with Tukey’s post-hoc test. Asterisks show the statistical significance between indicated groups: ns, not significant; *, P < 0.05; **, P < 0.01; ****, P < 0.0001.
Figure S5.
Figure S5.
Functions of HLA-E cytoplasmic tail on internalization and endosomal distribution. (A and B) Surface HLA molecules of THP1-differentiated macrophages were labeled, and then the cells were incubated in media containing primaquine. After different time points of internalization, samples were collected, and uninternalized surface antibody–HLA complexes were stripped off using citric acid. (A) The MFI of antibody-labeled cells without acid stripping was set to 100%, and the MFI of antibody-labeled cells with acid stripping but without internalization was set to 0%. The percentage of internalization was quantified by the normalization of MFI increase accordingly. (B) The percentage of HLA-E or HLA-Ia molecules internalized after 1 h. Data were collected for three biological runs and are shown as mean ± SD (error bars). Statistical analysis was performed using unpaired two-tailed Student’s t test with Welch’s correction. Asterisks show the statistical significance between indicated groups: *, P < 0.05. (C–F) Representative micrographs of HeLa cells stably expressing HLA-EA3 or HLA-A3E. After fixation and permeabilization, cells were stained with antibodies against protein markers for early endosome (EEA1; C), late endosome (Rab7; D), lysosome (LAMP1; E), and recycling endosome (Rab11; F), followed by detection with Alexa568-conjugated secondary antibody. Scale bars = 20 μm. Micrographs shown here are representative of two independent experiments.

References

    1. Antoniou, A.N., and Powis S.J.. 2008. Pathogen evasion strategies for the major histocompatibility complex class I assembly pathway. Immunology. 124:1–12. 10.1111/j.1365-2567.2008.02804.x - DOI - PMC - PubMed
    1. Barber, C., De Souza V.A., Paterson R.L., Martin-Urdiroz M., Mulakkal N.C., Srikannathasan V., Connolly M., Phillips G., Foong-Leong T., Pengelly R., et al. . 2022. Structure-guided stabilization of pathogen-derived peptide-HLA-E complexes using non-natural amino acids conserves native TCR recognition. Eur. J. Immunol. 52:618–632. 10.1002/eji.202149745 - DOI - PMC - PubMed
    1. Basha, G., Omilusik K., Chavez-Steenbock A., Reinicke A.T., Lack N., Choi K.B., and Jefferies W.A.. 2012. A CD74-dependent MHC class I endolysosomal cross-presentation pathway. Nat. Immunol. 13:237–245. 10.1038/ni.2225 - DOI - PMC - PubMed
    1. Boncompain, G., Divoux S., Gareil N., de Forges H., Lescure A., Latreche L., Mercanti V., Jollivet F., Raposo G., and Perez F.. 2012. Synchronization of secretory protein traffic in populations of cells. Nat. Methods. 9:493–498. 10.1038/nmeth.1928 - DOI - PubMed
    1. Borrego, F., Ulbrecht M., Weiss E.H., Coligan J.E., and Brooks A.G.. 1998. Recognition of human histocompatibility leukocyte antigen (HLA)-E complexed with HLA class I signal sequence-derived peptides by CD94/NKG2 confers protection from natural killer cell-mediated lysis. J. Exp. Med. 187:813–818. 10.1084/jem.187.5.813 - DOI - PMC - PubMed

Publication types

Substances