. 2023 Jul 3;222(7):e202207025.
doi: 10.1083/jcb.202207025. Epub 2023 May 4.

Recruitment of the SNX17-Retriever recycling pathway regulates synaptic function and plasticity

Affiliations

Recruitment of the SNX17-Retriever recycling pathway regulates synaptic function and plasticity

Pilar Rivero-Ríos et al. J Cell Biol. .

Abstract

Trafficking of cell-surface proteins from endosomes to the plasma membrane is a key mechanism to regulate synaptic function. In non-neuronal cells, proteins recycle to the plasma membrane either via the SNX27-Retromer-WASH pathway or via the recently discovered SNX17-Retriever-CCC-WASH pathway. While SNX27 is responsible for the recycling of key neuronal receptors, the roles of SNX17 in neurons are less understood. Here, using cultured hippocampal neurons, we demonstrate that the SNX17 pathway regulates synaptic function and plasticity. Disruption of this pathway results in a loss of excitatory synapses and prevents structural plasticity during chemical long-term potentiation (cLTP). cLTP drives SNX17 recruitment to synapses, where its roles are in part mediated by regulating the surface expression of β1-integrin. SNX17 recruitment relies on NMDAR activation, CaMKII signaling, and requires binding to the Retriever and PI(3)P. Together, these findings provide molecular insights into the regulation of SNX17 at synapses and define key roles for SNX17 in synaptic maintenance and in regulating enduring forms of synaptic plasticity.


Conflict of interest statement

Disclosures: The authors declare no competing interests exist.

Figures

Figure 1.
Figure 1.
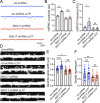
SNX17 is present in neurons and colocalizes with synaptic markers. (A) DIV19 rat hippocampal neurons were fixed and stained for SNX17 and the neuronal dendrite marker MAP2. Lower panels show straightened dendrites from the corresponding top panels. Scale bars, 2 μm. (B) DIV19 rat hippocampal neurons were triple labeled with antibodies for the postsynaptic marker PSD95, the synaptic vesicle glutamate transporter vGLUT1, and either SNX17, VPS35L, or COMMD1. Arrows indicate examples of colocalization of active excitatory synapses (labeled with both PSD95 and vGLUT1) with SNX17, VPS35L, or COMMD1. Scale bar, 2 μm. (C) The percentage of active excitatory synapses, labeled simultaneously with PSD95 and vGLUT1, that colocalize with the indicated proteins was determined using Mander’s colocalization coefficient (×100). SNX17: 44.600 ± 0.892, N = 45 neurons; VPS35L: 61.610 ± 1.674, N = 42 neurons; COMMD1: 61.980 ± 1.540, N = 46 neurons. Three independent experiments. Error bars are SEM. (D) The percentage of PSD95-labeled postsynaptic sites that colocalize with SNX17 was determined using Mander’s colocalization coefficient (×100). SNX17: 52.420 ± 1.336, N = 45 neurons; VPS35L: 70.590 ± 1.816, N = 42 neurons; COMMD1: 67.460 ± 1.690, N = 46 neurons. Three independent experiments. Error bars are SEM. (E) The percentage of vGLUT1-labeled presynaptic sites that colocalizes with SNX17 was determined using Mander’s colocalization coefficient (×100). SNX17: 54.600 ± 1.441, N = 45 neurons; VPS35L: 76.150 ± 0.989, N = 42 neurons; COMMD1: 72.150 ± 1.189, N = 46 neurons. Three independent experiments. Error bars are SEM.
Figure S1.
Figure S1.
Validation of SNX17-shRNA, and effect of SNX17 knockdown in the initiation and maintenance of cLTP. (A) Representative confocal images of DIV16 rat hippocampal neurons transfected at DIV12 with eGFP (filler) and either scrambled non-target shRNA SHC002 (Millipore Sigma) or SNX17-shRNA (TRCN0000190340, Millipore Sigma). Neurons were fixed, permeabilized, and incubated with an anti-SNX17 antibody. (B) Identification of two independent shRNA clones (clone 1: TRCN0000190340 and clone 2: TRCN0000382281) to knockdown rat SNX17. The shRNA clones were used to generate lentiviruses and infect Rat2 cells. 5 d postinfection, cell lysates were analyzed by Western blot. pLKO.1 scrambled non-target shRNA SHC002 (Millipore Sigma) was used as a control for SNX17 levels. GAPDH was used as a loading control. (C) Rat cortical neurons were infected with either SNX17-shRNA (clone 1) or control-shRNA at an MOI of 2. 6 d postinfection, cell extracts were collected and analyzed by Western blot. GAPDH was used as a loading control. (D) The levels of SNX17 protein were quantified in neurons infected with SNX17-shRNA (clone 1) and normalized to SNX17 levels in control-shRNA-infected neurons. ctrl-shRNA: 100%; SNX17-shRNA: 11.420 ± 0.852%. N = 3 independent experiments. Statistical significance was determined using unpaired two-tailed Student’s t test, ****P < 0.001. Error bars are SEM. (E) HEK293 cells stably expressing the tet repressor (HEK293-TR) were either transfected with control-shRNA or SNX17-shRNA in the absence or presence of eGFP, GFP-SNX17, or shRNA-resistant GFP-SNX17 (SNX17-R), as indicated. 5-d postinfection, cells were treated with 1 μg/ml of doxycycline to promote the expression of eGFP, GFP-SNX17, or GFP-SNX17-R. 24 h later, extracts were collected and analyzed by Western blot. (F) DIV16-18 rat hippocampal neuron cultures transfected at DIV12 with a scrambled control shRNA (ctrl-shRNA) or SNX17-shRNA, and either treated with cLTP or left untreated (baseline). mEPSCs were recorded during the first 30 min after cLTP (cLTP < 30) or from 30 to 90 min after cLTP (cLTP > 30), and mEPSC amplitude was quantified. ctrl-shRNA baseline: 11.890 ± 0.413, N = 11 neurons; ctrl-shRNA cLTP < 30 min: 17.370 ± 1.655, N = 9 neurons; ctrl-shRNA cLTP > 30 min: 15.730 ± 1.004, N = 9 neurons; SNX17-shRNA baseline: 11.930 ± 0.488, N = 21 neurons; SNX17-shRNA cLTP < 30 min: 12.650 ± 0.555, N = 13 neurons; SNX17-shRNA cLTP > 30 min: 13.160 ± 0.497, N = 12 neurons. Three independent experiments. Data were analyzed by one-way ANOVA with Tukey’s post hoc test, **P < 0.01, ****P < 0.001. Error bars are SEM. (G) Same as F, but mEPSC frequency was quantified. ctrl-shRNA baseline: 0.888 ± 0.127, N = 11 neurons; ctrl-shRNA cLTP < 30 min: 2.729 ± 0.844, N = 9 neurons, ctrl-shRNA cLTP > 30 min: 2.051 ± 0.754, N = 9 neurons, SNX17-shRNA baseline: 0.719 ± 0.116, N = 21 neurons, SNX17-shRNA cLTP < 30 min: 0.927 ± 0.114, N = 13 neurons; SNX17-shRNA cLTP > 30 min: 1.583 ± 0.327, N = 12 neurons. Three independent experiments. Data were analyzed by one-way ANOVA with Tukey’s post hoc test, *P < 0.05, ****P < 0.001. Error bars are SEM. Source data are available for this figure: SourceData FS1.
Figure 2.
Figure 2.
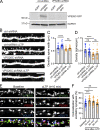
The SNX17 pathway regulates synaptic function by promoting dendritic spine maintenance. (A) Representative mEPSC recordings from DIV16-18 rat hippocampal neuron cultures transfected at DIV12 with a scrambled control shRNA (ctrl-shRNA) or SNX17-shRNA clones, C1, or C2. (B) SNX17 knockdown with either shRNA clone did not significantly alter basal mEPSC amplitudes (one-way ANOVA). ctrl-shRNA: 14.910 ± 0.468, N = 8 neurons; SNX17-shRNA C1: 13.600 ± 0.570, N = 8 neurons; SNX17-shRNA C2: 14.630 ± 0.788, N = 8 neurons. Three independent experiments. Error bars are SEM. (C) SNX17 knockdown significantly decreased mEPSC frequency. ctrl-shRNA: 1.621 ± 0.398, N = 8 neurons; SNX17-shRNA C1: 0.794 ± 0.109, N = 8 neurons; SNX17-shRNA C2: 0.820 ± 0.073, N = 8 neurons. Data were analyzed by one-way ANOVA with uncorrected Fisher’s LSD post hoc test, *P < 0.05. Error bars are SEM. (D) Representative confocal images of dendritic spines in DIV16 hippocampal neurons cotransfected at DIV12 with eGFP (filler) and either ctrl-shRNA or SNX17-shRNA (C1). Scale bar, 5 µm. (E) Bar chart showing spine density (spines/μm). The number of dendritic spines in the first 50 μm of secondary dendrites was quantified. ctrl-shRNA: 0.483 ± 0.037, N = 38 neurons; SNX17-shRNA: 0.302 ± 0.025, N = 45 neurons. Three independent experiments. Statistical significance was determined using unpaired two-tailed Student’s t test, ****P < 0.001. Error bars are SEM. (F) Bar chart showing spine density (spines/μm). DIV16 hippocampal neurons were cotransfected at DIV12 with mCherry (filler) and the indicated constructs. The numbers of dendritic spines in the first 50 µm of secondary dendrites were quantified. ctrl-shRNA + eGFP: 0.413 ± 0.021, N = 36 neurons; ctrl-shRNA + SNX17-R: 0.423 ± 0.018, N = 34 neurons; SNX17-shRNA + eGFP: 0.310 ± 0.016, N = 30 neurons; SNX17-shRNA + SNX17-R: 0.467 ± 0.027, N = 35 neurons. Statistical significance was determined using one-way ANOVA with Tukey’s post hoc test, **P < 0.01, ****P < 0.001. Error bars are SEM. (G) Hippocampal neurons were cotransfected at DIV12 with eGFP and either ctrl-shRNA or VPS26C-shRNA, fixed 4 d posttransfection, and the numbers of dendritic spines were quantified. ctrl-shRNA: 0.544 ± 0.032, N = 30 neurons; VPS26C-shRNA: 0.334 ± 0.021, N = 31 neurons. Three independent experiments. Statistical significance was determined using unpaired two-tailed Student’s t test, ****P < 0.001. Error bars are SEM. (H) Descriptive graphic with the percentage of each spine type in ctrl-shRNA or SNX17-shRNA- transfected neurons. The dendritic spines in the first 30 μm of secondary dendrites were classified. ctrl-shRNA: N = 30 neurons, SNX17-shRNA: N = 30 neurons. Three independent experiments.
Figure 3.
Figure 3.
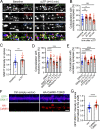
SNX17 is required for functional and structural plasticity during cLTP. (A) Example traces for DIV16-18 rat hippocampal neuron cultures transfected at DIV12 with a scrambled control shRNA (ctrl-shRNA) or SNX17-shRNA, and either treated with cLTP or left untreated. (B) Induction of cLTP increased the amplitude of mEPSCs in neurons transfected with ctrl-shRNA but not SNX17-shRNA. ctrl-shRNA: 14.190 ± 0.426, N = 6 neurons; ctrl-shRNA with cLTP: 18.610 ± 0.638, N = 5 neurons; SNX17-shRNA: 11.820 ± 0.505, N = 6 neurons; SNX17-shRNA with cLTP: 12.580 ± 0.881, N = 7 neurons. Three independent experiments. Data were analyzed by one-way ANOVA with uncorrected Fisher’s LSD post hoc test, **P < 0.01. Error bars are SEM. (C) Induction of cLTP increased the frequency of mEPSCs in neurons transfected with ctrl-shRNA but not SNX17-shRNA. ctrl-shRNA: 1.069 ± 0.182, N = 6 neurons; ctrl-shRNA with cLTP: 2.751 ± 1.116, N = 5 neurons; SNX17-shRNA: 0.705 ± 0.200, N = 6 neurons; SNX17-shRNA with cLTP: 0.726 ± 0.162, N = 7 neurons. Three independent experiments. Data were analyzed by one-way ANOVA with uncorrected Fisher’s LSD post hoc test, *P < 0.05. Error bars are SEM. (D) Representative confocal images of dendritic spines in DIV16 hippocampal neurons cotransfected at DIV12 with eGFP (filler) and either ctrl-shRNA or SNX17-shRNA. Neurons were either treated with cLTP or left untreated and fixed 50 min after cLTP. Scale bar, 5 µm. (E) The maximum width for each spine was quantified and the average size of the dendritic spines in the first 30 μm of secondary dendrites was calculated. ctrl-shRNA: 0.625 ± 0.013, N = 41 neurons; ctrl-shRNA with cLTP: 0.732 ± 0.016, N = 41 neurons; SNX17-shRNA: 0.568 ± 0.016, N = 41 neurons; SNX17-shRNA with cLTP: 0.559 ± 0.011, N = 38 neurons. Three independent experiments. Data were analyzed by one-way ANOVA with Tukey’s post hoc test, *P < 0.05, ****P < 0.001. Error bars are SEM. (F) Quantification of spine density (spines/μm). ctrl-shRNA: 0.900 ± 0.058, N = 41 neurons; ctrl-shRNA with cLTP: 0.961 ± 0.054, N = 41 neurons; SNX17-shRNA: 0.647 ± 0.042, N = 41 neurons; SNX17-shRNA with cLTP: 0.677 ± 0.038, N = 38 neurons. Three independent experiments. Data were analyzed by one-way ANOVA with Tukey’s post hoc test, **P < 0.01. Error bars are SEM.
Figure S2.
Figure S2.
The Retriever complex is necessary for the cLTP-dependent increase in dendritic spine width and is dynamically recruited to dendritic spines upon cLTP. (A) Validation of VPS26C-shRNA by Western blotting. HEK293 cells stably expressing the tet repressor (HEK293-TR) were either transfected with control-shRNA (RHS4346, Horizon Discovery) or VPS26C-shRNA (V3LMM_455807, Horizon Discovery) in the absence or presence of eGFP or VPS26C-GFP, as indicated. 5-d postinfection, cells were treated with 1 μg/ml of doxycycline to promote the expression of eGFP or VPS26C-GFP. 24 h later, extracts were collected and analyzed by Western blot. (B) Representative confocal images of dendritic spines in DIV16 hippocampal neurons cotransfected at DIV12 with eGFP (filler) and either ctrl-shRNA or VPS26C-shRNA. Neurons were either treated with cLTP or left untreated and fixed 50 min after cLTP. Scale bar, 5 µm. (C) The maximum width for each spine was quantified and the average size of the dendritic spines in the first 50 μm of secondary dendrites was calculated. ctrl-shRNA: 0.656 ± 0.015, N = 34 neurons; ctrl-shRNA with cLTP: 0.733 ± 0.019, N = 42 neurons; VPS26C-shRNA: 0.581 ± 0.011, N = 34 neurons; VPS26C-shRNA with cLTP: 0.626 ± 0.015, N = 34 neurons. Three independent experiments. Data were analyzed by one-way ANOVA with Tukey’s post hoc test, ****P < 0.001. Error bars are SEM. (D) Quantification of spine density (spines/μm). ctrl-shRNA: 0.600 ± 0.034, N = 34 neurons; ctrl-shRNA with cLTP: 0.458 ± 0.022, N = 42 neurons; VPS26C-shRNA: 0.349 ± 0.025, N = 34 neurons; VPS26C-shRNA with cLTP: 0.401 ± 0.030, N = 34 neurons. Three independent experiments. Data were analyzed by one-way ANOVA with Tukey’s post hoc test, ****P < 0.001. Error bars are SEM. (E) Representative confocal images showing the colocalization of VPS35L with excitatory synapses before and 10 min after cLTP treatment. DIV19 rat hippocampal neuron cultures were untreated or treated with cLTP for 5 min (Mg2+−free HBS with: 400 μM glycine, 20 μM bicuculline, and 3 μM strychnine). Cells were fixed after cLTP at 10, 30, or 60 min, permeabilized and incubated with antibodies against VPS35L, PSD95 and vGLUT1. Arrows indicate example of colocalization. Scale bar, 2 µm. (F) The percentage of excitatory synapses that colocalize with VPS35L at the different time points was determined using Mander’s colocalization coefficient (×100). Baseline: 58.330 ± 1.725, N = 45; 10 min after cLTP: 69.380 ± 1.917, N = 45; 30 min after cLTP: 65.730 ± 1.898, N = 44; 60 min after cLTP: 56.380 ± 2.228, N = 45. Three independent experiments. Data were analyzed by one-way ANOVA with Tukey’s post hoc test, *P < 0.05, ***P < 0.005. Error bars are SEM. Source data are available for this figure: SourceData FS2.
Figure 4.
Figure 4.
SNX17 is dynamically recruited to synapses during cLTP, which is dependent on the NMDAR-Calcium-CaMKII pathway. (A) Representative confocal images showing the colocalization of SNX17 with excitatory synapses before and 10 min after cLTP treatment. DIV19 rat hippocampal neuron cultures were untreated or treated with cLTP for 5 min (Mg2+−free HBS with: 400 μM glycine, 20 μM bicuculline, and 3 μM strychnine). Cells were fixed after cLTP at 10, 30, or 60 min, permeabilized, and incubated with antibodies against SNX17, PSD95, and vGLUT1. Arrows indicate an example of colocalization. Scale bar, 2 µm. (B) The percentage of excitatory synapses that colocalize with SNX17 at the different time points was determined using Mander’s colocalization coefficient (×100). Baseline: 43.310 ± 1.881, N = 43; 10 min after cLTP: 51.750 ± 1.520, N = 42; 30 min after cLTP: 49.930 ± 1.533, N = 43; 60 min after cLTP: 39.680 ± 1.625, N = 43. Three independent experiments. Data were analyzed by one-way ANOVA with Tukey’s post hoc test, *P < 0.05, **P < 0.01. Error bars are SEM. (C) Hippocampal neurons were transfected at DIV12 with eGFP and 4 d posttransfection either treated with cLTP for 5 min or left untreated. Cells were washed and further incubated with HBS for 10 min, followed by fixation and immunocytochemistry with an anti-SNX17 antibody. The mean intensity of SNX17 in the spines present in the first 30 µm of secondary dendrites was quantified and normalized to SNX17 mean intensity in the dendritic shaft. Baseline: 0.505 ± 0.022, N = 41 neurons; cLTP: 0.602 ± 0.024, N = 39 neurons. Statistical significance was determined using unpaired two-tailed Student’s t test, **P < 0.01. Error bars are SEM. (D) DIV19 rat hippocampal neuron cultures were treated with DMSO, 10 μM BAPTA-AM, 100 μM D-APV, or 10 μM nifedipine for 30 min, followed by a 5-min cLTP stimulus in the presence of compounds where indicated. Neurons were further incubated in the presence of the indicated compounds for 10 min before fixation, followed by permeabilization and incubation with antibodies against SNX17, PSD95, and vGLUT1. The percentage of excitatory synapses that colocalize with SNX17 at the different time points was determined using Mander’s colocalization coefficient (×100). DMSO: 41.380 ± 2.328, N = 28 neurons; DMSO + cLTP: 58.550 ± 2.538, N = 30 neurons; BAPTA-AM + cLTP: 44.710 ± 2.597, N = 29 neurons; D-APV + cLTP: 42.370 ± 2.631, N = 30 neurons; nifedipine + cLTP: 56.190 ± 2.150, N = 31 neurons. Three independent experiments. Data were analyzed by one-way ANOVA with Tukey’s post hoc test, ***P < 0.005, ****P < 0.001. Error bars are SEM. (E) DIV19 rat hippocampal neurons were treated with DMSO, 10 μM AIP, 2 μM KT5720, or 10 μM U0126 for 30 min, followed by a 5-min cLTP stimulus in the presence of compounds where indicated. Neurons were further incubated in the presence of the indicated compounds for 10 min before fixation, followed by permeabilization and incubation with antibodies against SNX17, PSD95, and vGLUT1. The percentage of excitatory synapses that colocalize with SNX17 at the different time points was determined using Mander’s colocalization coefficient (×100). DMSO: 44.250 ± 1.951, N = 30 neurons; DMSO + cLTP: 59.220 ± 1.124, N = 30 neurons; AIP + cLTP: 41.090 ± 1.002, N = 31 neurons; KT5720 + cLTP: 57.400 ± 1.654, N = 31 neurons; U0126 + cLTP: 55.590 ± 2.015, N = 30 neurons. Three independent experiments. Data were analyzed by one-way ANOVA with Tukey’s post hoc test, ***P < 0.005, ****P < 0.001. Error bars are SEM. (F) Representative confocal images of DIV17 hippocampal neurons co-transfected at DIV16 with GFP-SNX17 and either an empty pRK5 vector or pRK5-HA-CaMKII-T286D. Neurons were fixed, permeabilized, and incubated with an anti-HA antibody. GFP-SNX17 intensity presented in the “fire” LUT color scheme. Scale bar, 2 µm. (G) The mean intensity of GFP-SNX17 was measured in the dendritic spines present in the first 30 μm of secondary dendrites and normalized to GFP-SNX17 mean intensity in the dendritic shaft. Ctrl: 0.525 ± 0.014, N = 45 neurons; CaMKII-T286D: 0.633 ± 0.014, N = 45 neurons. Statistical significance was determined using unpaired two-tailed Student’s t test, ****P < 0.001. Error bars are SEM.
Figure S3.
Figure S3.
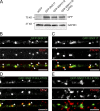
Validation of GFP-SNX17 and GFP-SNX17-L470G constructs. (A) HEK293T cells were transfected with eGFP, GFP-SNX17, GFP-SNX17-R, or GFP-SNX17-R-L470G. 48 h later, extracts were collected and analyzed by Western blot with an anti-GFP antibody. GAPDH was used as a loading control. (B) Rat hippocampal neurons were transfected at DIV16 with GFP-SNX17, fixed 24 h later, and stained for EEA1. EEA1 was labeled with Alexa Fluor-405 and pseudocolored in red to facilitate visualization. Arrows: examples of colocalization. Scale bar, 5 µm. (C) Rat hippocampal neurons were transfected at DIV16 with GFP-SNX17, fixed 24 h later, and stained for PSD95. PSD95 was labeled with Alexa Fluor-405 and pseudocolored in red to facilitate visualization. Arrows indicate examples of colocalization. Scale bar, 5 µm. (D) Rat hippocampal neurons were transfected at DIV16 with GFP-SNX17-R-L470G, fixed 24 h later, and stained for EEA1. EEA1 was labeled with Alexa Fluor-405 and pseudocolored in red to facilitate visualization. Arrows: Examples of colocalization. Scale bar, 5 µm. (E) Rat hippocampal neurons were transfected at DIV16 with GFP-SNX17, fixed 24 h later, and stained for PSD95. PSD95 was labeled with Alexa Fluor-405 and pseudocolored in red to facilitate visualization. Arrows indicate examples of colocalization. Scale bar, 5 µm. Source data are available for this figure: SourceData FS3.
Figure 5.
Figure 5.
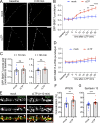
The cLTP-dependent recruitment of SNX17 to dendritic spines correlates with increased dendritic spine width. (A) Example confocal images taken from DIV17 neurons expressing GFP-SNX17 and mCherry (filler) under conditions of cLTP or HBS control (mock). Images of live neurons in an environmental chamber were captured before cLTP (baseline), during cLTP, and at 0, 5, 10, 15, 20, 25, and 30 min after the cLTP stimulus. Representative images of baseline, t = 10, and t = 30 are shown. Intensity presented in the “fire” LUT color scheme. Scale bar, 1 µm. (B) The endpoint of the experiment (30 min) was used to measure the cLTP-dependent increase in spine width. Spine width was normalized to the baseline size for each spine. Mock: 1.038 ± 0.014, N = 95 spines across 12 cells; cLTP: 1.432 ± 0.044, N = 106 spines across 12 cells. Statistical significance was determined using unpaired two-tailed Student’s t test, ****P < 0.001. Error bars are SEM. (C) The mean intensity of GFP-SNX17 was measured in the spines that remained in the same plane at each time point following cLTP (or mock) and normalized to the baseline for each individual spine. Mock: N = 95 spines across 12 cells (baseline: 1.000, cLTP: 1.011 ± 0.008, 0: 0.999 ± 0.011, 5: 1.014 ± 0.014, 10: 1.020 ± 0.017, 15: 1.025 ± 0.017, 20: 1.005 ± 0.017, 25: 1.004 ± 0.019, 30: 1.001 ± 0.021); cLTP: N = 106 spines across 12 cells (baseline: 1.000, cLTP: 0.966 ± 0.035, 0: 1.064 ± 0.038, 5: 1.163 ± 0.045, 10: 1.316 ± 0.049, 15: 1.304 ± 0.061, 20: 1.239 ± 0.061, 25: 1.274 ± 0.063, 30: 1.237 ± 0.052). Statistical significance was determined using two-way ANOVA with Sidak's multiple comparison test, **P < 0.01, ***P < 0.005, ****P < 0.001. Error bars are SEM. (D) Scatter plot of individual changes in spine width at the endpoint of the experiment vs changes in GFP-SNX17 intensity at 10 min. Mock: N = 95 spines across 12 cells, cLTP: N = 106 spines across 12 cells. A linear regression model was fit to the cLTP (R squared = 0.3483, P < 0.0001) and mock (R squared = 0.0573, P = 0.0195) conditions.
Figure 6.
Figure 6.
Retriever binding is necessary for the cLTP-dependent recruitment of SNX17 to dendritic spines as well as the SNX17-mediated increase in dendritic spine width following cLTP. (A) Example confocal images taken from DIV17 neurons expressing GFP-SNX17-R-L470G and mCherry (filler) under conditions of cLTP or HBS control (mock). Images of live neurons in an environmental chamber were captured before cLTP (baseline), during cLTP, and at 0, 5, 10, 15, 20, 25, and 30 min after the cLTP stimulus. Representative images of baseline, t = 10, and t = 30 are shown. Intensity presented in the “fire” LUT color scheme. Scale bar, 1 µm. (B) The endpoint of the experiment (30 min) was used to measure the cLTP-dependent increase in spine width. Spine width was normalized to the baseline size for each spine. Mock: 1.081 ± 0.020, N = 95 spines across 12 cells; cLTP: 1.318 ± 0.039, N = 146 spines across 12 cells. Statistical significance was determined using unpaired two-tailed Student’s t test, ****P < 0.001. Error bars are SEM. (C) The mean intensity of GFP-SNX17-R-L470G was measured in the spines that remained in the same plane at each time point following cLTP (or mock) and normalized to the baseline for each individual spine. Mock: N = 95 spines across 12 cells (baseline: 1.000, cLTP: 0.997 ± 0.006, 0: 0.988 ± 0.009, 5: 0.994 ± 0.011, 10: 0.984 ± 0.010, 15: 0.982 ± 0.010, 20: 0.995 ± 0.012, 25: 0.991 ± 0.012, 30: 1.003 ± 0.012); cLTP: N = 146 spines across 12 cells (baseline: 1.000, cLTP: 0.980 ± 0.020, 0: 1.022 ± 0.025, 5: 1.086 ± 0.030, 10: 0.999 ± 0.027, 15: 1.067 ± 0.029, 20: 1.086 ± 0.030, 25: 1.059 ± 0.033, 30: 1.059 ± 0.032). Two-way ANOVA with Sidak’s multiple comparison test determined that there are no significant differences between the mock and cLTP conditions. Error bars are SEM. (D) DIV16 hippocampal neurons were co-transfected at DIV12 with mCherry (filler) and the indicated constructs. Neurons were either treated with cLTP or left untreated, and fixed 50 min after cLTP. The maximum width for each spine was quantified, and the average size of the dendritic spines in the first 30 μm of secondary dendrites was calculated. ctrl-shRNA + GFP: 0.350 ± 0.008, N = 28 neurons; ctrl-shRNA + GFP + cLTP 0.482 ± 0.014, N = 28 neurons; SNX17-shRNA + GFP: 0.353 ± 0.011, N = 27 neurons; SNX17-shRNA + GFP + cLTP: 0.338 ± 0.010, N = 28 neurons; SNX17-shRNA + 17R: 0.352 ± 0.009, N = 28 neurons; SNX17-shRNA + 17R + cLTP: 0.468 ± 0.012, N = 28 neurons; SNX17-shRNA + 17 R-L470G: 0.348 ± 0.007, N = 27 neurons; SNX17-shRNA + 17 R-L470G + cLTP: 0.359 ± 0.007, N = 28 neurons. Three independent experiments. Data were analyzed by one-way ANOVA with Tukey’s post hoc test, ****P < 0.001. Error bars are SEM.
Figure 7.
Figure 7.
cLTP promotes extrasynaptic changes in the formation of SNX17-positive puncta, which may correspond to endosomal compartments that are active in recycling. (A) Example confocal images of secondary dendrites from DIV17 neurons expressing GFP-SNX17 and mCherry (filler) under conditions of cLTP or HBS control (mock). Images of live neurons in an environmental chamber were captured before cLTP (baseline), during cLTP, and at 0, 5, 10, 15, 20, 25, and 30 min after the cLTP stimulus. Representative images of baseline and t = 30 are shown. Scale bar, 5 µm. (B) The number of GFP-SNX17-positive puncta in 30 µm of dendritic spines at the different time points following cLTP (or mock) was quantified and normalized to the baseline for each dendrite. Mock: N = 12 dendrites (baseline: 0.219 ± 0.026, cLTP: 0.225 ± 0.029, 0: 0.222 ± 0.028, 5: 0.242 ± 0.023, 10: 0.250 ± 0.026, 15: 0.261 ± 0.031, 20: 0.267 ± 0.025, 25: 0.272 ± 0.027, 30: 0.281 ± 0.028); cLTP: N = 12 dendrites (baseline: 0.231 ± 0.018, cLTP: 0.208 ± 0.021, 0: 0.219 ± 0.019, 5: 0.297 ± 0.019, 10: 0.350 ± 0.015, 15: 0.372 ± 0.019, 20: 0.397 ± 0.027, 25: 0.428 ± 0.024, 30: 0.453 ± 0.027). Three independent experiments. Statistical significance was determined using two-way ANOVA with Sidak's multiple comparison test, *P < 0.05, **P < 0.01, ****P < 0.001. Error bars are SEM. (C) The size of GFP-SNX17-positive puncta in 30 µm of dendritic spines at 10 and 30 min following cLTP (or mock) was quantified and normalized to the baseline for each dendrite. Mock: N = 12 dendrites (10: 1.063 ± 0.079, 30: 1.087 ± 0.065); cLTP: N = 12 dendrites (10: 1.132 ± 0.062, 30: 1.178 ± 0.079). Three independent experiments. Data were analyzed using unpaired two-tailed Student’s t test. Error bars are SEM. (D) The number of puncta containing GFP-SNX17-R-L470G in 30 µm of dendritic spines at the different time points following cLTP (or mock) was quantified and normalized to the baseline for each dendrite. Mock: N = 12 dendrites (baseline: 0.206 ± 0.023, cLTP: 0.206 ± 0.022, 0: 0.208 ± 0.023, 5: 0.217 ± 0.023, 10: 0.225 ± 0.026, 15: 0.231 ± 0.028, 20: 0.242 ± 0.029, 25: 0.244 ± 0.031, 30: 0.253 ± 0.032); cLTP: N = 12 dendrites (baseline: 0.231 ± 0.027, cLTP: 0.217 ± 0.024, 0: 0.228 ± 0.023, 5: 0.239 ± 0.025, 10: 0.250 ± 0.023, 15: 0.264 ± 0.025, 20: 0.283 ± 0.029, 25: 0.292 ± 0.027, 30: 0.303 ± 0.027). Three independent experiments. Two-way ANOVA with Sidak's multiple comparison test determined that there are no significant differences between the mock and cLTP conditions. Error bars are SEM. (E) DIV17 hippocampal neurons were treated with cLTP or HBS control (mock), washed, and incubated in HBS for 10 min following the cLTP (or mock) stimulus. Neurons were then fixed and stained for SNX17 and the Retromer marker VPS35. Arrows indicate examples of colocalization. Scale bar, 5 µm. (F) The percentage of VPS35 that colocalizes with SNX17 was quantified using Mander’s colocalization coefficient (×100). Mock-treated neurons: 55.790 ± 2.318, N = 27; cLTP-treated neurons: 67.650 ± 2.688, N = 30. Three independent experiments. Data were analyzed by unpaired two-tailed Student’s t test, **P < 0.01. Error bars are SEM. (G) The percentage of Syntaxin 13 that colocalizes with SNX17 was quantified using Mander’s colocalization coefficient (×100). Mock-treated neurons: 50.500 ± 1.651, N = 26; cLTP-treated neurons: 59.450 ± 1.679, N = 26. Three independent experiments. Data were analyzed by unpaired two-tailed Student’s t test, ***P < 0.005. Error bars are SEM.
Figure S4.
Figure S4.
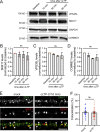
Quantification of the total levels of proteins of the SNX17-Retriever pathway upon cLTP and colocalization of SNX17 with EEA1 in the presence or absence of cLTP. (A) DIV17 rat cortical neurons were either left untreated (baseline) or treated with cLTP for 5 min. Extracts were generated at 10, 30, or 60 min after cLTP and analyzed by Western blot for the levels of VPS35L, SNX17, COMMD1, and GAPDH as a loading control. (B) The levels of SNX17 at 10, 30, or 60 min after cLTP were quantified and normalized to the baseline protein levels. Baseline: 1.000; 10 min: 0.955 ± 0.088; 30 min: 0.947 ± 0.144; 60 min: 0.885 ± 0.159. N = 3 independent experiments. Data were analyzed by one-way ANOVA. Error bars are SEM. (C) The levels of VPS35L at 10, 30, or 60 min after cLTP were quantified and normalized to the baseline protein levels. Baseline: 1.000; 10 min: 0.939 ± 0.017; 30 min: 0.868 ± 0.014; 60 min: 0.879 ± 0.132. N = 3 independent experiments. Data were analyzed by one-way ANOVA. Error bars are SEM. (D) The levels of COMMD1 at 10, 30, or 60 min after cLTP were quantified and normalized to the baseline protein levels. Baseline: 1.000; 10 min: 0.896 ± 0.071; 30 min: 0.747 ± 0.015; 60 min: 0.803 ± 0.123. N = 3 independent experiments. Data were analyzed by one-way ANOVA. Error bars are SEM. (E) DIV17 hippocampal neurons were treated with cLTP or HBS control (mock), washed, and incubated in HBS for 10 min following the cLTP (or mock) stimulus. Neurons were then fixed and stained for SNX17 and the early endosomal marker EEA1. Arrows indicate examples of colocalization. Scale bar, 5 µm. (F) The percentage of EEA1 that colocalizes with SNX17 was quantified using Mander’s colocalization coefficient (×100). Mock-treated neurons: 42.850 ± 2.723, N = 28; cLTP-treated neurons: 40.730 ± 2.789, N = 30. Three independent experiments. Data were analyzed by unpaired two-tailed Student’s t test. Error bars are SEM. Source data are available for this figure: SourceData FS4.
Figure S5.
Figure S5.
Increased PI(3)P synthesis upon cLTP regulates SNX17 recruitment to dendritic spines as well as the formation of extrasynaptic SNX17-positive puncta. (A) Rat hippocampal neurons were transfected at DIV16 with dsRed-EEA1-FYVE. 24 h later, neurons were either left untreated (baseline) or treated with cLTP for 5 min and fixed at the indicated time points after the cLTP stimulus. Baseline: 0.196 ± 0.022, N = 31 neurons; during cLTP: 0.250 ± 0.021, N = 30 neurons; 0 min after cLTP: 0.328 ± 0.029, N = 30 neurons; 5 min after cLTP: 0.319 ± 0.021, N = 30 neurons; 10 min after cLTP: 0.340 ± 0.023, N = 30 neurons; 15 min after cLTP: 0.399 ± 0.028, N = 30 neurons; 30 min after cLTP: 0.394 ± 0.025, N = 30 neurons. Three independent experiments. Data were analyzed by one-way ANOVA with Tukey’s post hoc test, **P < 0.01, ****P < 0.001. Error bars are SEM. (B) Representative confocal images of DIV17 hippocampal neurons that were transfected at DIV16 with GFP-SNX17 and dsRed-EEA1-FYVE. 24 h later, neurons were treated with either DMSO or 1 μM VPS34-INH for 15 min. Neurons were either fixed in the absence of cLTP (baseline) or treated with cLTP for 5 min and fixed 10 or 30 min after the cLTP stimulus. DMSO or VPS34-INH were maintained during the course of the experiment. Images are shown for the baseline and 10 min after cLTP time points in the presence or absence of VPS34-INH. Scale bar, 2 µm. (C) The number of dsRed-EEA1-FYVE-positive puncta in the first 30 μm of secondary dendrites was quantified at the indicated time points. Baseline DMSO: 0.212 ± 0.016, N = 27 neurons; cLTP 10 min DMSO: 0.404 ± 0.024, N = 27 neurons; cLTP 30 min DMSO: 0.448 ± 0.021, N = 28 neurons; baseline VPS34-INH: 0.079 ± 0.008, N = 26 neurons; cLTP 10 min VPS34-INH: 0.081 ± 0.011, N = 26 neurons; cLTP 30 min VPS34-INH: 0.145 ± 0.010, N = 31 neurons. Three independent experiments. Statistical significance was determined using one-way ANOVA with Tukey’s post hoc test, *P < 0.05, ****P < 0.001. Error bars are SEM. (D) The number of GFP-SNX17 puncta in the first 30 μm of secondary dendrites was quantified at the indicated time points. Baseline DMSO: 0.151 ± 0.012, N = 27 neurons; cLTP 10 min DMSO: 0.259 ± 0.012, N = 27 neurons; cLTP 30 min DMSO: 0.335 ± 0.019, N = 28 neurons; baseline VPS34-INH: 0.032 ± 0.005, N = 26 neurons; cLTP 10 min VPS34-INH: 0.045 ± 0.007, N = 26 neurons; cLTP 30 min VPS34-INH: 0.097 ± 0.008, N = 31 neurons. Three independent experiments. Statistical significance was determined using one-way ANOVA with Tukey’s post hoc test, **P < 0.01, ****P < 0.001. Error bars are SEM. (E) The colocalization between dsRed-EEA1-FYVE- and GFP-SNX17-positive puncta, in the absence of VPS34-INH, was analyzed using Mander’s colocalization coefficient (×100). Baseline: 63.430 ± 3.248%, N = 27 neurons; cLTP 10 min: 68.850 ± 3.258%, N = 27 neurons, cLTP 30 min: 70.260 ± 3.060%, N = 28 neurons. Data were analyzed using one-way ANOVA with Tukey’s post hoc test. Error bars are SEM.
Figure 8.
Figure 8.
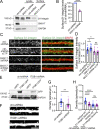
β1-integrin is an SNX17 cargo in neurons and plays a role in dendritic spine density. (A) DIV11 rat cortical neurons were infected with lentiviruses carrying scrambled or SNX17 shRNAs, and the surface levels of β1-integrin were determined at DIV17 using a surface biotinylation assay. SNX17 knockdown was validated by Western blot of the lysate and GAPDH was used as a loading control. (B) The levels of surface β1-integrin protein were quantified and normalized to total β1-integrin levels (lysate). Data are expressed as a percentage of ctrl-shRNA (ctrl-shRNA: 100%, SNX17-shRNA: 57.630 ± 3.058%). N = 4 independent experiments. Statistical significance was determined using unpaired two-tailed Student’s t test, ****P < 0.001. Error bars are SEM. (C) Representative confocal images of surface β1-integrin levels of DIV17 hippocampal neurons that were infected at DIV11 with lentiviruses carrying either ctrl-shRNA or SNX17-shRNA. Neurons were treated in the presence or absence of cLTP and live labeled with an anti-surface ß1-integrin antibody for 15 min, followed by fixation and immunostaining for MAP2. Scale bar, 5 µm. (D) The intensity of ß1-integrin in the first 50 µm of secondary dendrites was quantified and values were normalized to crtl-shRNA. ctrl-shRNA: 1.000 ± 0.038, N = 32 neurons; ctrl-shRNA cLTP: 1.139 ± 0.039, N = 29 neurons; SNX17-shRNA: 0.839 ± 0.040, N = 28 neurons; SNX17-shRNA cLTP: 0.786 ± 0.035, N = 28 neurons. Three independent experiments. Data were analyzed by one-way ANOVA with Tukey’s post hoc test, *P < 0.05. Error bars are SEM. (E) Validation of an shRNA clone (V2LMM_39157, Horizon Discovery) to knockdown rat ITGB1. pGIPZ scrambled non-target (RHS4346, Horizon Discovery) was used as a control. HEK293 cells stably expressing the tet repressor (TR-HEK293) were either transfected with control-shRNA or ITGB1-shRNA in the absence or presence of eGFP or ITGB1-GFP, as indicated. 5 d post-infection, cells were treated with 1 μg/ml of doxycycline to promote the expression of eGFP or ITGB1-GFP. 24 h later, extracts were generated and analyzed by Western blot. (F) Representative confocal images of dendritic spines in DIV16 hippocampal neurons transfected at DIV12 with eGFP (filler) and either ctrl-shRNA or ITGB1-shRNA. Scale bar, 5 µm. Treated with either β1-integrin blocking or isotype control antibodies 24 h before fixation. Scale bar, 5 µm. (G) The numbers of dendritic spines in the first 30 μm of secondary dendrites were quantified. ctrl-shRNA: 0.705 ± 0.044, N = 31 neurons; ITGB1-shRNA: 0.505 ± 0.043, N = 33 neurons. Statistical significance was determined using unpaired two-tailed Student’s t test, **P < 0.01. Error bars are SEM. (H) Hippocampal neurons were transfected at DIV12 with eGFP (filler) and either ctrl-shRNA or SNX17-shRNA. Neurons were treated with either β1-integrin blocking or isotype control antibodies 24 h before fixation at DIV16. The number of dendritic spines in the first 30 μm of secondary dendrites was quantified. ctrl-shRNA + isotype ctrl: 0.689 ± 0.030, N = 26 neurons; ctrl-shRNA +β1-integrin blocking: 0.451 ± 0.021, N = 27 neurons; SNX17-shRNA + isotype ctrl: 0.385 ± 0.026, N = 28 neurons; SNX17-shRNA +β1-integrin blocking: 0.387 ± 0.020, N = 26 neurons. Statistical significance was determined using one-way ANOVA with Tukey’s post hoc test, ****P < 0.001. Error bars are SEM. Source data are available for this figure: SourceData F8.
Figure 9.
Figure 9.
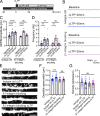
β1-integrin has roles in structural and functional plasticity during cLTP. (A) Diagram of experiment. DIV16-18 hippocampal neurons were treated with either β1-integrin blocking or isotype control antibodies for 30 min, followed by a 5 min cLTP stimulus. mEPSCs were recorded during the first 30 min after cLTP (cLTP < 30) or from 30 to 90 min after cLTP (cLTP > 30). (B) Examples of mEPSC recordings of neurons that were treated with isotype ctrl or β1-integrin blocking antibodies. Recordings were performed in the absence of cLTP (baseline), during the first 30 min after cLTP, or from 30 to 90 min after cLTP. (C) Quantification of mEPSC amplitude. Isotype ctrl baseline: 12.240 ± 0.570, N = 19 neurons; isotype ctrl cLTP < 30 min: 16.790 ± 1.106, N = 9 neurons; isotype ctrl cLTP > 30 min: 16.900 ± 0.954, N = 10 neurons; β1-integrin blocking baseline: 11.570 ± 0.373, N = 9 neurons; β1-integrin blocking cLTP < 30 min: 18.110 ± 1.247, N = 6 neurons; β1-integrin blocking neurons cLTP > 30 min: 13.170 ± 0.458, N = 13 neurons. Three independent experiments. Data were analyzed by one-way ANOVA with Tukey’s post hoc test, ****P < 0.001. Error bars are SEM. (D) Quantification of mEPSC frequency. Isotype ctrl baseline: 1.191 ± 0.227, N = 19 neurons; isotype ctrl cLTP < 30 min: 3.333 ± 0.800, N = 9 neurons; isotype ctrl cLTP > 30 min: 3.110 ± 0.740, N = 10 neurons; β1-integrin blocking baseline: 1.167 ± 0.296, N = 9 neurons; β1-integrin blocking cLTP < 30 min: 3.952 ± 1.214, N = 6 neurons; β1-integrin blocking cLTP > 30 min: 1.096 ± 0.302, N = 13 neurons. Three independent experiments. Data were analyzed by one-way ANOVA with Tukey’s post hoc test, **P < 0.01. Error bars are SEM. (E) Representative confocal images of dendritic spines in DIV16 hippocampal neurons transfected with eGFP (filler) at DIV12. Neurons were treated with β1-integrin blocking or isotype control antibodies for 30 min, followed by a 5-min cLTP stimulus in the presence of antibodies where indicated. Neurons were further incubated in the presence of antibodies for 50 min before fixation. Scale bar, 5 µm. (F) The maximum width for each spine was quantified, and the average size of the dendritic spines in the first 30 μm of secondary dendrites was calculated. Isotype ctrl: 0.626 ± 0.016, N = 28 neurons; isotype ctrl with cLTP: 0.717 ± 0.018, N = 25 neurons; β1-integrin blocking: 0.621 ± 0.015, N = 31 neurons; β1-integrin blocking with cLTP: 0.628 ± 0.010, N = 32 neurons. Three independent experiments. Data were analyzed by one-way ANOVA with Tukey’s post hoc test, ***P < 0.005. Error bars are SEM. (G) Quantification of dendritic spine density (spines/μm). Isotype ctrl: 1.044 ± 0.048, N = 28 neurons; isotype ctrl with cLTP: 0.977 ± 0.050, N = 25 neurons; β1-integrin blocking: 0.931 ± 0.054, N = 31 neurons; β1-integrin blocking with cLTP: 0.931 ± 0.039, N = 32 neurons. Three independent experiments. Data were analyzed by one-way ANOVA with Tukey’s post hoc test. Error bars are SEM.
Figure 10.
Figure 10.
Model of SNX17-mediated modulation of synaptic structure and function. The SNX17-Retriever pathway is required for dendritic spine maintenance and the cLTP-dependent increase in dendritic spine size. Glycine-mediated cLTP (1) stimulates calcium entry through the NMDA receptor, which activates the CaMKII pathway (2). CaMKII activation is necessary and sufficient to promote the recruitment of SNX17 and the Retriever complex to dendritic spines (3), and activates the recycling of β1-integrin from endosomes to the plasma membrane (4). The surface levels of β1-integrin increase during cLTP and promote dendritic spine growth (5). Endosomal PI(3)P increases upon cLTP and may help with the recruitment of SNX17 to synapses. Created with BioRender.com.

References

    1. Babayan, A.H., Kramár E.A., Barrett R.M., Jafari M., Häettig J., Chen L.Y., Rex C.S., Lauterborn J.C., Wood M.A., Gall C.M., and Lynch G.. 2012. Integrin dynamics produce a delayed stage of long-term potentiation and memory consolidation. J. Neurosci. 32:12854–12861. 10.1523/JNEUROSCI.2024-12.2012 - DOI - PMC - PubMed
    1. Böttcher, R.T., Stremmel C., Meves A., Meyer H., Widmaier M., Tseng H.-Y., and Fässler R.. 2012. Sorting nexin 17 prevents lysosomal degradation of β1 integrins by binding to the β1-integrin tail. Nat. Cell Biol. 14:584–592. 10.1038/ncb2501 - DOI - PubMed
    1. Bourgin, C., Murai K.K., Richter M., and Pasquale E.B.. 2007. The EphA4 receptor regulates dendritic spine remodeling by affecting β1-integrin signaling pathways. J. Cell Biol. 178:1295–1307. 10.1083/jcb.200610139 - DOI - PMC - PubMed
    1. Burke, J.E., Triscott J., Emerling B.M., and Hammond G.R.V.. 2022. Beyond PI3Ks: Targeting phosphoinositide kinases in disease. Nat. Rev. Drug Discov. 14:1–30. 10.1038/s41573-022-00582-5 - DOI - PMC - PubMed
    1. Cai, L., Loo L.S., Atlashkin V., Hanson B.J., and Hong W.. 2011. Deficiency of sorting nexin 27 (SNX27) leads to growth retardation and elevated levels of N-methyl-D-aspartate receptor 2C (NR2C). Mol. Cell. Biol. 31:1734–1747. 10.1128/MCB.01044-10 - DOI - PMC - PubMed

Publication types