. 2023 Aug 4;13(8):1862-1883.
doi: 10.1158/2159-8290.CD-22-1401.

Targeting N-linked Glycosylation for the Therapy of Aggressive Lymphomas

Affiliations

Targeting N-linked Glycosylation for the Therapy of Aggressive Lymphomas

Sebastian Scheich et al. Cancer Discov. .

Abstract

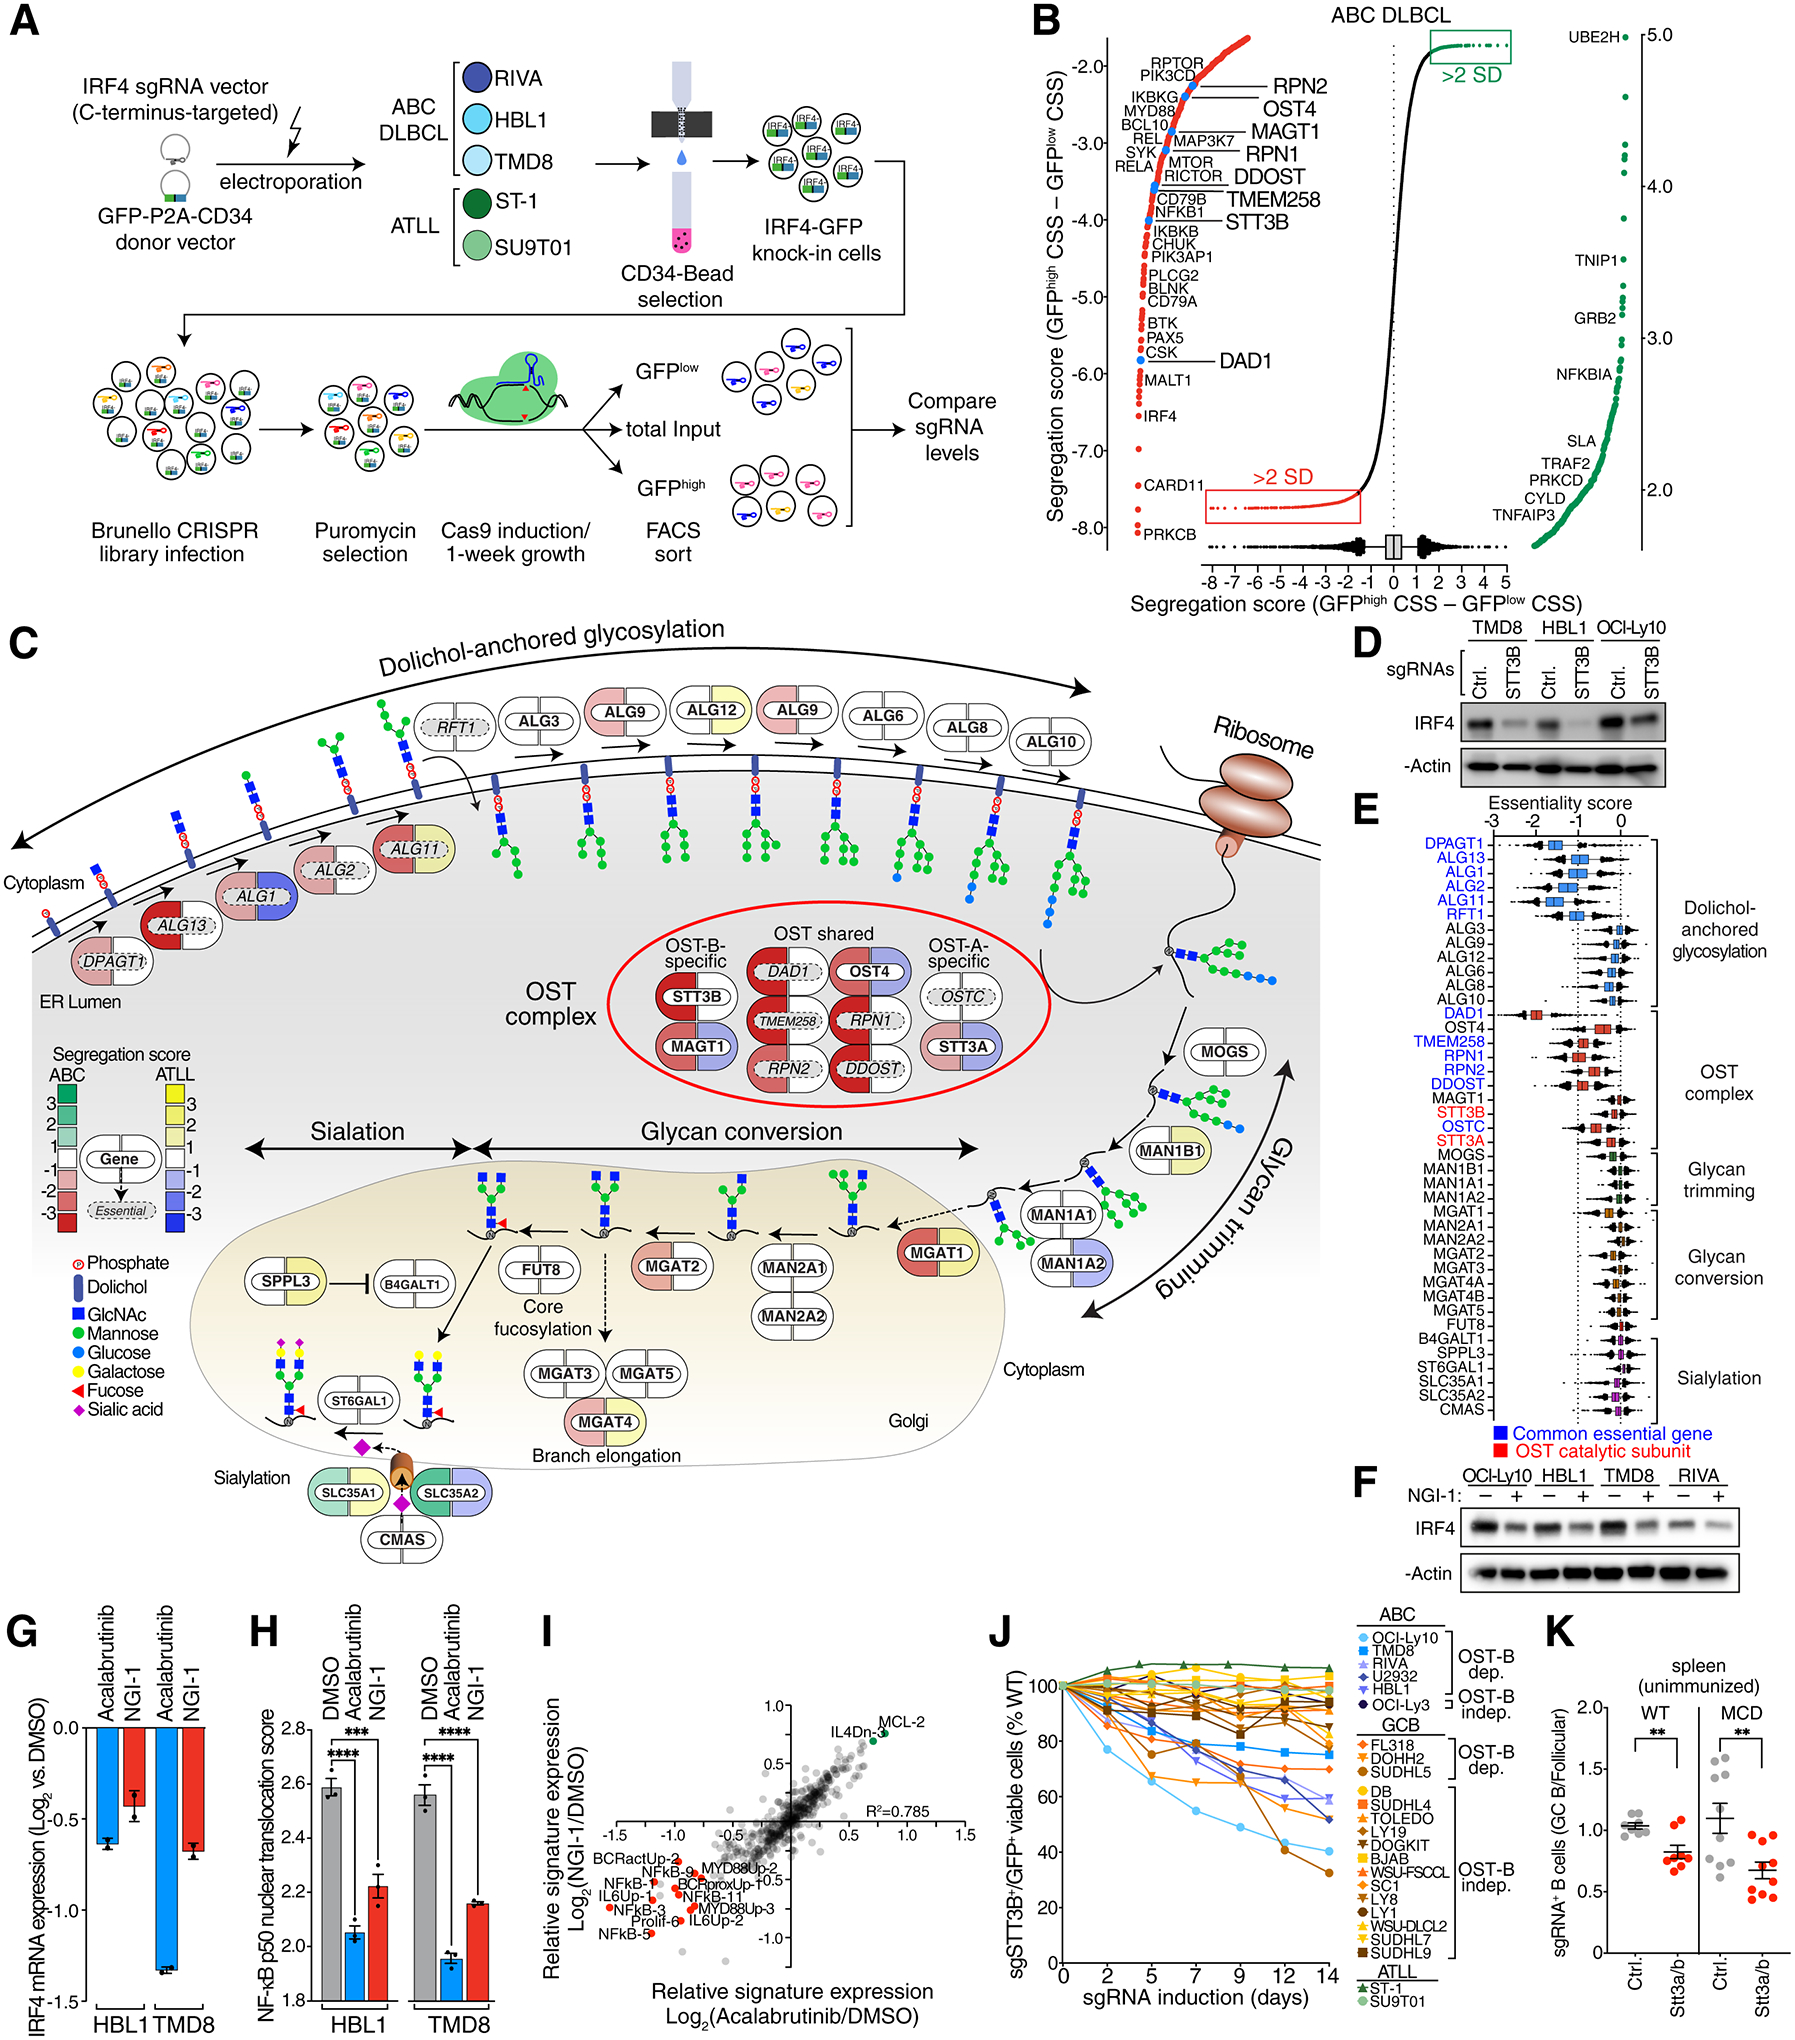
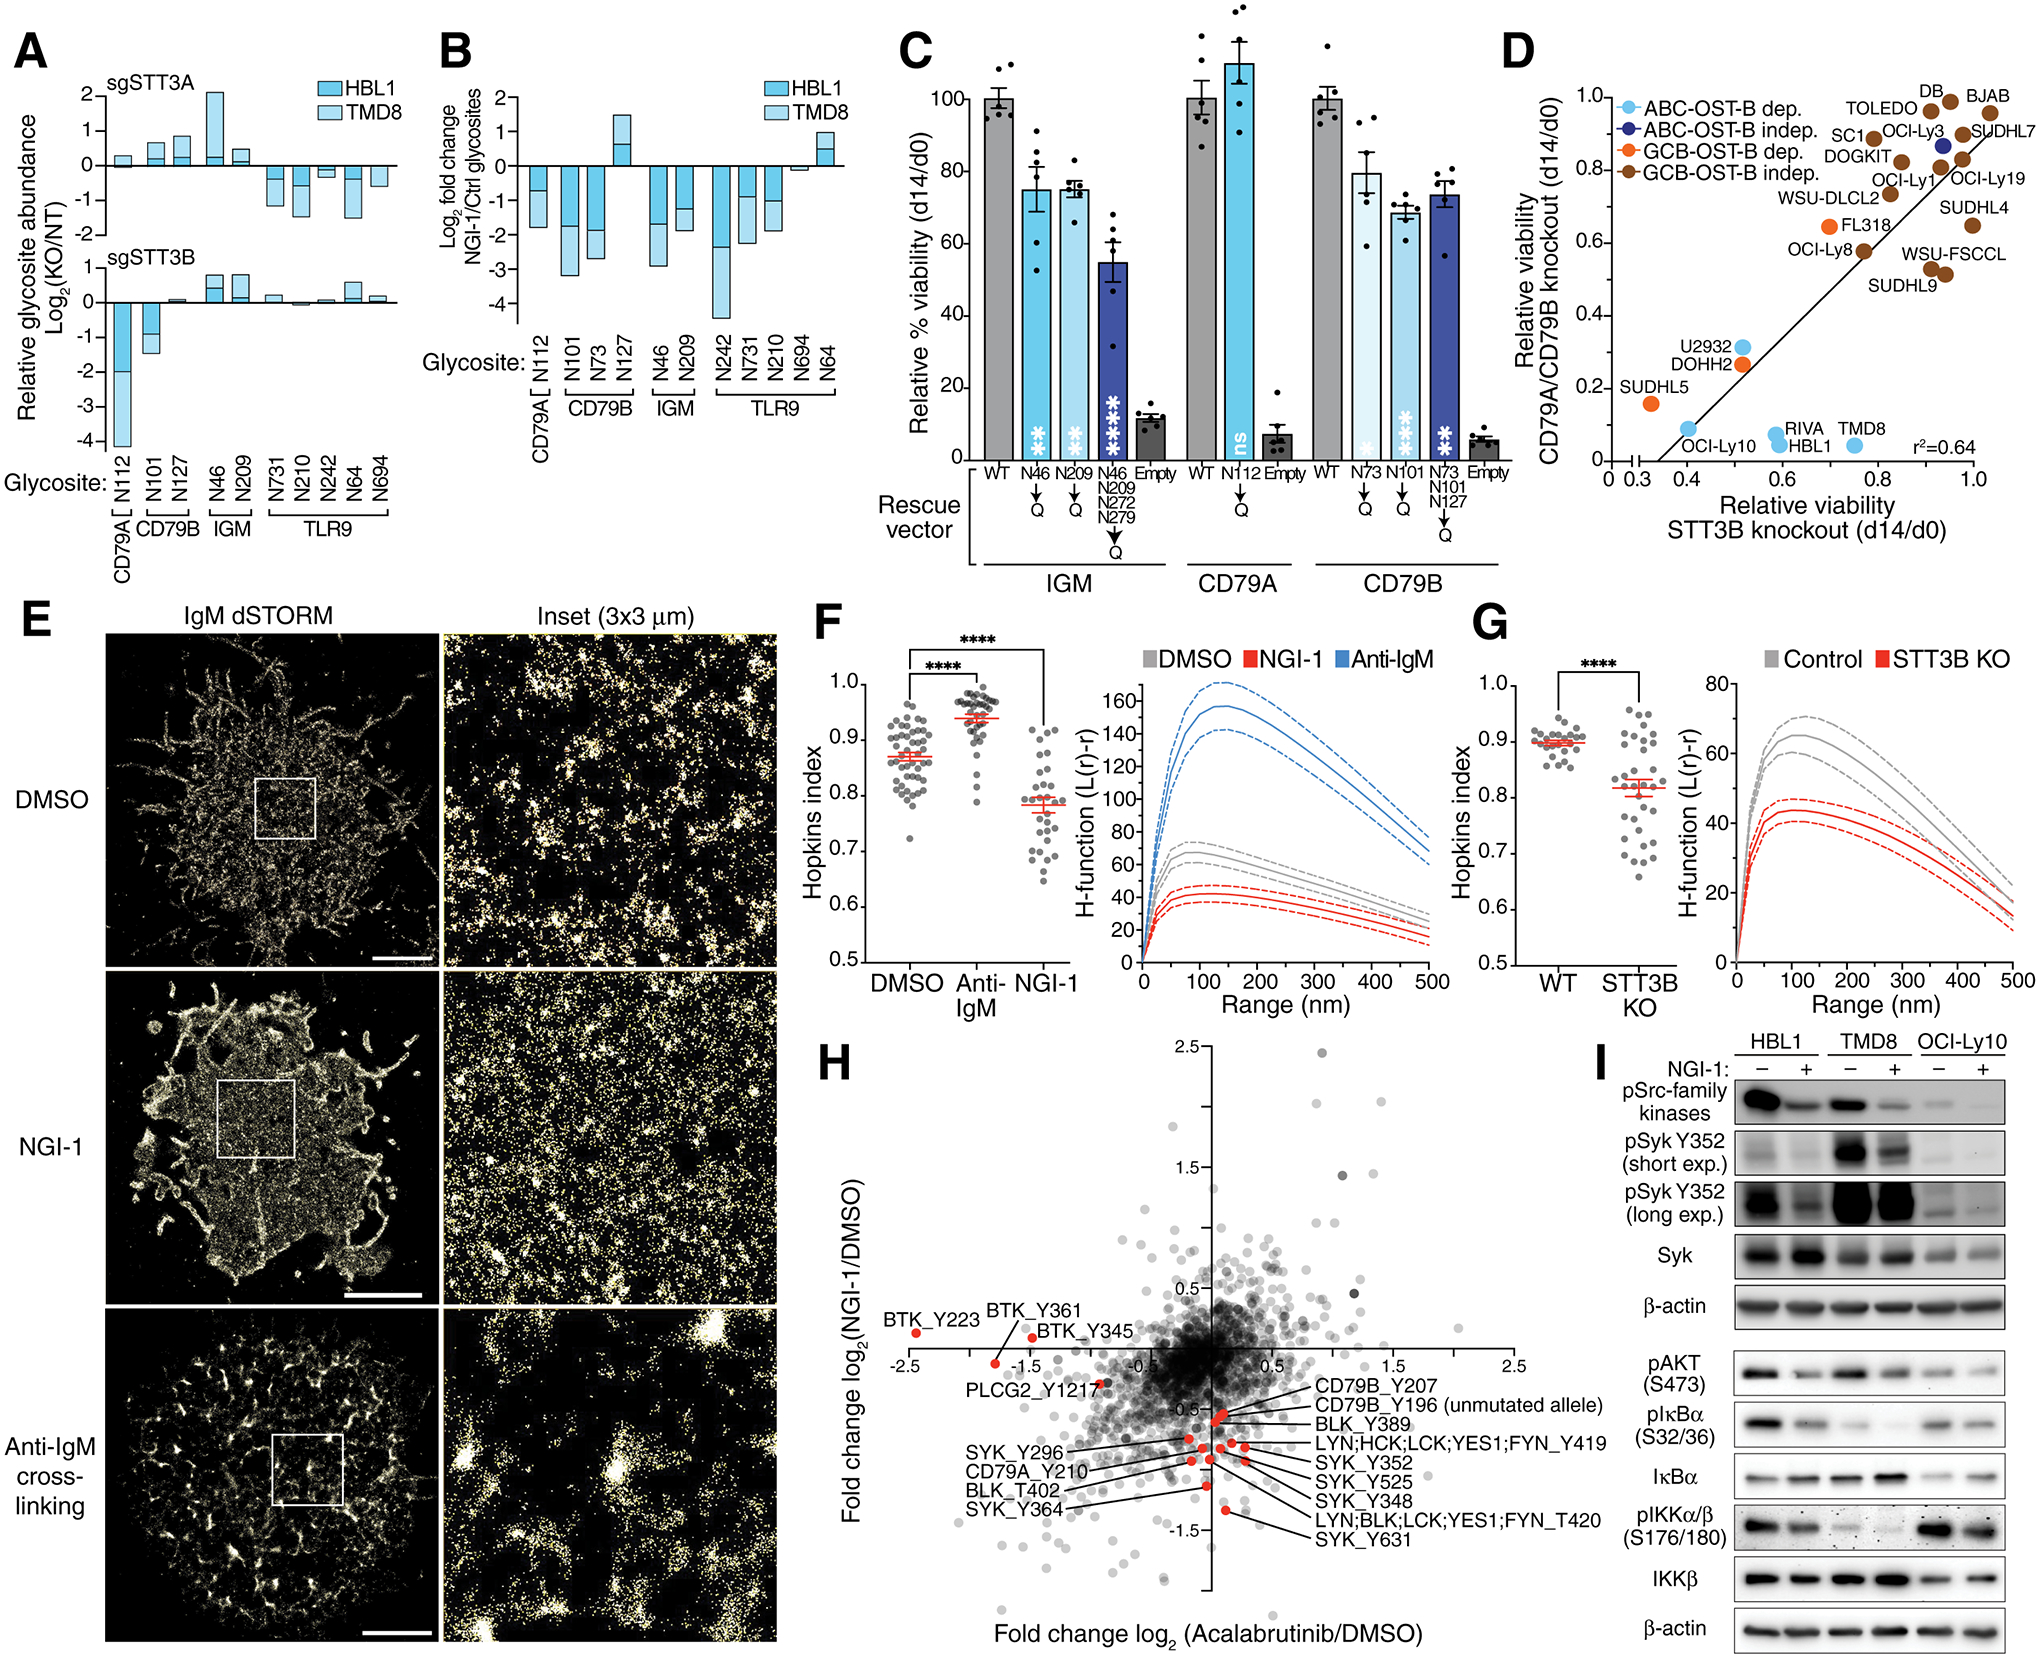
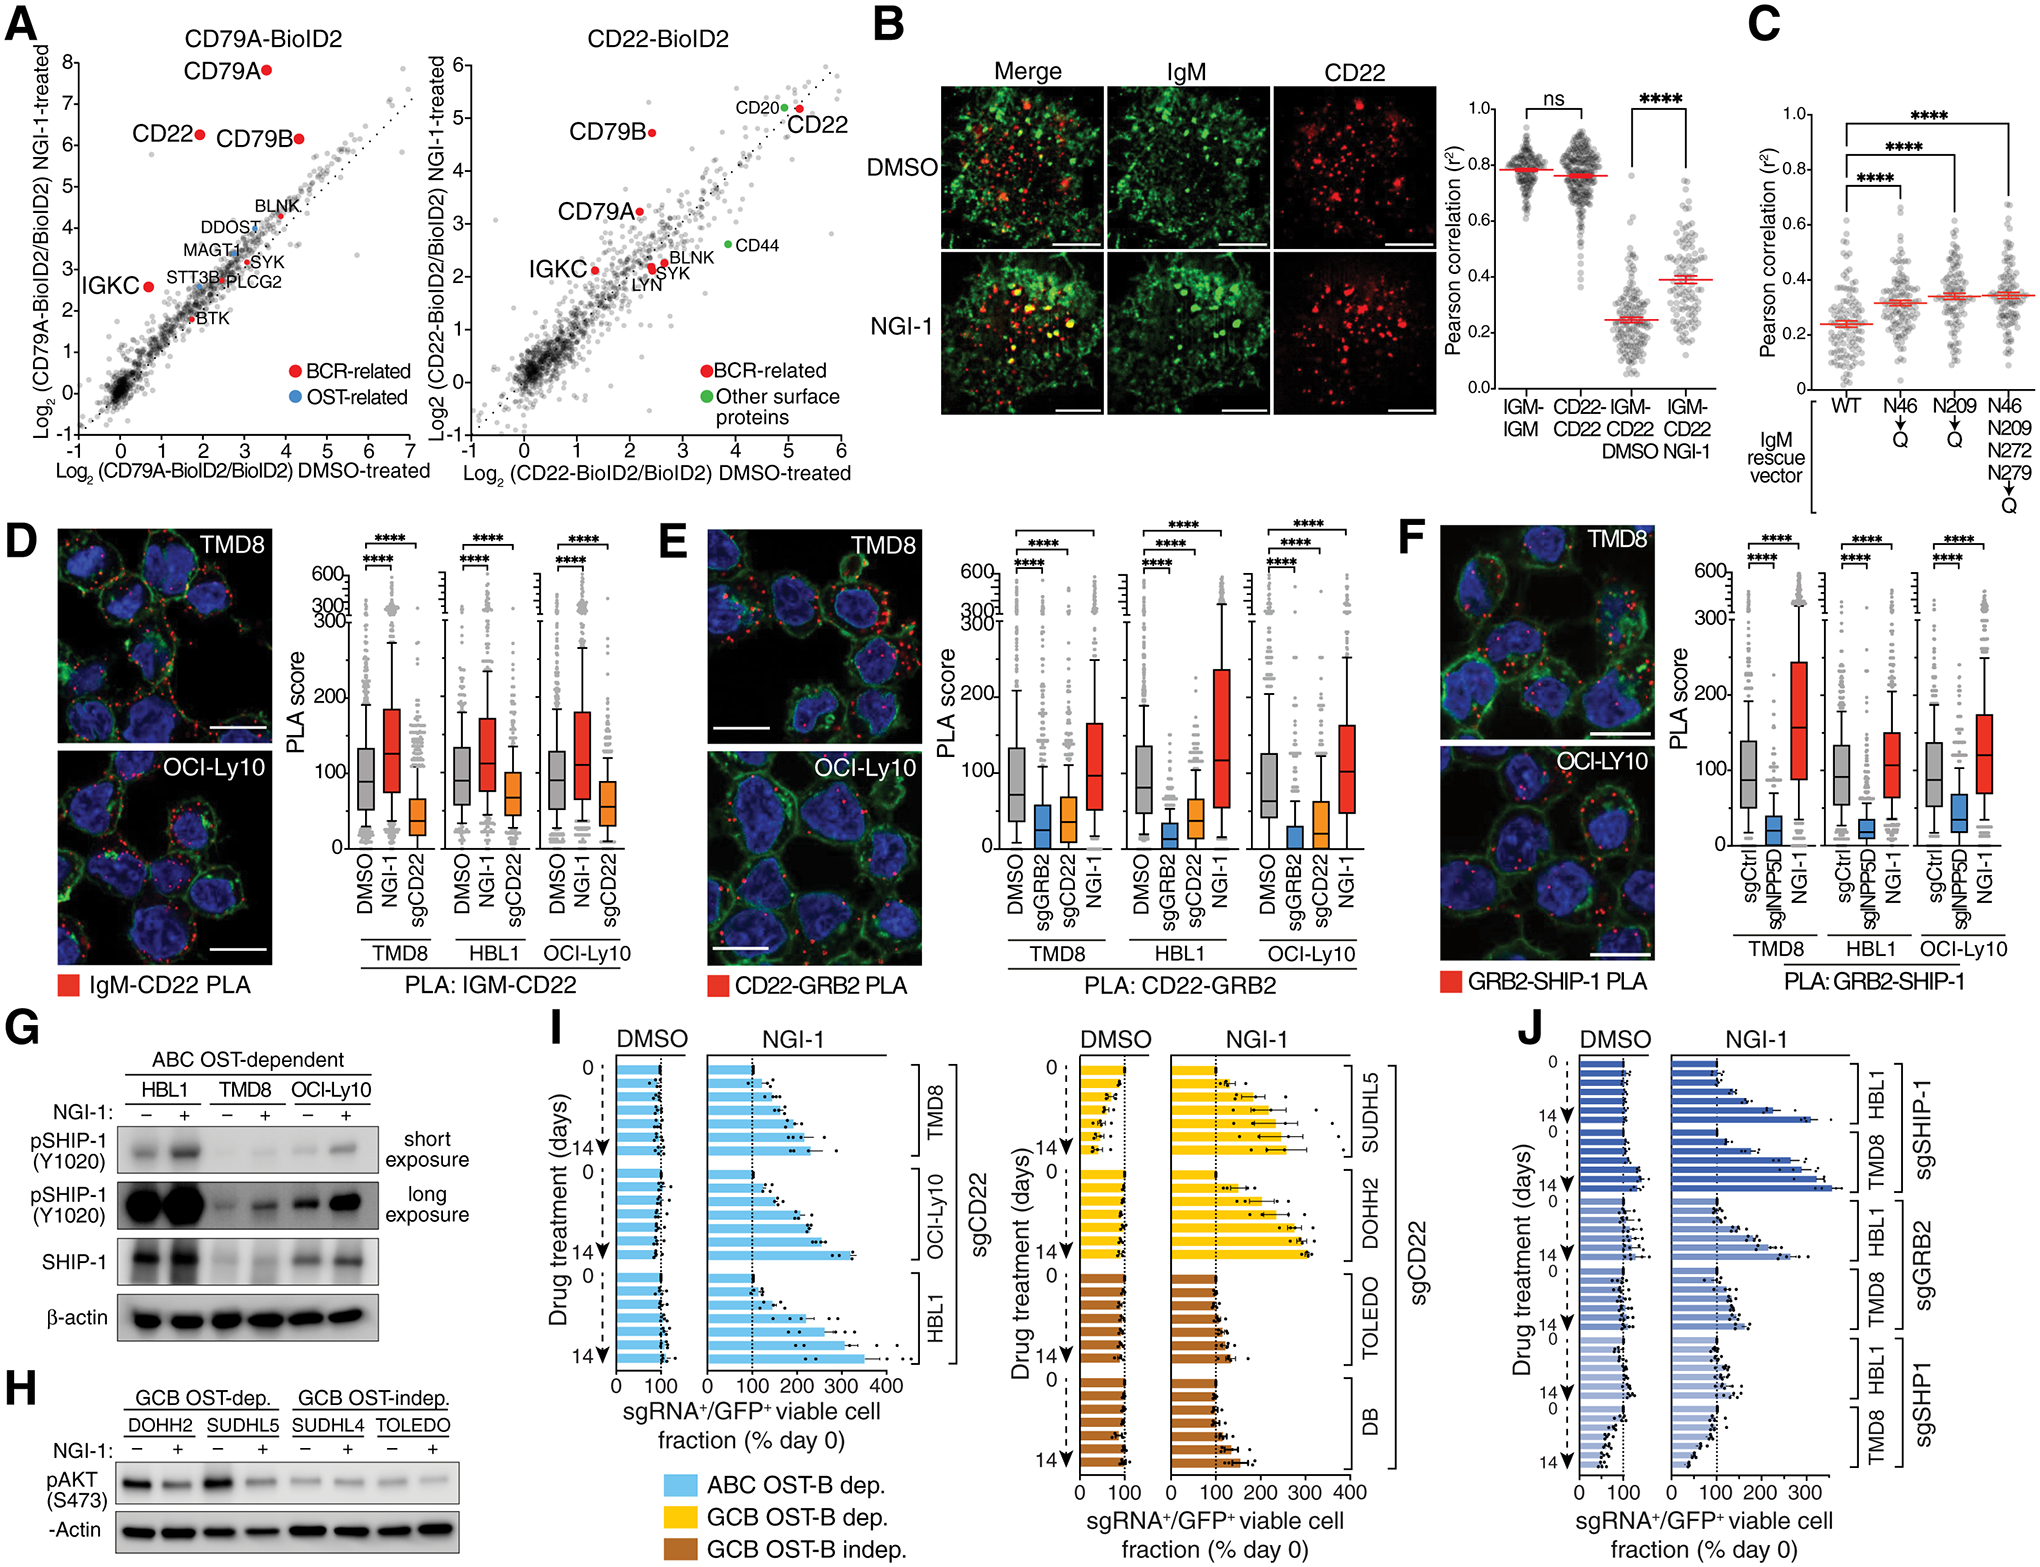
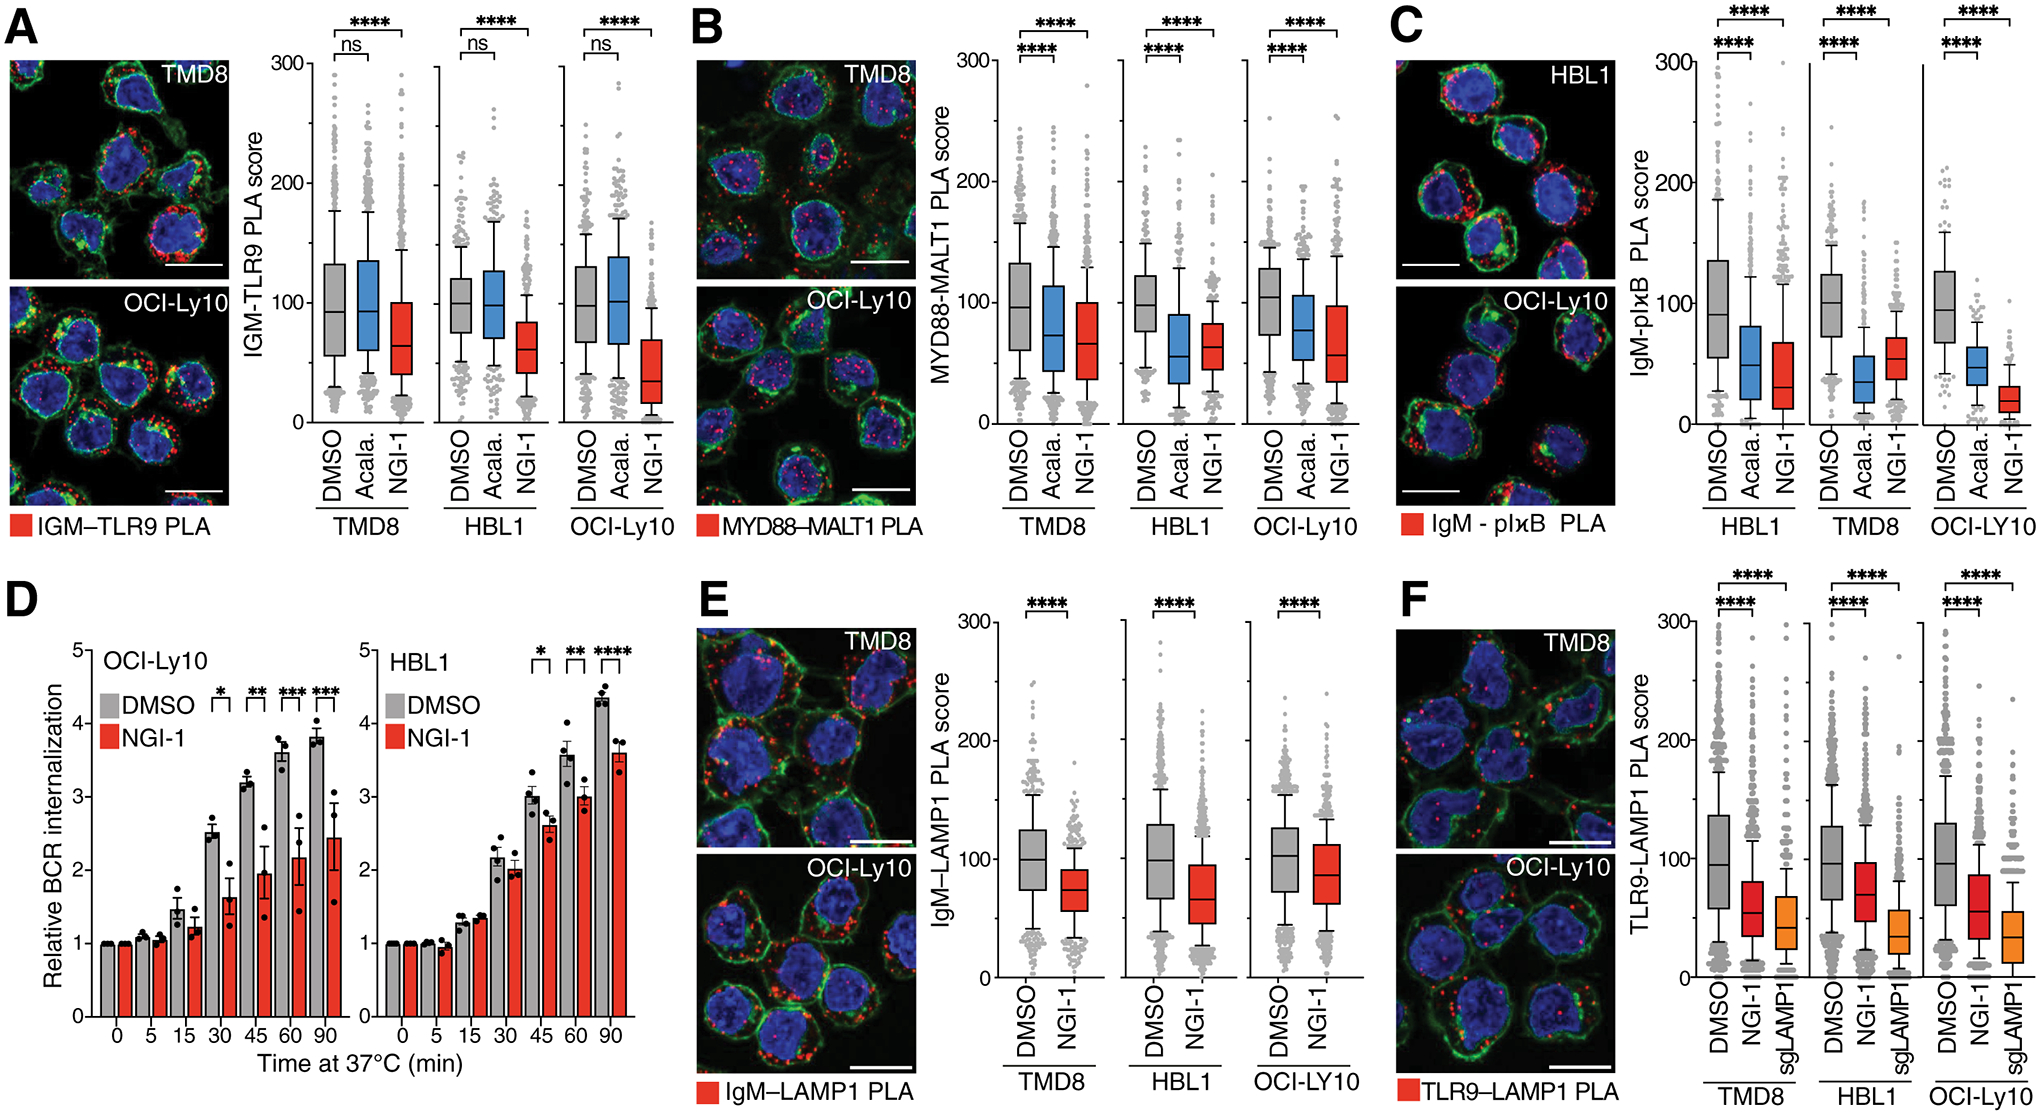
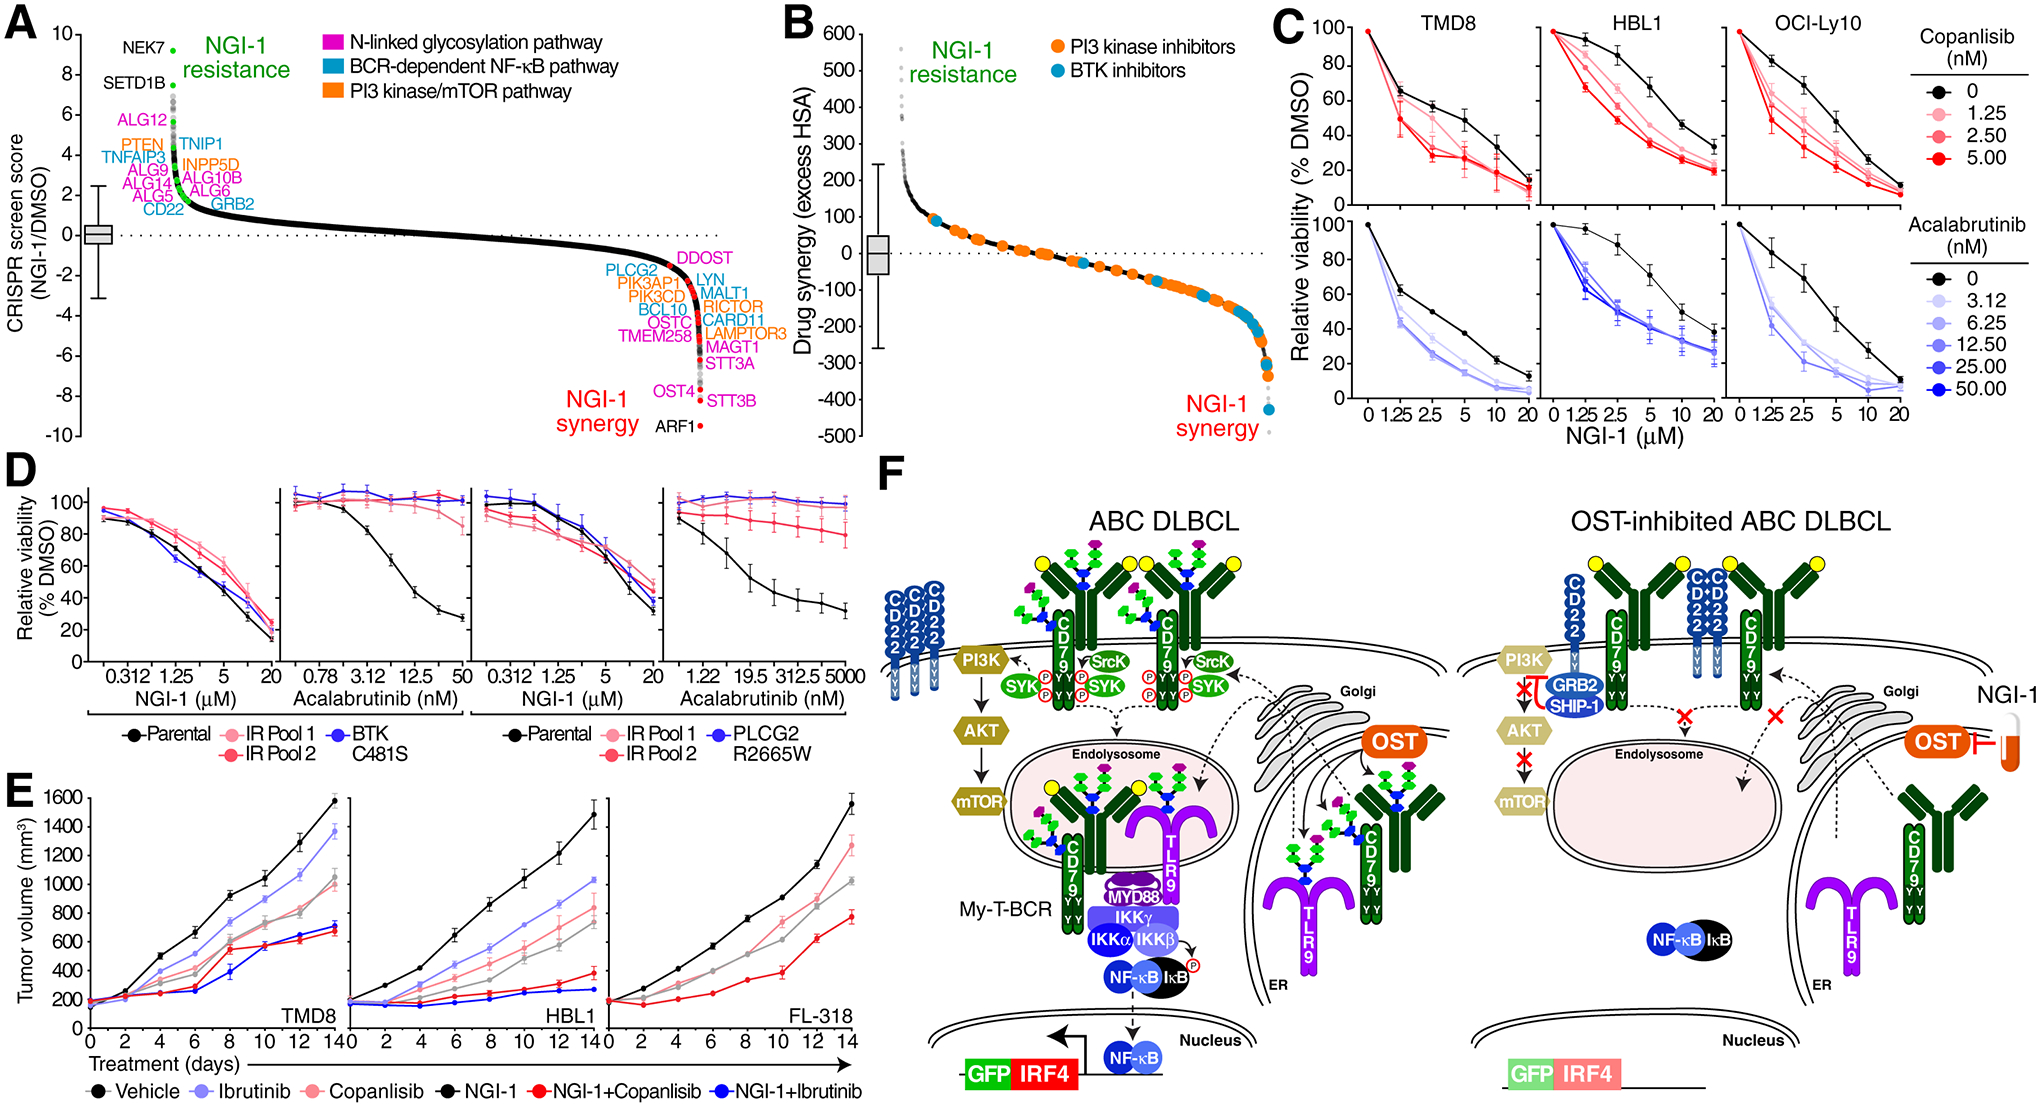
Diffuse large B-cell lymphoma (DLBCL) can be subdivided into the activated B-cell (ABC) and germinal center B cell-like (GCB) subtypes. Self-antigen engagement of B-cell receptors (BCR) in ABC tumors induces their clustering, thereby initiating chronic active signaling and activation of NF-κB and PI3 kinase. Constitutive BCR signaling is essential in some GCB tumors but primarily activates PI3 kinase. We devised genome-wide CRISPR-Cas9 screens to identify regulators of IRF4, a direct transcriptional target of NF-κB and an indicator of proximal BCR signaling in ABC DLBCL. Unexpectedly, inactivation of N-linked protein glycosylation by the oligosaccharyltransferase-B (OST-B) complex reduced IRF4 expression. OST-B inhibition of BCR glycosylation reduced BCR clustering and internalization while promoting its association with CD22, which attenuated PI3 kinase and NF-κB activation. By directly interfering with proximal BCR signaling, OST-B inactivation killed models of ABC and GCB DLBCL, supporting the development of selective OST-B inhibitors for the treatment of these aggressive cancers.

Significance: DLBCL depends on constitutive BCR activation and signaling. There are currently no therapeutics that target the BCR directly and attenuate its pathologic signaling. Here, we unraveled a therapeutically exploitable, OST-B-dependent glycosylation pathway that drives BCR organization and proximal BCR signaling. This article is highlighted in the In This Issue feature, p. 1749.


Conflict of interest statement

COI statement: The authors declare no potential conflicts of interests.

Figures

Figure 1.
Figure 1.. IRF4 knock-in CRISPR screens reveal the OST-B complex as a regulator of NF-κB and IRF4.
A. Scheme and workflow of IRF4 knock-in CRISPR screens. B. Ranked list of genes by their segregation score (CSS GFPhigh – CSS GFPlow) with their 5–95% percentile (box and whiskers) averaged from three ABC DLBCL lines (TMD8, HBL1 and RIVA). Outliers (>2 SD) with negative segregation scores (decreased IRF4-GFP when inactivated) are highlighted in red and outliers (>2 SD) with positive segregation scores (increased IRF4-GFP when inactivated) in green. Highlighted are OST subunits (blue) as well as regulators of oncogenic BCR, PI3 kinase and NF-κB signaling. CSS: CRISPR screen score. C. Pill diagram of the N-linked glycosylation, fucosylation and sialylation pathway. Icons indicate effects on IRF4 protein levels assessed by IRF4-GFP CRISPR screens in ABC cells (left, red to green) or ATLL cells (right, blue to orange). Panessential genes (by DepMap) are marked in italic/grey. D. Immunoblots for the indicated proteins in three ABC cell lines (TMD8, HBL1 and OCI-Ly-10) with knockout of STT3B. E. DepMap essentiality scores of genes involved in N-linked glycosylation, fucosylation and sialylation. Common essential genes are highlighted in blue, OST catalytic subunits in red. F. Immunoblots for the indicated proteins in four ABC cell lines (OCI-Ly10, HBL1, TMD8 and RIVA) after 24h NGI-1 treatment. G. Relative IRF4 mRNA levels (RNA-seq) in HBL1 and TMD8 cells treated with acalabrutinib (ACAL) or NGI-1 for 24h, compared to DMSO-treated cells (n=2). H. Mean nuclear NF-κB (p50) translocation score assessed by ImageStream flow cytometry in HBL1 and TMD8 cells treated for 16h with DMSO, acalabrutinib (ACAL) or NGI-1. ***P ≤ 0.001, ****P ≤ 0.0001 (one-way ANOVA). Data from three independent replicates. Error bars represent SEM. I. Scatter plot of gene expression signature averages in TMD8 cells treated for 24h with acalabrutinib (x-axis) or NGI-1 (y-axis), relative to DMSO-treated cells. Signatures that decreased (red) or increased (green) by 0.7 log2 fold or more are highlighted. J. Toxicity of STT3B knockout in ABC DLBCL, GCB DLBCL and in adult T-cell leukemia/lymphoma (ATLL) lines. Viable cell numbers are normalized to day 0. Error bars represent SEM. dep.: dependent; indep.: independent. K. Ratio of frequency Stt3a/b sgRNA positive GCBs to Stt3a/b sgRNA positive FoB in wildtype (WT) radiation chimeras or MCD radiation chimeras in unimmunized spleen. Data are pooled from 2 independent experiments representative of 4 with 5 mice per group. **P ≤ 0.01 (unpaired two-tailed t test).
Figure 2.
Figure 2.. OST-mediated BCR glycosylation regulates its plasma membrane clustering and signaling.
A. Relative glycosite log2 fold changes of the B cell receptor components (CD79A, CD79B and IGM) and TLR9 in HBL1 and TMD8 cells after knockout of STT3A (upper panel) or STT3B (lower panel) assessed by quantitative mass spectrometry. B. Relative glycosite log2 fold changes of the B cell receptor components (CD79A, CD79B and IGM) and TLR9 in HBL1 and TMD8 cells after treatment with NGI-1 assessed by quantitative mass spectrometry. C. Relative rescue capacity (d14 viability/d0 viability) of IgM, CD79A or CD79B wildtype or the indicated mutant Isoforms following knockout of endogenous IgM, CD79A or CD79B. Mean of six replicates (± SEM) is displayed. *P ≤ 0.05, **P ≤ 0.01, ****P ≤ 0.0001 (one-way ANOVA) compared to WT. D. Scatter plot of toxicity of sgRNAs targeting STT3B on the x-axis compared to the mean toxicity of sgRNAs targeting CD79A and CD79B (y-axis) in the indicated cell lines. E. Reconstructed dSTORM single molecule localizations in TMD8 cells stained with an anti-IgM antibody. White square area is shown magnified (right). Scale bar is 3μm. Representative image of 3 or more experiments. F. Quantification of the IgM distribution assessed by dSTORM in using the Hopkin’s index (left panel) and the H-function (right panel) in TMD8 cells treated for 15 min with a full-length anti-IgM antibody or for 24h with NGI-1 as indicated. Error bars (Hopkins index) and dotted lines (H-function) denote the SEM. Data are pooled from three independent experiments with at least 9 cells per experiment. ****P ≤ 0.0001 (one-way ANOVA). G. Quantification of the IgM distribution assessed by dSTORM in using the Hopkin’s index (left panel) and the H-function (right panel) in TMD8 cells after knockout of STT3B. Error bars (Hopkins index) and dotted lines (H-function) denote the SEM. Data are pooled from three independent experiments with at least 9 cells per experiment. ****P ≤ 0.0001 (one-way ANOVA). H. Changes in global phosphotyrosine abundance in HBL1 and TMD8 cells treated for 16h with acalabrutinib (x-axis) or NGI-1 (y-axis). I. Immunoblots using the indicated antibodies in HBL1, TMD8 and OCI-Ly10 cells treated with NGI-1 as indicated for 16h.
Figure 3.
Figure 3.. CD22 recruitment to the deglycosylated BCR.
A. Left, CD79A-BioID2 interactomes in TMD8 cells treated for 24h with DMSO (x-axis) or NGI-1 (y-axis). OST subunits (blue) and BCR-related proteins (red) are indicated. Right, CD22-BioID2 interactomes in HBL1 cells treated for 24h with DMSO (x-axis) or NGI-1 (y-axis). B. Left, Dual color instant structured illumination microscopy (iSIM) images of TMD8 cells stained for IgM (Alexa-488, green) and CD22 (PE, red) treated for 24h with DMSO or NGI-1. Scale bar: 5μm. Right, Mean Pearson correlation coefficients of dual color iSIM images in TMD8 cells stained with the indicated antibodies and treated for 24h with NGI-1 as indicated. ****P ≤ 0.0001 (one-way ANOVA). Error bars represent SEM. ns, non-significant. C. Mean Pearson correlation coefficients of dual color iSIM images in TMD8 IgM asparagine mutant isoforms as indicated after knockout of endogenous IgM stained with IgM-Alexa488 and CD22-PE antibodies. ****P ≤ 0.0001 (one-way ANOVA). Error bars represent SEM. D., E., F. Left, Representative images from 3 independent PLA assays for the indicated protein-protein interactions showing PLA puncta (red), wheat-germ agglutinin (green) and DAPI (blue) staining. Scale bar: 10μm. Right, PLA scores for the indicated PLA pairs in TMD8, HBL1 and OCI-Ly10 cells. Box and whiskers: 10–90% percentile. ****P ≤ 0.0001 (one-way ANOVA). G., H. Immunoblots using the indicated antibodies in the indicated cell lines treated for 16h with NGI-1 as indicated. I., J. Competitive growth experiment in which the indicated cell lines expressing GFP and the indicated sgRNAs were mixed with GFP wildtype cells in DMSO or NGI-1 as indicated and following GFP over two weeks. Bars display relative GFP+ cells normalized to day 0. Mean of at least three independent experiments. Error bars represent SEM.
Figure 4.
Figure 4.. BCR deglycosylation disrupts My-T-BCR-dependent survival in MCD DLBCL.
A., B., C. Left, PLA images of A. IgM with TLR9, B. MYD88 with MALT1, C. IgM with pIκBα. Representative images of 3 independent experiments with PLA puncta are shown in red, wheat-germ agglutinin in green and DAPI in blue. Scale bar: 10μm. Right, PLA scores of the indicated PLA pairs in TMD8, HBL1 and OCI-Ly10 cells. Box and whiskers: 10–90% percentile. ****P ≤ 0.0001 (one-way ANOVA). D. Mean (± SEM) relative BCR internalization over 90 mins at 37°C in OCI-Ly10 cells (left panel) or HBL1 cells (right panel) treated with NGI-1 for 24h as indicated. ****P ≤ 0.0001 (one-way ANOVA). *P ≤ 0.05, **P ≤ 0.01, ****P ≤ 0.0001 (one-way ANOVA). Error bars represent SEM of at least three independent experiments. E., F. Left, PLA images of E. IgM with LAMP1 and F. TLR9 with LAMP1 in TMD8, HBL1 or OCI-Ly10 cells. Representative images of 3 independent experiments with PLA puncta are shown in red, wheat-germ agglutinin in green and DAPI in blue. Scale bar: 10μm. Right, PLA scores of the indicated PLA pairs in TMD8, HBL1 and OCI-Ly10 cells. Box and whiskers: 10–90% percentile.
Figure 5.
Figure 5.. OST inhibition synergizes with targeted therapies.
A. Ranked curve (CRISPR screen score) of an NGI-1 drug modifier CRISPR screen in TMD8 cells treated with NGI-1 vs. DMSO. Hits in the N-linked glycosylation pathway are highlighted in pink, in the BCR/NF-κB pathway in blue and in the PI3K/mTOR pathway in orange. Box and whiskers: 1–99% percentile. B. Ranked curve of drug synergy/antagonism in high throughput combinatorial drug screens in TMD8 ABC cells of NGI-1 in combination with the MIPE v. 5.0 small molecule library. BTK inhibitors (red) and PI3K inhibitors (blue) are highlighted. Boxplot represents 1–99% percentile. C. MTS proliferation assays for TMD8, HBL1 or OCI-Ly10 cells treated with vehicle (black) and indicated doses of copanlisib (red) or acalabrutinib (blue) with the indicated doses of NGI-1 (x-axis). D. MTS proliferation assays for BTK inhibitor resistant TMD8 or HBL1 cells treated with indicated doses of NGI-1 (x-axis). IR, ibrutinib resistant. E. Growth of TMD8, HBL1 or FL318 xenografts in NSG mice treated with the indicated drugs. F. Model of OST regulation of oncogenic signaling in lymphoma.

References

    1. Alizadeh AA, Eisen MB, Davis RE, Ma C, Lossos IS, Rosenwald A, et al. Distinct types of diffuse large B-cell lymphoma identified by gene expression profiling. Nature 2000;403:503–11. - PubMed
    1. Schmitz R, Wright GW, Huang DW, Johnson CA, Phelan JD, Wang JQ, et al. Genetics and Pathogenesis of Diffuse Large B-Cell Lymphoma. N Engl J Med 2018;378(15):1396–407 doi 10.1056/NEJMoa1801445. - DOI - PMC - PubMed
    1. Wright GW, Huang DW, Phelan JD, Coulibaly ZA, Roulland S, Young RM, et al. A Probabilistic Classification Tool for Genetic Subtypes of Diffuse Large B Cell Lymphoma with Therapeutic Implications. Cancer Cell 2020;37(4):551–68 e14 doi 10.1016/j.ccell.2020.03.015. - DOI - PMC - PubMed
    1. Chapuy B, Stewart C, Dunford AJ, Kim J, Kamburov A, Redd RA, et al. Molecular subtypes of diffuse large B cell lymphoma are associated with distinct pathogenic mechanisms and outcomes. Nat Med 2018;24(5):679–90 doi 10.1038/s41591-018-0016-8. - DOI - PMC - PubMed
    1. Lacy SE, Barrans SL, Beer PA, Painter D, Smith AG, Roman E, et al. Targeted sequencing in DLBCL, molecular subtypes, and outcomes: a Haematological Malignancy Research Network report. Blood 2020;135(20):1759–71 doi 10.1182/blood.2019003535. - DOI - PMC - PubMed

Publication types

MeSH terms