. 2023 Nov 15;119(14):2458-2468.
doi: 10.1093/cvr/cvad068.

An interferon gamma response signature links myocardial aging and immunosenescence

Affiliations

An interferon gamma response signature links myocardial aging and immunosenescence

DiyaaElDin Ashour et al. Cardiovasc Res. .

Abstract

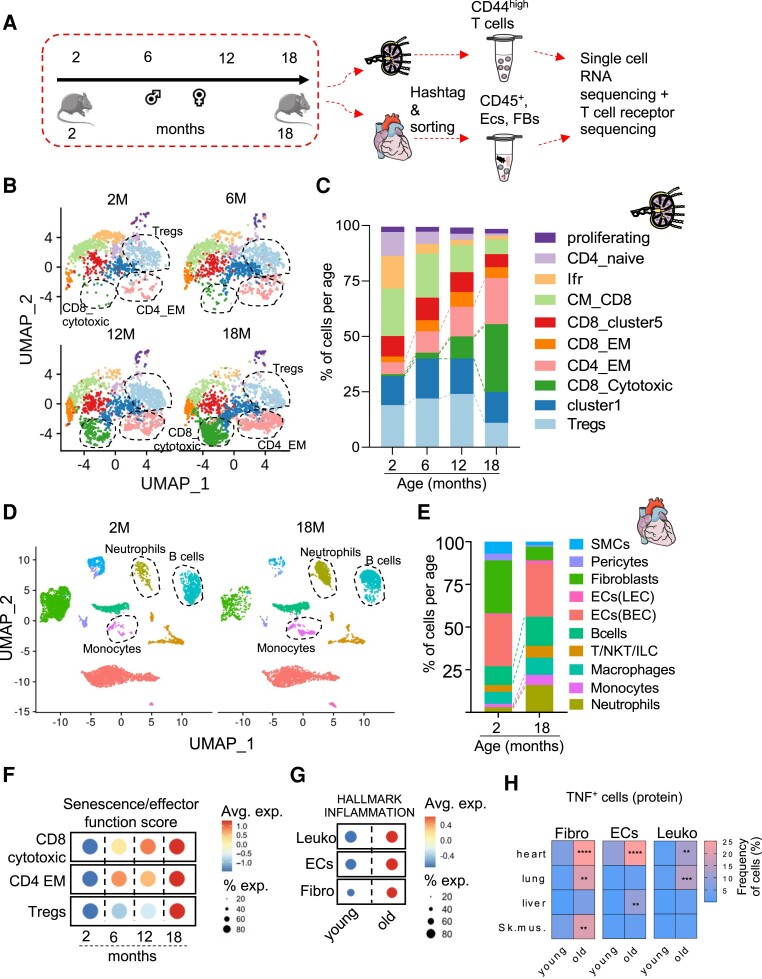
Aims: Aging entails profound immunological transformations that can impact myocardial homeostasis and predispose to heart failure. However, preclinical research in the immune-cardiology field is mostly conducted in young healthy animals, which potentially weakens its translational relevance. Herein, we sought to investigate how the aging T-cell compartment associates with changes in myocardial cell biology in aged mice.

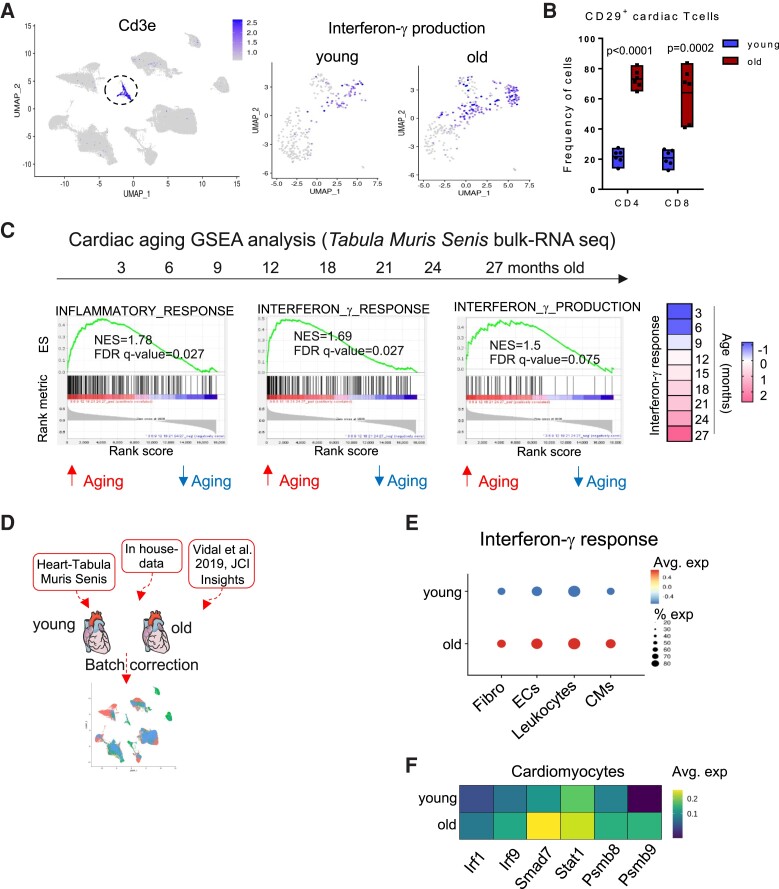
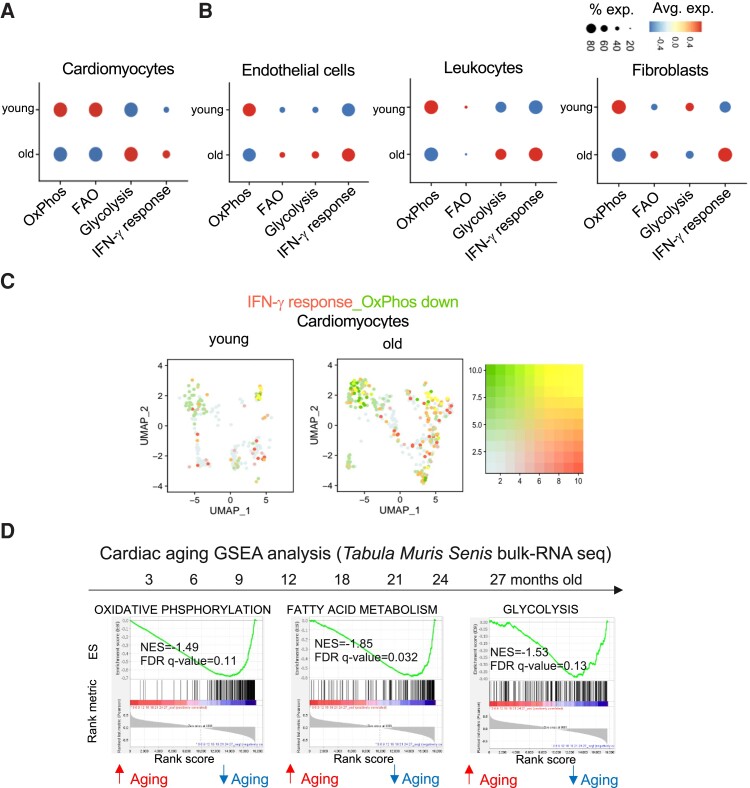
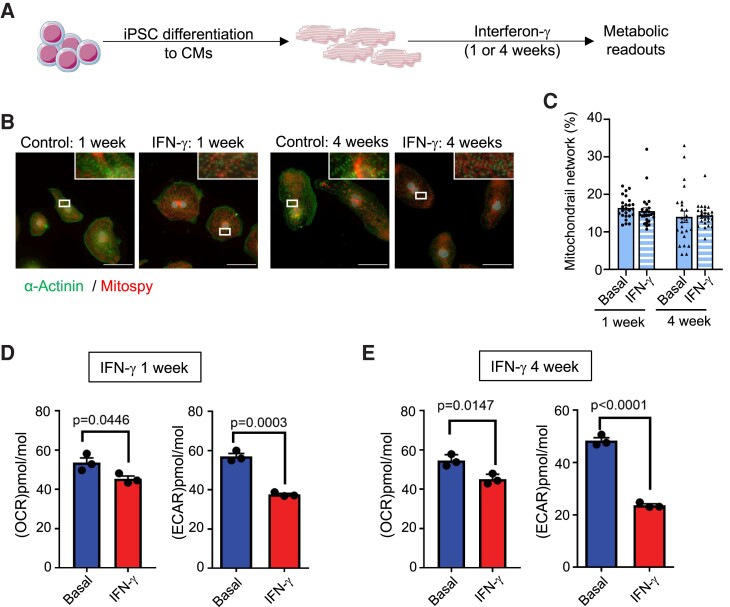
Methods and results: We phenotyped the antigen-experienced effector/memory T cells purified from heart-draining lymph nodes of 2-, 6-, 12-, and 18-month-old C57BL/6J mice using single-cell RNA/T cell receptor sequencing. Simultaneously, we profiled all non-cardiomyocyte cell subsets purified from 2- to 18-month-old hearts and integrated our data with publicly available cardiomyocyte single-cell sequencing datasets. Some of these findings were confirmed at the protein level by flow cytometry. With aging, the heart-draining lymph node and myocardial T cells underwent clonal expansion and exhibited an up-regulated pro-inflammatory transcription signature, marked by an increased interferon-γ (IFN-γ) production. In parallel, all major myocardial cell populations showed increased IFN-γ responsive signature with aging. In the aged cardiomyocytes, a stronger IFN-γ response signature was paralleled by the dampening of expression levels of transcripts related to most metabolic pathways, especially oxidative phosphorylation. Likewise, induced pluripotent stem cells-derived cardiomyocytes exposed to chronic, low grade IFN-γ treatment showed a similar inhibition of metabolic activity.

Conclusions: By investigating the paired age-related alterations in the T cells found in the heart and its draining lymph nodes, we provide evidence for increased myocardial IFN-γ signaling with age, which is associated with inflammatory and metabolic shifts typically seen in heart failure.

Keywords: Cardiac aging; Heart failure and immune cells; Interferon gamma; T cells.


Conflict of interest statement

Conflict of interest: None declared.

Figures

Figure 1
Figure 1
Dissecting aging kinetics using single-cell transcriptomics from cardiac cells and T cells in heart-draining mediastinal lymph node simultaneously. Panel A: experimental outline for the sc-seq pipeline. Panel B: UMAP plot representation of the sorted 7243 mediastinal lymph node effector/memory T cells from 2-, 6-, 12-, to18-month-old male and female C57BL/6J mice shown on a UMAP dimensionality reduction plot. Panel C: bar graph representation for the lymph node T cell subsets identified based on the Seurat clustering among the different age groups. Age groups were identified based on the hashtag antibody signal, which was demultiplexed prior to Seurat clustering. Panel D: UMAP plot representation of the sorted 12 613 non-cardiomyocyte cells from 2- (left) to 18- (right) month-old male and female hearts. Panel E: bar graph representation for the cardiac cell subset distribution among the 2- and 18-month-old hearts. Panel F: dot plot of the compiled scores for the average expression levels of gene sets ascribing a gene set of senescence and effector functions within mediastinal lymph node CD8-cytotoxic, CD4-EM, and Tregs among the different age groups. Size of the dot represents the percentage of cells expressing the gene set within each population and colour represents the expression level. Panel G: dot plot of the complied score for genes related to the inflammaging process within cardiac fibroblasts, endothelial cells, and leucocytes from 2- to 18-month-old hearts. Each age group comprises four mice that were pooled into two meta-mice (one male and one female in each pool) for panels (B, C, D, E, F, G). Panel H: heatmap of the frequency of intracellular TNF+ expression in fibroblasts, endothelial cells, and leucocytes, assessed by flow cytometry in different anatomical sites in 2- and 18-month-old female C57BL/6J mice (n = 6). Statistical test: two-way ANOVA followed by Sidak’s multiple comparisons test. **P < 0.01, ***P < 0.001, ****P < 0.0001.
Figure 2
Figure 2
A clonally expanded, effector and IFN-γ producing profile of T cells in mediastinal lymph node T cells from aged mice. Panel A: T cell receptor sequencing analysis overlaid on UMAP plots of the T cell subsets from the different age groups. Cells are colour-coded according to how many times the T cell receptor is repeated i.e. clonal size. The identity of the T cell receptor clones is based on the variable chain usage (VDJ gene segments) and the CDR3 sequences. Panel B: dot plot of the complied score for gene sets ascribed to Th1/17 effector, cytotoxicity functions, glycolysis activity, cellular senescence-related genes, and exhaustion classified based on the definition of the clonally expanding class. Panel C: feature plot for the expression score of IFN-γ production gene set in each cell projected onto dimension reduction ‘UMAP’ plots to identify the signature expression in the different age groups in lymph node T cells. Panel D: dot plot of the averaged expression of Tbx21, Eomes, Cxcr3, and Itgb1 within CD4-EM, Tregs, and CD8 cytotoxic T cells along the aging axis. Panel E: feature plot showing the overlapping expression score of IFN-γ production gene set (red) and clonal expansion (green) per cell base in the lymph node T cell subsets. Cells with a high overlapping score are indicated with a yellow colour. Each age group comprises four mice that were pooled into two meta-mice (one male and one female in each pool) for panels (A, B, C, D, E). Panel F: (left) representative flow cytometry plot from young (2 months old) and old (18 months old) mediastinal lymph node for CD29 (Itgb1) and IFN-γ double positive population in CD8 and CD4 T cells from mediastinal lymph nodes. (Right) frequency of CD4+ IFN-γ+ CD29+ (left) and CD8+ IFN-γ+ CD29+ (right) T cells from mediastinal lymph nodes of 2-, 6-, 12-, and 18-month-old C57BL/6J mice. The bar graphs indicate the group mean values ± SEM per group (n = 4–6), and the distribution of each individual value. Statistical test: ordinary one-way ANOVA followed by Dunnett’s multiple comparison test. Panel G: heatmap depicting the frequency of CD29+ CD4+ (upper panel) and CD8+ (lower panel) T cells assessed by flow cytometry in different anatomical sites in 2- and 18-month-old female C57BL/6J mice (n = 6). Statistical test: two-way ANOVA followed by Sidak’s multiple comparisons test. ***P < 0.001, ****P < 0.0001.
Figure 3
Figure 3
An IFN-γ signature builds up in aged hearts. Panel A: (left) feature plot of Cd3e indicating T cells within the heart sc-seq dataset. (Right) Feature plot for the expression score of interferon-γ production gene set within the cardiac T cells in 2- and 18-month-old hearts after subsetting and re-clustering. Panel B: frequency of CD29+ CD4+ and CD8+ T cells from heart tissue of 2- and 18-month-old female C57BL/6J mice. The bar graphs indicate the group mean values ± SEM per group (n = 6), and the distribution of each individual value. Statistical test: unpaired t-test. Panel C: (left) gene set enrichment analysis of inflammatory response, IFN- γ response, and IFN- γ production genes in an age range of 3–27 months from cardiac tissue of C57BL/6J mice from the Tabula Muris Senis bulk RNA-seq data. Normalized enrichment score (NES) and false discovery rate (FDR) are indicated in the graphs. (Right) heatmap of the normalized score of IFN-γ response gene set in cardiac tissue of the different ages. Blue indicates down-regulation and rosa indicates up-regulation of the signature. All replicates from the Tabula Muris Senis per age group were used for the analysis. An FDR value <0.25 was considered significant. Panel D: computational pipeline for integrating the cardiac single-cell sequencing datasets. Panel E: dot plot of the complied score for IFN-γ response gene set in cardiac fibroblasts, endothelial cells, macrophages, and cardiomyocytes (CMs) from 2- to 18-month-old hearts. Panel F: heatmaps of selected differentially expressed genes from the IFN-γ response gene set in young and old cardiomyocytes from the Tabula Muris Senis data. Each age group comprises four mice that were pooled into two meta-mice (one male and one female in each pool) for in-house generated sc-seq data.
Figure 4
Figure 4
Dynamics of interferon-γ response and metabolic gene signatures in aged cardiomyocytes. Panel A: dot plot of the complied score for OxPhos, FAO, glycolysis, and interferon-γ response gene sets in young and old cardiomyocytes from the Tabula Muris Senis data. Panel B: dot plot of the complied score for OxPhos, FAO, glycolysis, and interferon-γ response gene sets in young and old endothelial cells, leucocytes, and fibroblasts from in-house generated sc-seq data. Panel C: feature plot showing the overlapping expression score of IFN-γ response gene set (red) and the expression score of down-regulation of OxPhos gene set (green) per cell base in young, and old cardiomyocytes. Cells with a high overlapping score are indicated with a yellow colour. Panel D: gene set enrichment analysis (GSEA) of Oxphos, FAO, glycolysis gene sets in an age range of 3–27 months from cardiac tissue of C57BL/6J mice from the Tabula Muris Senis bulk RNA-seq data. Normalized enrichment score (NES) and false discovery rate (FDR) are indicated in the graphs. All replicates from the Tabula Muris Senis per age group were used for the analysis. An FDR value <0.25 was considered significant. Each age group comprises four mice that were pooled into two meta-mice (one male and one female in each pool) for in-house generated sc-seq data.
Figure 5
Figure 5
Effect of IFN-γ stimulation on iPSC derived cardiomyocytes. Panel A: schematic representation of the experiment outline. Panel B: visualization of sarcomeric (α-actinin/green) and mitochondrial (Mitospy/red) structure of iPSC-CM with treatment of IFN-γ. Scale bars = 50 µm Panel C: quantification of mitochondrial network structures based on the Mitospy-staining. Statistical analysis was performed with Mann–Whitney. Every dot represents one analysed picture. Panels D and E: basal respiration (OCR) and H+ production (ECAR) of iPSC-derived cardiomyocytes after 1 (D) or 4 (E) weeks of IFN-γ stimulation or control cultures. Each point indicates group mean value ± SEM per group (n = 3 differentiations of five measurements each). Statistical test: unpaired t-test.

Comment in

  • Interferon-gamma signs off an old heart.
    Harding D, Marelli-Berg F. Harding D, et al. Cardiovasc Res. 2023 Nov 15;119(14):2387-2389. doi: 10.1093/cvr/cvad151. Cardiovasc Res. 2023. PMID: 37883721 No abstract available.

References

    1. Coats AJS. Ageing, demographics, and heart failure. Eur Heart J Suppl 2019;21:L4–l7. - PMC - PubMed
    1. Swirski FK, Nahrendorf M. Cardioimmunology: the immune system in cardiac homeostasis and disease. Nat Rev Immunol 2018;18:733–744. - PubMed
    1. Franceschi C, Bonafè M, Valensin S, Olivieri F, De Luca M, Ottaviani E, De Benedictis G. Inflamm-aging. An evolutionary perspective on immunosenescence. Ann N Y Acad Sci 2000;908:244–254. - PubMed
    1. Bollini S, Guzik TJ. Old, but gold? Not the case for the immune system when promoting systemic ageing. Cardiovasc Res 2022;118:e14–e16. - PubMed
    1. Min H, Montecino-Rodriguez E, Dorshkind K. Reduction in the developmental potential of intrathymic T cell progenitors with age. J Immunol 2004;173:245–250. - PubMed

Publication types

Substances

Grants and funding