

Longitudinal profiles of neighborhood socioeconomic vulnerability influence blood pressure changes across the female midlife period
- PMID: 37141837
- PMCID: PMC10407757
- DOI: 10.1016/j.healthplace.2023.103033
Longitudinal profiles of neighborhood socioeconomic vulnerability influence blood pressure changes across the female midlife period
Abstract
Purpose: To examine whether longitudinal exposure to neighborhood socioeconomic vulnerability influences blood pressure changes throughout midlife in a racially, ethnically, and geographically-diverse cohort of women transitioning through menopause.
Methods: We used longitudinal data on 2738 women (age 42-52 at baseline) living in six United States cities from The Study of Women's Health Across the Nation. Residential histories, systolic blood pressures (SBP), and diastolic blood pressures (DBP) were collected annually for ten years. We used longitudinal latent profile analysis to identify patterns of neighborhood socioeconomic vulnerability occurring from 1996 to 2007 in participant neighborhoods. We used linear mixed-effect models to determine if a woman's neighborhood profile throughout midlife was associated with blood pressure changes.
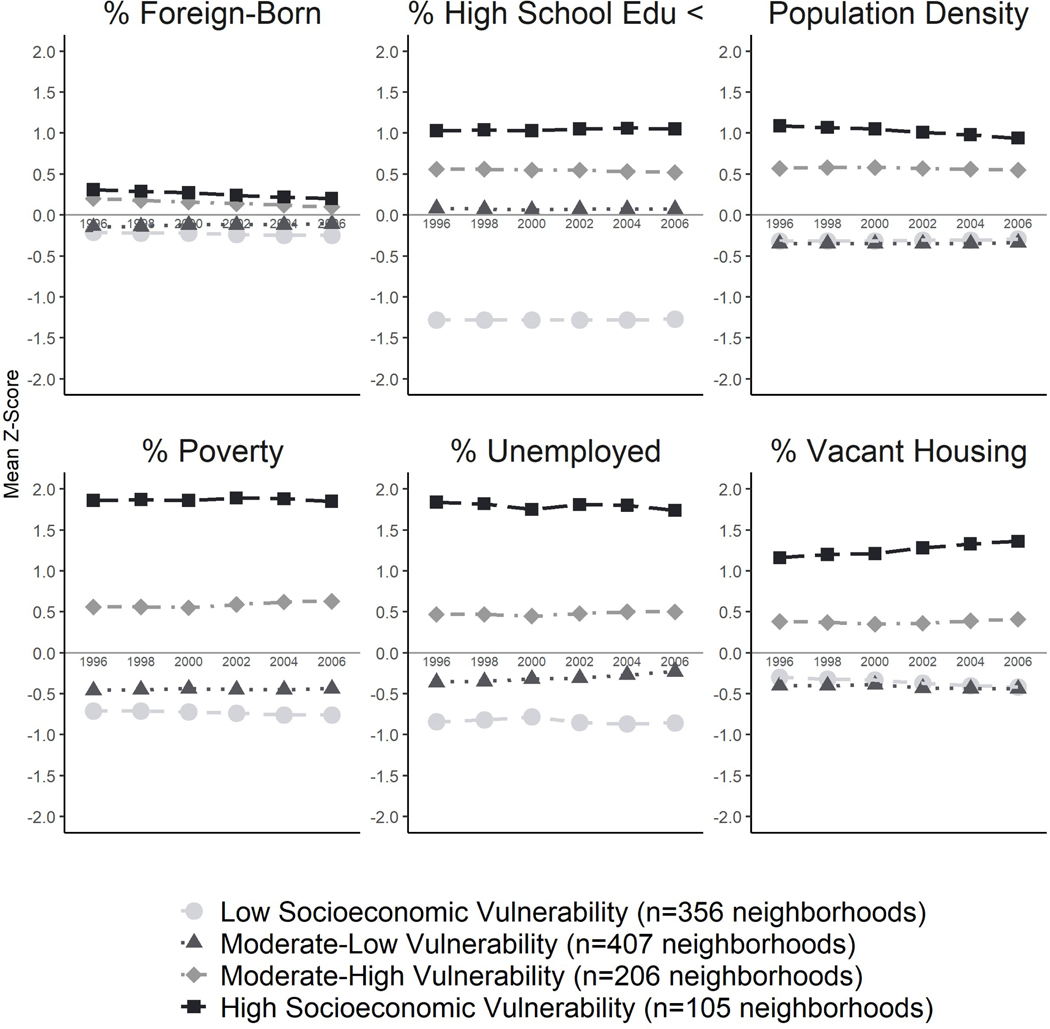
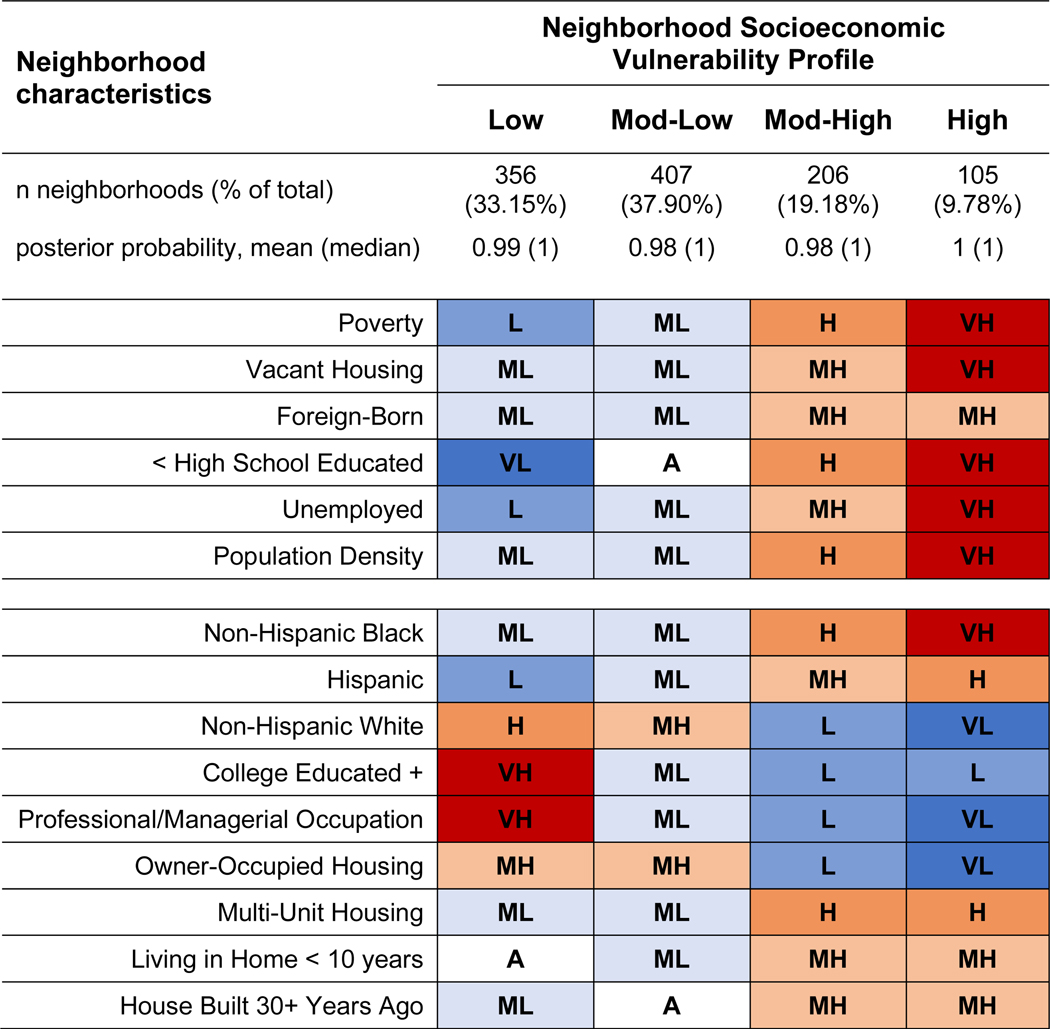
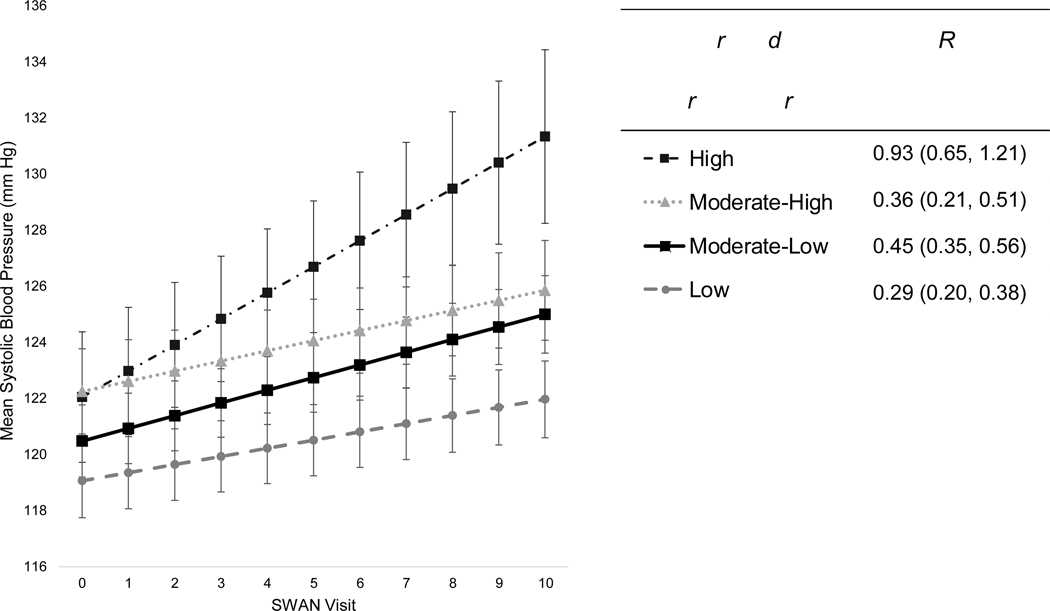
Results: We identified four unique profiles of neighborhood socioeconomic vulnerability - differentiated by residential socioeconomic status, population density, and vacant housing conditions - which remained stable across time. Women residing in the most socioeconomically vulnerable neighborhoods experienced the steepest increase in annual SBP growth by 0.93 mmHg/year (95% CI: 0.65-1.21) across ten-year follow-up.
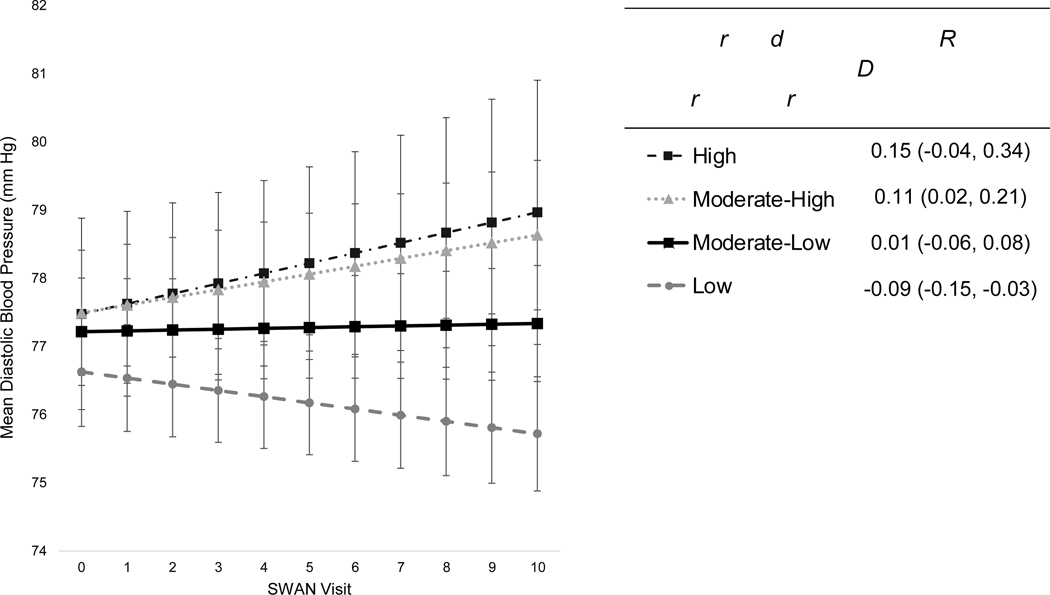
Conclusions: Neighborhood socioeconomic vulnerability was significantly associated with accelerated SBP increases throughout midlife among women.
Keywords: Blood pressure; Epidemiology; Health disparities; Hypertension; Midlife; Neighborhood.
Copyright © 2023 Elsevier Ltd. All rights reserved.
Conflict of interest statement
Declaration of competing interest None.
Figures
Similar articles
-
Neighborhood physical environments and change in cardiometabolic risk factors over 14 years in the study of Women's health across the nation.Health Place. 2024 May;87:103257. doi: 10.1016/j.healthplace.2024.103257. Epub 2024 May 1. Health Place. 2024. PMID: 38696876 Free PMC article.
-
Exposure to neighborhood concentrated poverty is associated with faster decline in episodic memory among midlife women.Alzheimers Dement. 2025 Apr;21(4):e70139. doi: 10.1002/alz.70139. Alzheimers Dement. 2025. PMID: 40189810 Free PMC article.
-
Liveable residential space, residential density, and hypertension in Hong Kong: A population-based cohort study.PLoS Med. 2021 Nov 2;18(11):e1003824. doi: 10.1371/journal.pmed.1003824. eCollection 2021 Nov. PLoS Med. 2021. PMID: 34727119 Free PMC article.
-
Longitudinal associations of neighborhood socioeconomic status with cardiovascular risk factors: A 46-year follow-up study.Soc Sci Med. 2019 Nov;241:112574. doi: 10.1016/j.socscimed.2019.112574. Epub 2019 Sep 25. Soc Sci Med. 2019. PMID: 31593787 Free PMC article.
-
Neighborhood Safety and Hypertension Risk: A Systematic Review.J Am Heart Assoc. 2025 Apr 15;14(8):e035381. doi: 10.1161/JAHA.124.035381. Epub 2025 Apr 3. J Am Heart Assoc. 2025. PMID: 40178095 Free PMC article.
Cited by
-
Multiple Environmental Exposures and the Development of Hypertension in a Prospective US-Based Cohort of Female Nurses: A Mixture Analysis.Environ Sci Technol. 2024 Aug 13;58(32):14146-14157. doi: 10.1021/acs.est.4c03722. Epub 2024 Jul 31. Environ Sci Technol. 2024. PMID: 39083359 Free PMC article.
-
Impact of Social Determinants of Health on Hypertension Outcomes: A Systematic Review.Hypertension. 2024 Aug;81(8):1675-1700. doi: 10.1161/HYPERTENSIONAHA.123.22571. Epub 2024 Jun 18. Hypertension. 2024. PMID: 38887955 Free PMC article.
-
Does change in area-level deprivation, change health outcomes? A latent class growth analysis of population data.SSM Popul Health. 2025 Jun 11;31:101826. doi: 10.1016/j.ssmph.2025.101826. eCollection 2025 Sep. SSM Popul Health. 2025. PMID: 40607177 Free PMC article.
-
Neighborhood-Level Disparities in Hypertension Prevalence and Treatment Among Middle-Aged Adults.JAMA Netw Open. 2024 Aug 1;7(8):e2429764. doi: 10.1001/jamanetworkopen.2024.29764. JAMA Netw Open. 2024. PMID: 39177999 Free PMC article.
-
Social Inequities in Cardiovascular Disease Risk Factors at Multiple Levels Persist Among Mothers in Texas.Int J Environ Res Public Health. 2025 Mar 10;22(3):404. doi: 10.3390/ijerph22030404. Int J Environ Res Public Health. 2025. PMID: 40238515 Free PMC article.
References
-
- Virani SS, et al., Heart Disease and Stroke Statistics-2020 Update: A Report From the American Heart Association. Circulation, 2020: p. CIR0000000000000757. - PubMed
-
- Kramer H, et al., Racial/ethnic differences in hypertension and hypertension treatment and control in the multi-ethnic study of atherosclerosis (MESA). Am J Hypertens, 2004. 17(10): p. 963–70. - PubMed
-
- Carnethon MR, et al., Cardiovascular Health in African Americans: A Scientific Statement From the American Heart Association. Circulation, 2017. 136(21): p. e393–e423. - PubMed
-
- Lloyd-Jones DM, et al., Ethnic variation in hypertension among premenopausal and perimenopausal women: Study of Women’s Health Across the Nation. Hypertension, 2005. 46(4): p. 689–95. - PubMed
MeSH terms
Grants and funding
LinkOut - more resources
Full Text Sources
Medical
