. 2023 Jul 11;35(7):1261-1279.e11.
doi: 10.1016/j.cmet.2023.04.011. Epub 2023 May 3.

Organism-wide, cell-type-specific secretome mapping of exercise training in mice

Affiliations

Organism-wide, cell-type-specific secretome mapping of exercise training in mice

Wei Wei et al. Cell Metab. .

Abstract

There is a significant interest in identifying blood-borne factors that mediate tissue crosstalk and function as molecular effectors of physical activity. Although past studies have focused on an individual molecule or cell type, the organism-wide secretome response to physical activity has not been evaluated. Here, we use a cell-type-specific proteomic approach to generate a 21-cell-type, 10-tissue map of exercise training-regulated secretomes in mice. Our dataset identifies >200 exercise training-regulated cell-type-secreted protein pairs, the majority of which have not been previously reported. Pdgfra-cre-labeled secretomes were the most responsive to exercise training. Finally, we show anti-obesity, anti-diabetic, and exercise performance-enhancing activities for proteoforms of intracellular carboxylesterases whose secretion from the liver is induced by exercise training.

Keywords: CES2; cell type; energy metabolism; exercise; exercise performance; hepatokine; obesity; secretome; tissue crosstalk.


Conflict of interest statement

Declaration of interests Stanford University has filed a provisional patent on extracellular CES2 proteins and methods of use.

Figures
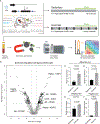
Fig 1.
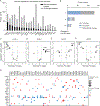
Fig 1.. Study design and overview of exercise training secretomes across 21 cell types in mice.
(A) Overview of the study design including viral transduction (AAV9-FLEx-ER-TurboID, 3*10e11 GC/mouse, intravenously) of 21 cre driver lines (male, N = 3/condition/genotype, see Methods) and wildtype C57BL/6 mice (male, N = 3/condition), 1-week treadmill running (20 m/min for 60min per day), secretome labeling (biotin delivered via biotin water (0.5 mg/ml) and via injection (24 mg biotin/ml, intraperitoneally, in a solution of 18:1:1 saline:Kolliphor EL:DMSO, final volume of 200 μl per mouse per day) in the last three days of running), enrichment of biotinylated plasma proteins using streptavidin beads and proteomic analysis. BAT: brown adipose tissue. (B) Volcano plot of adjusted P-values (−log10) and exercise fold change (log2) of total 1272 cell type-protein pairs. Adjusted P-values were calculated from moderated t-statistics (see Methods). Black dots indicate exercise-regulated cell type-protein pairs (adjusted P-values < 0.05 and exercise fold change > 1.5) and gray dots indicate unchanged cell type-protein pairs (adjusted P-values > 0.05 or exercise fold change < 1.5). (C-F) Relative abundance of exercise training -regulated (C, D and F) and exercise training-unregulated (E) cell type-protein pairs from exercise and sedentary mice. N = 3/genotype/condition, mean ± SEM. In (C-F), P-values were calculated from two-tailed unpaired t-tests.
Fig 2.
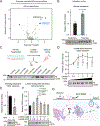
Fig 2.. Systematic analysis of exercise training-regulated cell type-protein pairs.
(A) Bar graph of exercise training-regulated proteins (black) and unchanged proteins (gray) across 21 cell types. (B) Histogram of increased (gray), decreased (blue) and bidirectionally changed (light gray) secreted proteins after exercise training across 21 cell types. (C-F) Volcano plot of adjusted P-values (−log10) and exercise fold change (log2) of indicated example proteins. Black dots indicate exercise training-regulated cell type-protein pairs (adjusted P-values < 0.05 and exercise fold change > 1.5) and gray dots indicate unchanged cell type-protein pairs (adjusted P-values > 0.05 or exercise fold change < 1.5). (G) Bubble plot of adjusted P-values (−log10) and exercise fold change (log2) of proteins changed in more than 1 cell type after exercise training. Red dots indicate increased proteins after exercise training and blue dots indicated decreased proteins.
Fig 3.
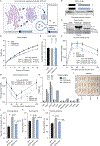
Fig 3.. Characterizations of exercise training secretomes from Pdgfra-cre labeled cells.
(A) Bar graph of exercise responsiveness scores across cell types. Exercise responsiveness scores of a given cell type were calculated by summarization of the score of individual exercise regulated protein (adjusted P-values < 0.05 and exercise fold change > 1.5) of that cell type with the following equation: sum(absolute exercise fold change (log2) × confidence of the change (−log10(adjusted P-values))) × percent of secretome change (number of exercise training regulated proteins (adjusted P-values < 0.05 and exercise fold change > 1.5) / total number of secreted proteins of that cell type). See Methods. (B) Volcano plot of adjusted P-values (−log10) and exercise fold change (log2) of Pdgfra secretomes. Black dots indicate exercise training -regulated cell type-protein pairs (adjusted P-values < 0.05 and exercise fold change > 1.5) and gray dots indicate unchanged cell type-protein pairs (adjusted P-values > 0.05 or exercise fold change < 1.5). (C) Gene ontology analysis of exercise training regulated proteins (adjusted P-values < 0.05 and exercise fold change > 1.5) from Pdgfra secretomes. Size of bubbles represents P-values (−log10) of biological processes enrichment and y axis represents gene ratio. (D) Study design of secretome analysis of heterozygous Pdgfra-cre mice (12-week-old male, N = 3/condition) injected with 3*10e11 GC/mouse AAV9-FLEx-ER-TurboID and tamoxifen. Three weeks after tamoxifen delivery, these mice were subjected to acute running (single bout, 20 m/min for 60 min), 3-day or 7-day treadmill running (daily, 20 m/min for 60 min) or being sedentary. Secretome labeling was initiated via injection (24 mg biotin/ml, intraperitoneally, in a solution of 18:1:1 saline:Kolliphor EL:DMSO, final volume of 400 μl per mouse per day) in the last bout of running and biotinylated plasma proteins were enriched using streptavidin beads and analyzed by western blotting (see Methods). (E) Anti-F13A (top), anti-C4BPA (second row), anti-ITIH2 (third row) of eluted biotinylated plasma proteins from streptavidin beads after immune purification. Silver stain of total eluted biotinylated plasma proteins was used as loading control and for quantifications (bottom row). Samples (N = 3/condition) were from the experiment described in the legend of Fig. 3D.
Fig 4.
Fig 4.. Lactate-induced CES2 secretion in mouse primary hepatocytes.
(A) Volcano plot of adjusted P-values (−log10) and exercise fold change (log2) of Albumin secretomes. Black dots indicate exercise training-regulated cell type-protein pairs (adjusted P-values < 0.05 and exercise fold change > 1.5) and gray dots indicate unchanged cell type-protein pairs (adjusted P-values > 0.05 or exercise fold change < 1.5). (B) Anti-CES2 (bottom) blotting and quantifications of band intensity (top) of immune purified biotinylated plasma proteins from 10-week-old Albumin-cre male mice transduced with 3*10e11 vg AAV9-FLEx-ER-TurboID virus and exercised on a treadmill for 1-week. N = 5/group, mean ± SEM. (C-F) Anti-CES2 blotting (bottom) and quantifications of band intensity (D-F) of conditioned medium of primary hepatocytes isolated from 8 to 12-week-old male C57BL/6J mice. Cells were treated with 2 mM indicated organic compounds (C), indicated concentrations of sodium lactate (D), sodium lactate (2 mM) and BFA (5 μg/ml) (E), indicated concentrations of sodium lactate and AR-C155858 (F) for 4 h before analysis. CES2 band intensity was normalized to albumin signal for quantifications. Experiments in each panel contains three biological replicates, mean ± SEM. (G) Model of CES2 secretion from cells. Exercise training-inducible rise of extracellular lactate induces release of ER-lumen-resident CES2 from hepatocytes. Functional lactate transporters and ER-Golgi vesicle transport are required for CES2 secretion. P-values for quantifications in this figure were calculated from two-tailed unpaired t-tests.
Fig 5.
Fig 5.. Secreted CES2 proteins exhibit anti-obesity, and anti-diabetic, and endurance-enhancing effects in mice.
(A) Cartoon schematic of conventional ER lumen localized CES2A/C (left) and engineered CES2A/C-ΔC (right). The C-terminal HXEL sequence was removed from conventional CES2A/C to generate engineered soluble CES2A/C-ΔC. (B) Cartoon schematic of the AAV constructs driven by the hepatocyte-specific Tbg promoter and study design of HFD feeding experiment. 8 to 10-week-old male C57BL/6 mice were transduced with AAV-Tbg-CES2A-ΔC or AAV-Tbg-CES2C-ΔC or AAV-Tbg-GFP (N = 10/group, 10e11 GC/mouse, intravenously). 1-week later, mice were placed with HFD feeding for 7 weeks. In the last week, glucose tolerance test and insulin tolerance test were conducted. At the end of this experiment, tissues and blood were harvested and analyzed. (C) Anti-Flag blotting (top) or loading control (bottom) of blood plasma from 16 to 18-week-old male C57BL/6 mice injected with indicated viruses. N = 4/condition. (D-I) Body weights over the first 7-week of HFD feeding (D) and food intake (measured weekly) (E), glucose tolerance test (F), insulin tolerance test (G), tissue weights (H) and inguinal white adipose tissue (iWAT), epididymal adipose tissue (eWAT) and brown adipose tissue (BAT) after 48 h of 4% PFA fixation (I) from 16 to 18-week-old male C57BL/6 mice injected with indicated viruses for 8 weeks. N = 10/condition, mean ± SEM. Samples from (I) were from randomly chosen from mice of each treatment group. (J-L) Maximal running speed (J), total running time (K) and total running distance (L) of 16 to 18-week-old male C57BL/6 mice 8 weeks after being injected with AAV-Tbg-CES2A-ΔC, AAV-Tbg-CES2C-ΔC or AAV-Tbg-GFP (N = 8–10/group, 10e11 GC/mouse, intravenously). Mice were acclimated to the treadmill two days prior to the maximal running tests (10 min at 10 m/min). The maximal running test was performed as previously described, (see Methods). Mean ± SEM. P-values for (E), (H) and (J-L) were calculated from two-tailed unpaired t-tests. P-values from (D), (F) and (G) were calculated from two-way ANOVA with post hoc Sidak’s multiple comparisons test.
Fig 6.
Fig 6.. The anti-obesity effects of soluble CES2 proteins require enzyme activity.
(A) Body weights over the first 9-week of HFD feeding of 18 to 20-week-old male C57BL/6 mice injected with indicated viruses (N = 10/group, 10e11 GC/mouse, intravenously). Mice were fed with HFD 1-week after viral transduction. Mean ± SEM. (B) Untargeted metabolomic measurements of significantly changed features (adjusted P-values < 0.05 and fold change > 1.5) in blood plasma of 16 to 18-week-old male C57BL/6 mice being transduced with 10e11 AAV-Tbg-CES2A-ΔC, AAV-Tbg-CES2C-ΔC or AAV-Tbg-GFP (N = 5/group). Mice were placed with HFD feeding for 7 weeks before LC-MS analysis (see Methods). P-values for (A) were calculated from two-way ANOVA with post hoc Sidak’s multiple comparisons test.

References

    1. Piercy KL, Troiano RP, Ballard RM, Carlson SA, Fulton JE, Galuska DA, George SM, and Olson RD (2018). The Physical Activity Guidelines for Americans. JAMA 320, 2020–2028. 10.1001/jama.2018.14854. - DOI - PMC - PubMed
    1. Warburton DER, and Bredin SSD (2017). Health benefits of physical activity: a systematic review of current systematic reviews. Curr Opin Cardiol 32, 541–556. 10.1097/HCO.0000000000000437. - DOI - PubMed
    1. Lear SA, Hu W, Rangarajan S, Gasevic D, Leong D, Iqbal R, Casanova A, Swaminathan S, Anjana RM, Kumar R, et al. (2017). The effect of physical activity on mortality and cardiovascular disease in 130 000 people from 17 high-income, middle-income, and low-income countries: the PURE study. Lancet 390, 2643–2654. 10.1016/S0140-6736(17)31634-3. - DOI - PubMed
    1. Booth FW, Roberts CK, Thyfault JP, Ruegsegger GN, and Toedebusch RG (2017). Role of Inactivity in Chronic Diseases: Evolutionary Insight and Pathophysiological Mechanisms. Physiol Rev 97, 1351–1402. 10.1152/physrev.00019.2016. - DOI - PMC - PubMed
    1. Knowler WC, Barrett-Connor E, Fowler SE, Hamman RF, Lachin JM, Walker EA, Nathan DM, and Group DPPR (2002). Reduction in the incidence of type 2 diabetes with lifestyle intervention or metformin. N Engl J Med 346, 393–403. 10.1056/NEJMoa012512. - DOI - PMC - PubMed

Publication types