. 2023 May-Jun;16(3):772-782.
doi: 10.1016/j.brs.2023.04.023. Epub 2023 May 2.

Towards optimizing single pulse electrical stimulation: High current intensity, short pulse width stimulation most effectively elicits evoked potentials

Affiliations

Towards optimizing single pulse electrical stimulation: High current intensity, short pulse width stimulation most effectively elicits evoked potentials

Mark A Hays et al. Brain Stimul. 2023 May-Jun.

Abstract

Background: While single pulse electrical stimulation (SPES) is increasingly used to study effective connectivity, the effects of varying stimulation parameters on the resulting cortico-cortical evoked potentials (CCEPs) have not been systematically explored.

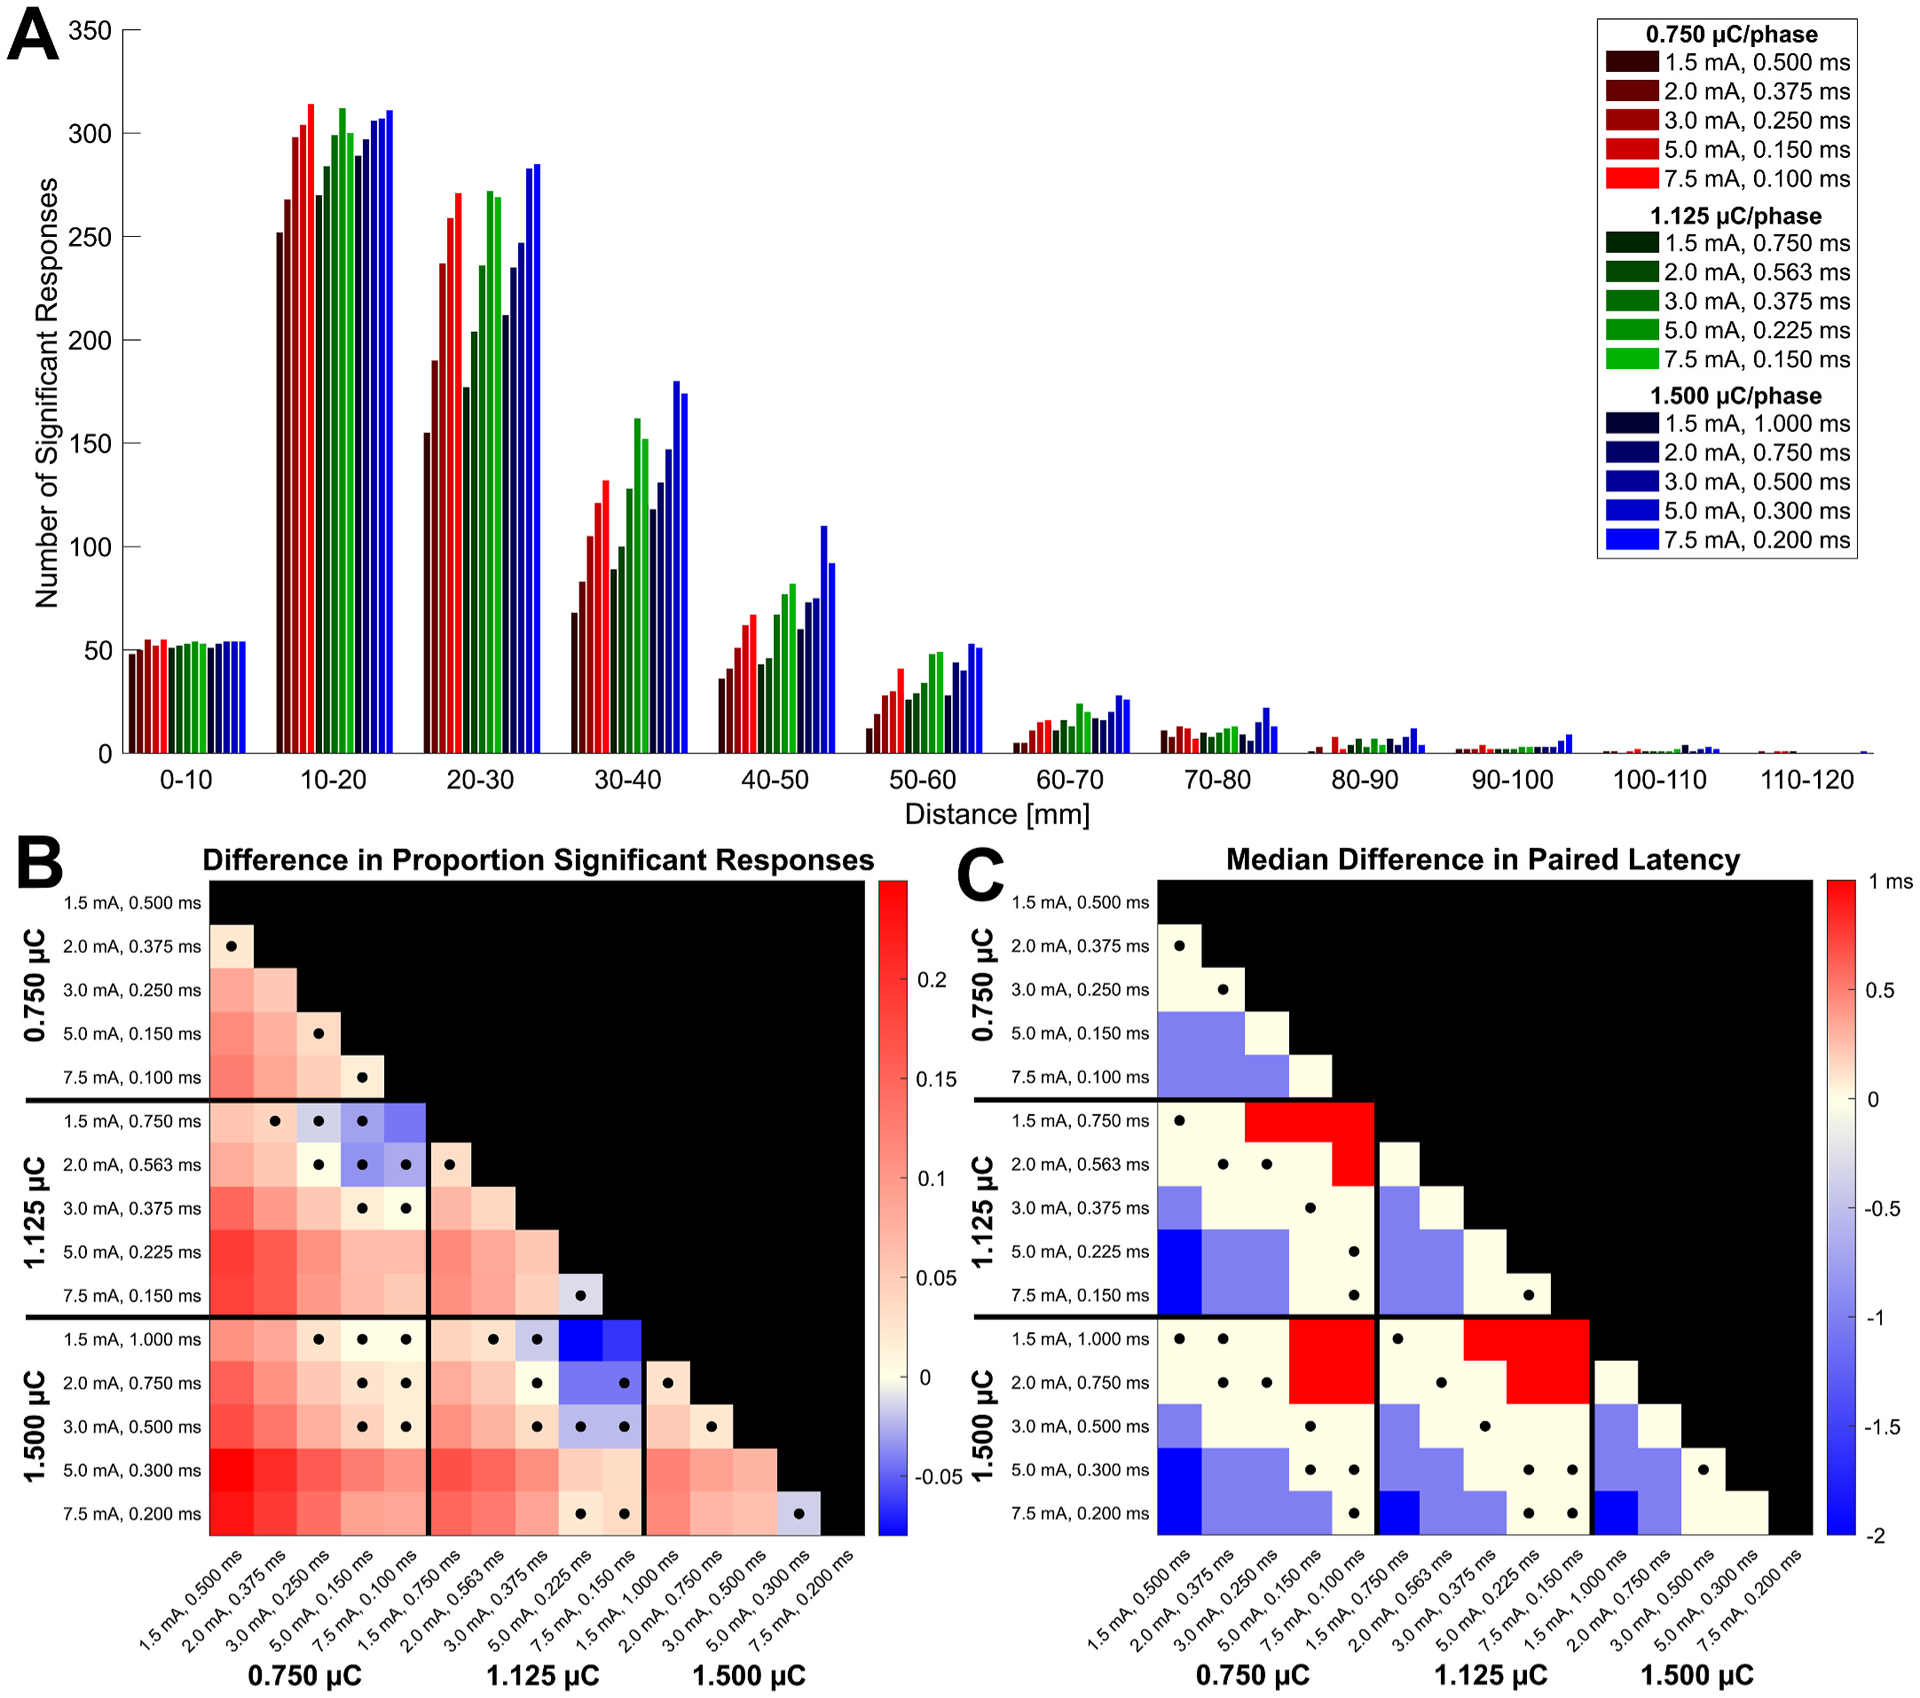
Objective: We sought to understand the interacting effects of stimulation pulse width, current intensity, and charge on CCEPs through an extensive testing of this parameter space and analysis of several response metrics.

Methods: We conducted SPES in 11 patients undergoing intracranial EEG monitoring using five combinations of current intensity (1.5, 2.0, 3.0, 5.0, and 7.5 mA) and pulse width at each of three charges (0.750, 1.125, and 1.500 μC/phase) to study how CCEP amplitude, distribution, latency, morphology, and stimulus artifact amplitude vary with each parameter.

Results: Stimulations with a greater charge or a greater current intensity and shorter pulse width at a given charge generally resulted in greater CCEP amplitudes and spatial distributions, shorter latencies, and increased waveform correlation. These effects interacted such that stimulations with the lowest charge and highest current intensities resulted in greater response amplitudes and spatial distributions than stimulations with the highest charge and lowest current intensities. Stimulus artifact amplitude increased with charge, but this could be mitigated by using shorter pulse widths.

Conclusions: Our results indicate that individual combinations of current intensity and pulse width, in addition to charge, are important determinants of CCEP magnitude, morphology, and spatial extent. Together, these findings suggest that high current intensity, short pulse width stimulations are optimal SPES settings for eliciting strong and consistent responses while minimizing charge.

Keywords: Cortico-cortical evoked potential; Effective connectivity; Intracranial EEG; Single pulse electrical stimulation.


Conflict of interest statement

Declaration of competing interest The authors declare that they have no known competing financial interests or personal relationships that could have appeared to influence the work reported in this paper.

Figures

Fig. 1.
Fig. 1.
Single pulse electrical stimulation (SPES) procedure. (A) SPES was applied using bipolar stimulation of adjacent electrodes with 40 biphasic pulses applied at 0.5 Hz. At each site, 15 blocks were conducted using five current intensities (1.5, 2.0, 3.0, 5.0, and 7.5 mA) and three varied pulse widths so that each block using the same current intensity had a different total charge (0.750, 1.125, 1.500 μC/phase). Individual current intensity and pulse width combinations are shown on the isocharge curves. (B) Trial-averaged evoked responses in each bipolar montage channel were computed to obtain cortico-cortical evoked potentials (CCEPs) in response to each stimulation site and each of the 15 stimulation parameter combinations. The amplitude and latency of the N1 potential was identified in each CCEP from 10 to 50 ms post-stimulus. (C) For each block, responses with an N1 potential greater than six standard deviations of the pre-stimulus baseline (−500 to −10 ms) were classified as significant. Response amplitude was additionally quantified by the root-mean-squared (RMS) of the signal from 10 to 100 ms, as a more general measure of the early response magnitude. (D) Example CCEPs recorded at the channel denoted with an asterisk in C in response to each of the stimulation parameter conditions tested.
Fig. 2.
Fig. 2.
Pairwise comparisons of response magnitude between varied current intensity and pulse width combinations. Boxplots of response amplitudes at each parameter combination are shown spatially grouped by current intensity in A and spatially grouped by charge in B. Wilcoxon signed-rank tests between pairwise comparisons within each current intensity and within each charge level were significant (P < 0.05, Bonferroni corrected) except where labeled non-significant (n.s.). The median differences in response amplitude across each stimulation-response pair for all possible pairwise comparisons of the 15 parameter combinations are shown in C. The value of each square represents the condition on the y-axis minus the condition on the x-axis, and the matrix is colored so that a greater value for the condition on the y-axis is colored red and a greater value for the condition on the x-axis is colored blue. The values are dimensionless since they quantify the difference in log-scaled voltages. Squares in C marked with a dot represent comparisons with non-significant differences (Wilcoxon signed-rank tests, P > 0.05, Bonferroni corrected). While stimulations with a greater charge generally resulted in a greater amplitude than those with a lower charge, stimulations with a greater charge but a lower current intensity (1.5–2.0 mA) sometimes resulted in lower magnitude responses compared to those from stimulations with a lower charge but a higher current intensity (5.0–7.5 mA). The Spearman’s correlation coefficient for the response amplitude between each combination of current intensity and pulse width is shown in D. The correlation generally increased with both the magnitude and the similarity of the current intensities and overall charges of the stimulation parameters being compared.
Fig. 3.
Fig. 3.
Comparisons of spatial distribution and latency of responses. The histogram in A shows the distributions of the distances of significant responses observed for each stimulation condition across all patients. The median differences in the proportion of responses that were significant across each stimulation for all possible pairwise comparisons of the 15 current intensity and pulse width combinations are shown in B. The median differences in N1 response latency across each stimulation-response pair for all possible pairwise comparisons of the 15 current intensity and pulse width combinations are shown in C. In both matrices, the value of each square represents the condition on the y-axis minus the condition on the x-axis, and the matrix is colored so that a greater value for the condition on the y-axis is colored red and a greater value for the condition on the x-axis is colored blue. Squares marked with a dot represent comparisons with non-significant Wilcoxon signed-rank tests (P > 0.05, Bonferroni corrected). Together, stimulations with a greater charge or current intensity generally resulted in a greater proportion of significant responses and shorter latencies, but stimulations with a high charge and the lowest current intensities sometimes had a lower proportion of significant responses and longer latencies compared to stimulations with a lower charge and highest current intensities.
Fig. 4.
Fig. 4.
Waveform Correlation. The Pearson’s correlation coefficient between the average response time series of the same stimulation-response pair in each combination of current intensity and pulse width was calculated, and the median coefficient across all stimulation-response pairs is shown in A for each pairwise comparison. The median correlation of all conditions that used the same current intensity and all conditions that used the same charge was calculated for each stimulation response pair, and the difference in the medians across all stimulation-response pairs between each constant current intensity and constant charge grouping is shown in B. Each square represents the condition on the y-axis minus the condition on the x-axis, and the matrix is colored so that a greater value for the condition on the y-axis is colored red and a greater value for the condition on the x-axis is colored blue. Example waveforms of the average times series of one stimulation-response pair in each stimulation condition are shown grouped by charge (C) and current intensity (D) to visualize the trends. Overall, waveform correlation increased with current intensity and charge, and above 3 mA the correlation between waveforms in response to the same current intensity but different pulse widths was greater than the correlation between waveforms in response to the same charge but different current intensities and pulse widths.
Fig. 5.
Fig. 5.
Pairwise Comparisons of Artifact Amplitude as a Measure of Focal Activation. Boxplots of stimulus artifact amplitudes at each current intensity and pulse width combination are shown spatially grouped by current intensity in A and spatially grouped by charge level in B. Wilcoxon signed-rank tests between pairwise comparisons within each current intensity and within each charge level were significant (P < 0.05, Bonferroni corrected) except where labeled non-significant (n.s.). The median differences in stimulus artifact amplitude across each stimulation-response pair for all possible pairwise comparisons of the 15 current intensity and pulse width combinations are shown in C. The value of each square represents the condition on the y-axis minus the condition on the x-axis, and the matrix is colored so that a greater value for the condition on the y-axis is colored red and a greater value for the condition on the x-axis is colored blue. The values are dimensionless since they quantify the difference in log-scaled voltages. Squares in C marked with a dot represent comparisons with non-significant Wilcoxon signed-rank tests (P > 0.05, Bonferroni corrected). Stimulations using a greater charge generally resulted in greater stimulus artifact amplitudes, and for a constant charge, stimulations with shorter pulse widths and higher current intensities resulted in lower artifact amplitudes.

References

    1. Friston KJ. Functional and effective connectivity: a review. Brain Connect 2011;1 (1):13–36. 10.1089/brain.2011.0008. - DOI - PubMed
    1. Yaffe RB, Borger P, Megevand P, Groppe DM, Kramer MA, Chu CJ, Santaniello S, Meisel C, Mehta AD, Sarma SV. Physiology of functional and effective networks in epilepsy. Clin Neurophysiol 2015;126(2):227–36. 10.1016/j.clinph.2014.09.009. - DOI - PubMed
    1. Matsumoto R, Kunieda T, Nair D. Single pulse electrical stimulation to probe functional and pathological connectivity in epilepsy. Seizure 2017;44:27–36. 10.1016/j.seizure.2016.11.003. - DOI - PMC - PubMed
    1. Matsumoto R, Nair DR, LaPresto E, Najm I, Bingaman W, Shibasaki H, et al. Functional connectivity in the human language system: a cortico-cortical evoked potential study. Brain 2004;127(10):2316–30. 10.1093/brain/awh246. - DOI - PubMed
    1. Keller CJ, Bickel S, Entz L, Ulbert I, Milham MP, Kelly C. Intrinsic functional architecture predicts electrically evoked responses in the human brain. Proc Natl Acad Sci USA 2011;108(25):10308–13. 10.1073/pnas.1019750108. - DOI - PMC - PubMed

Publication types