

Response of terminal Schwann cells following volumetric muscle loss injury
- PMID: 37142114
- PMCID: PMC10227691
- DOI: 10.1016/j.expneurol.2023.114431
Response of terminal Schwann cells following volumetric muscle loss injury
Abstract
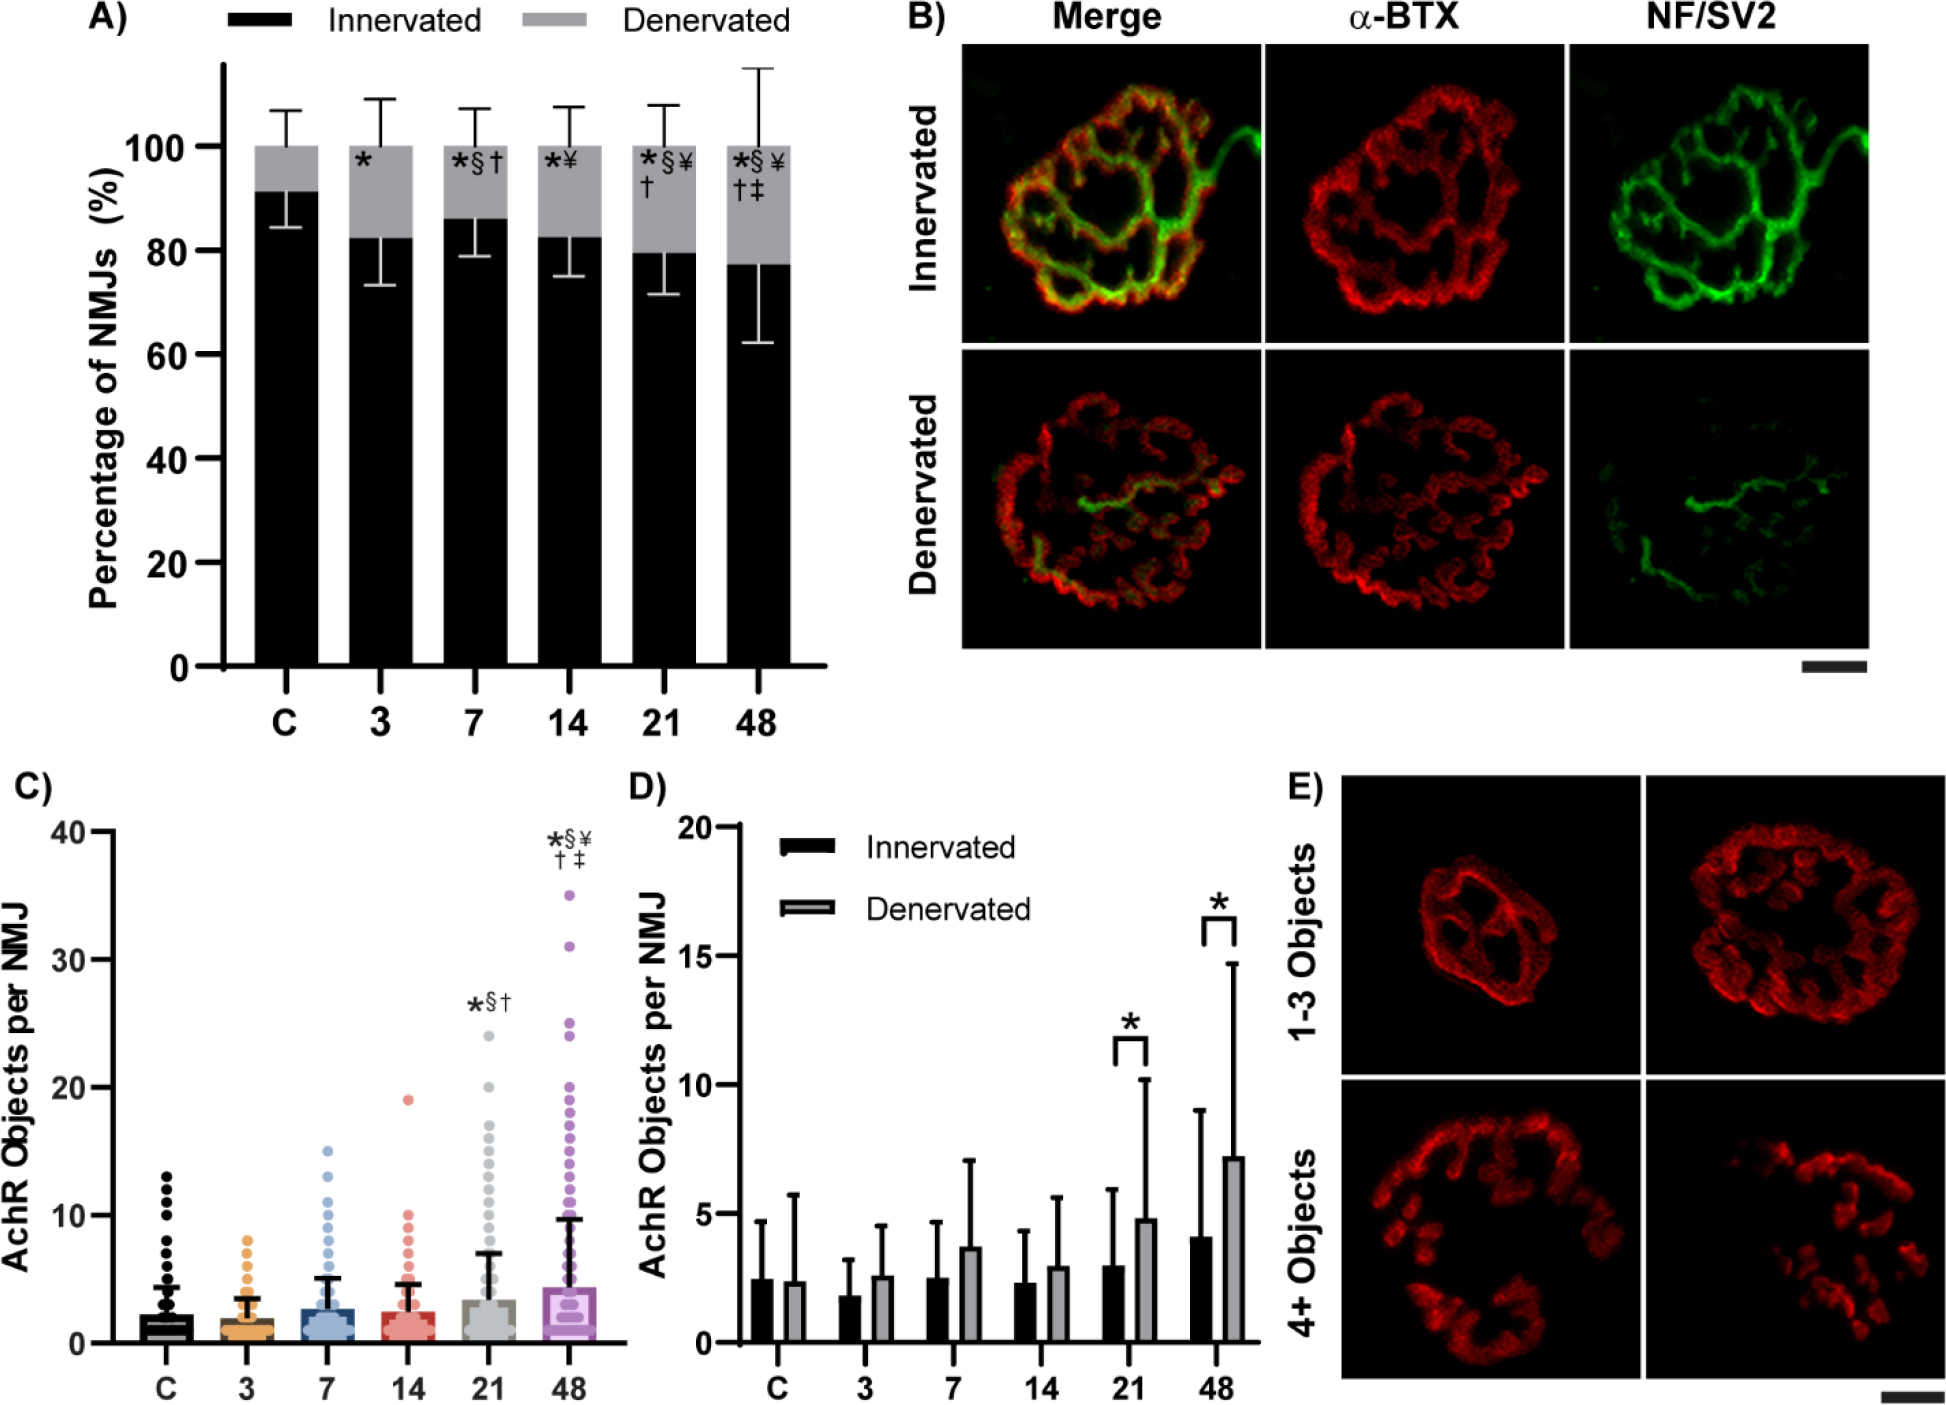
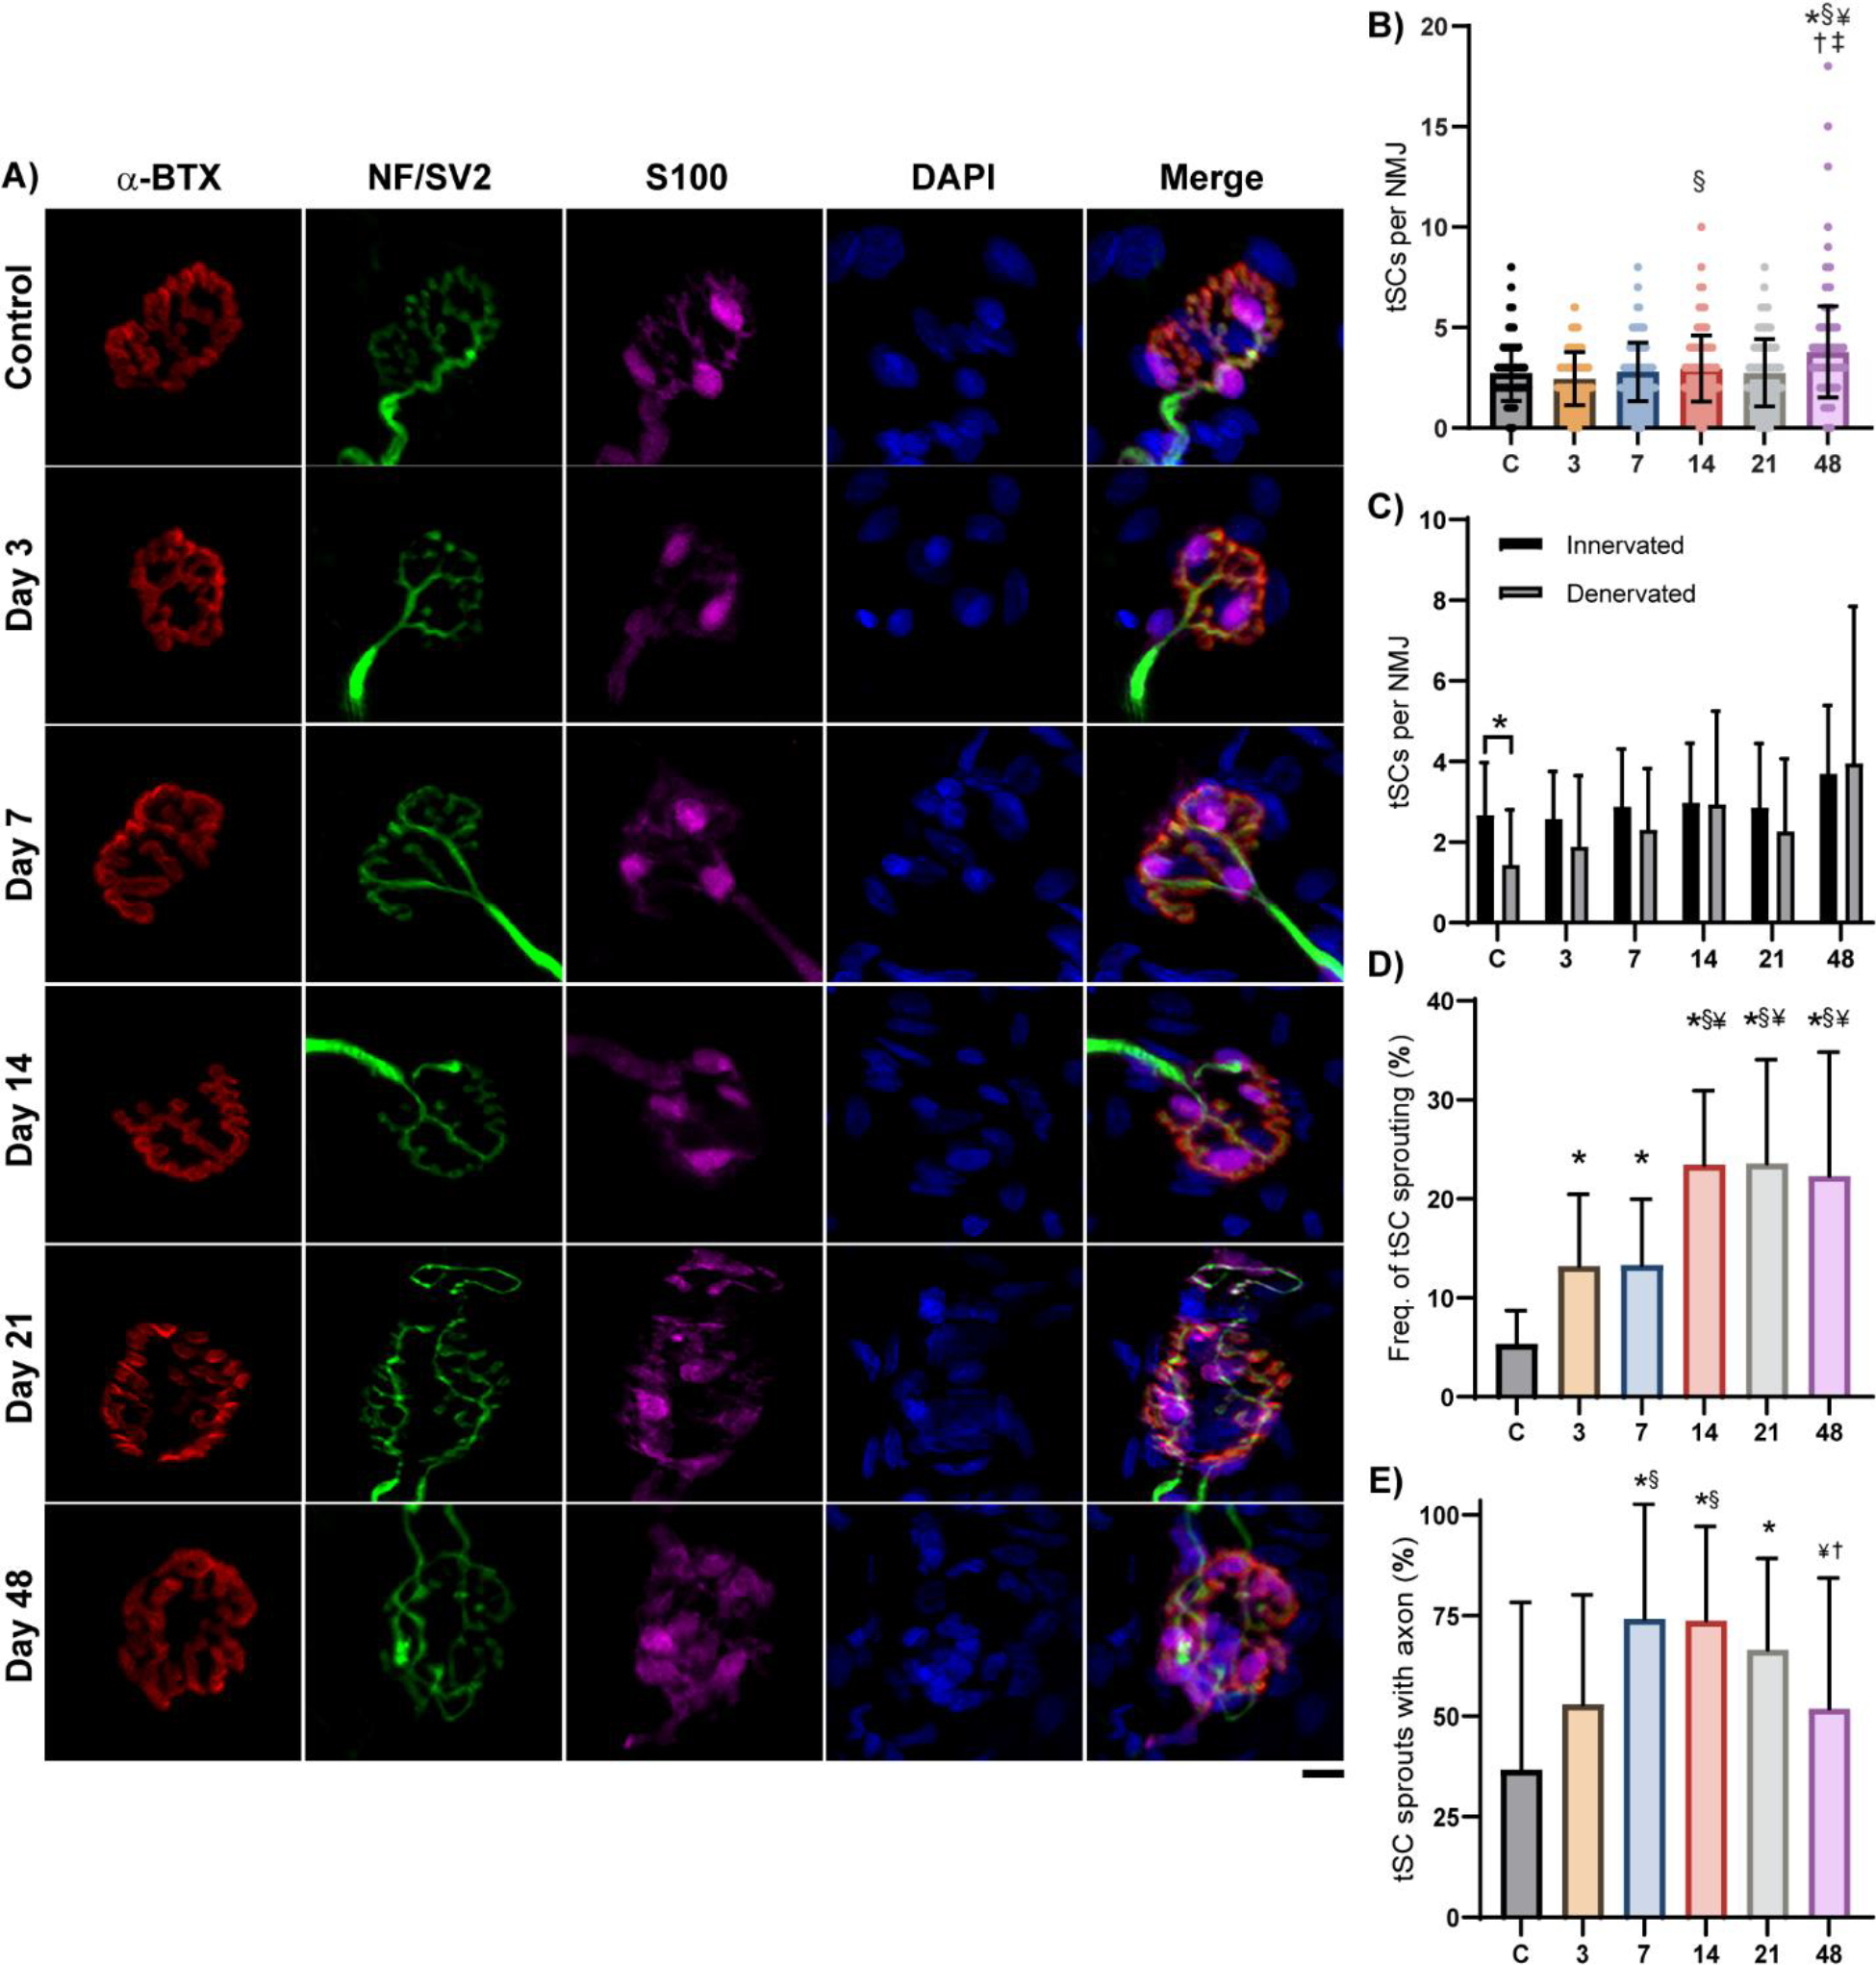
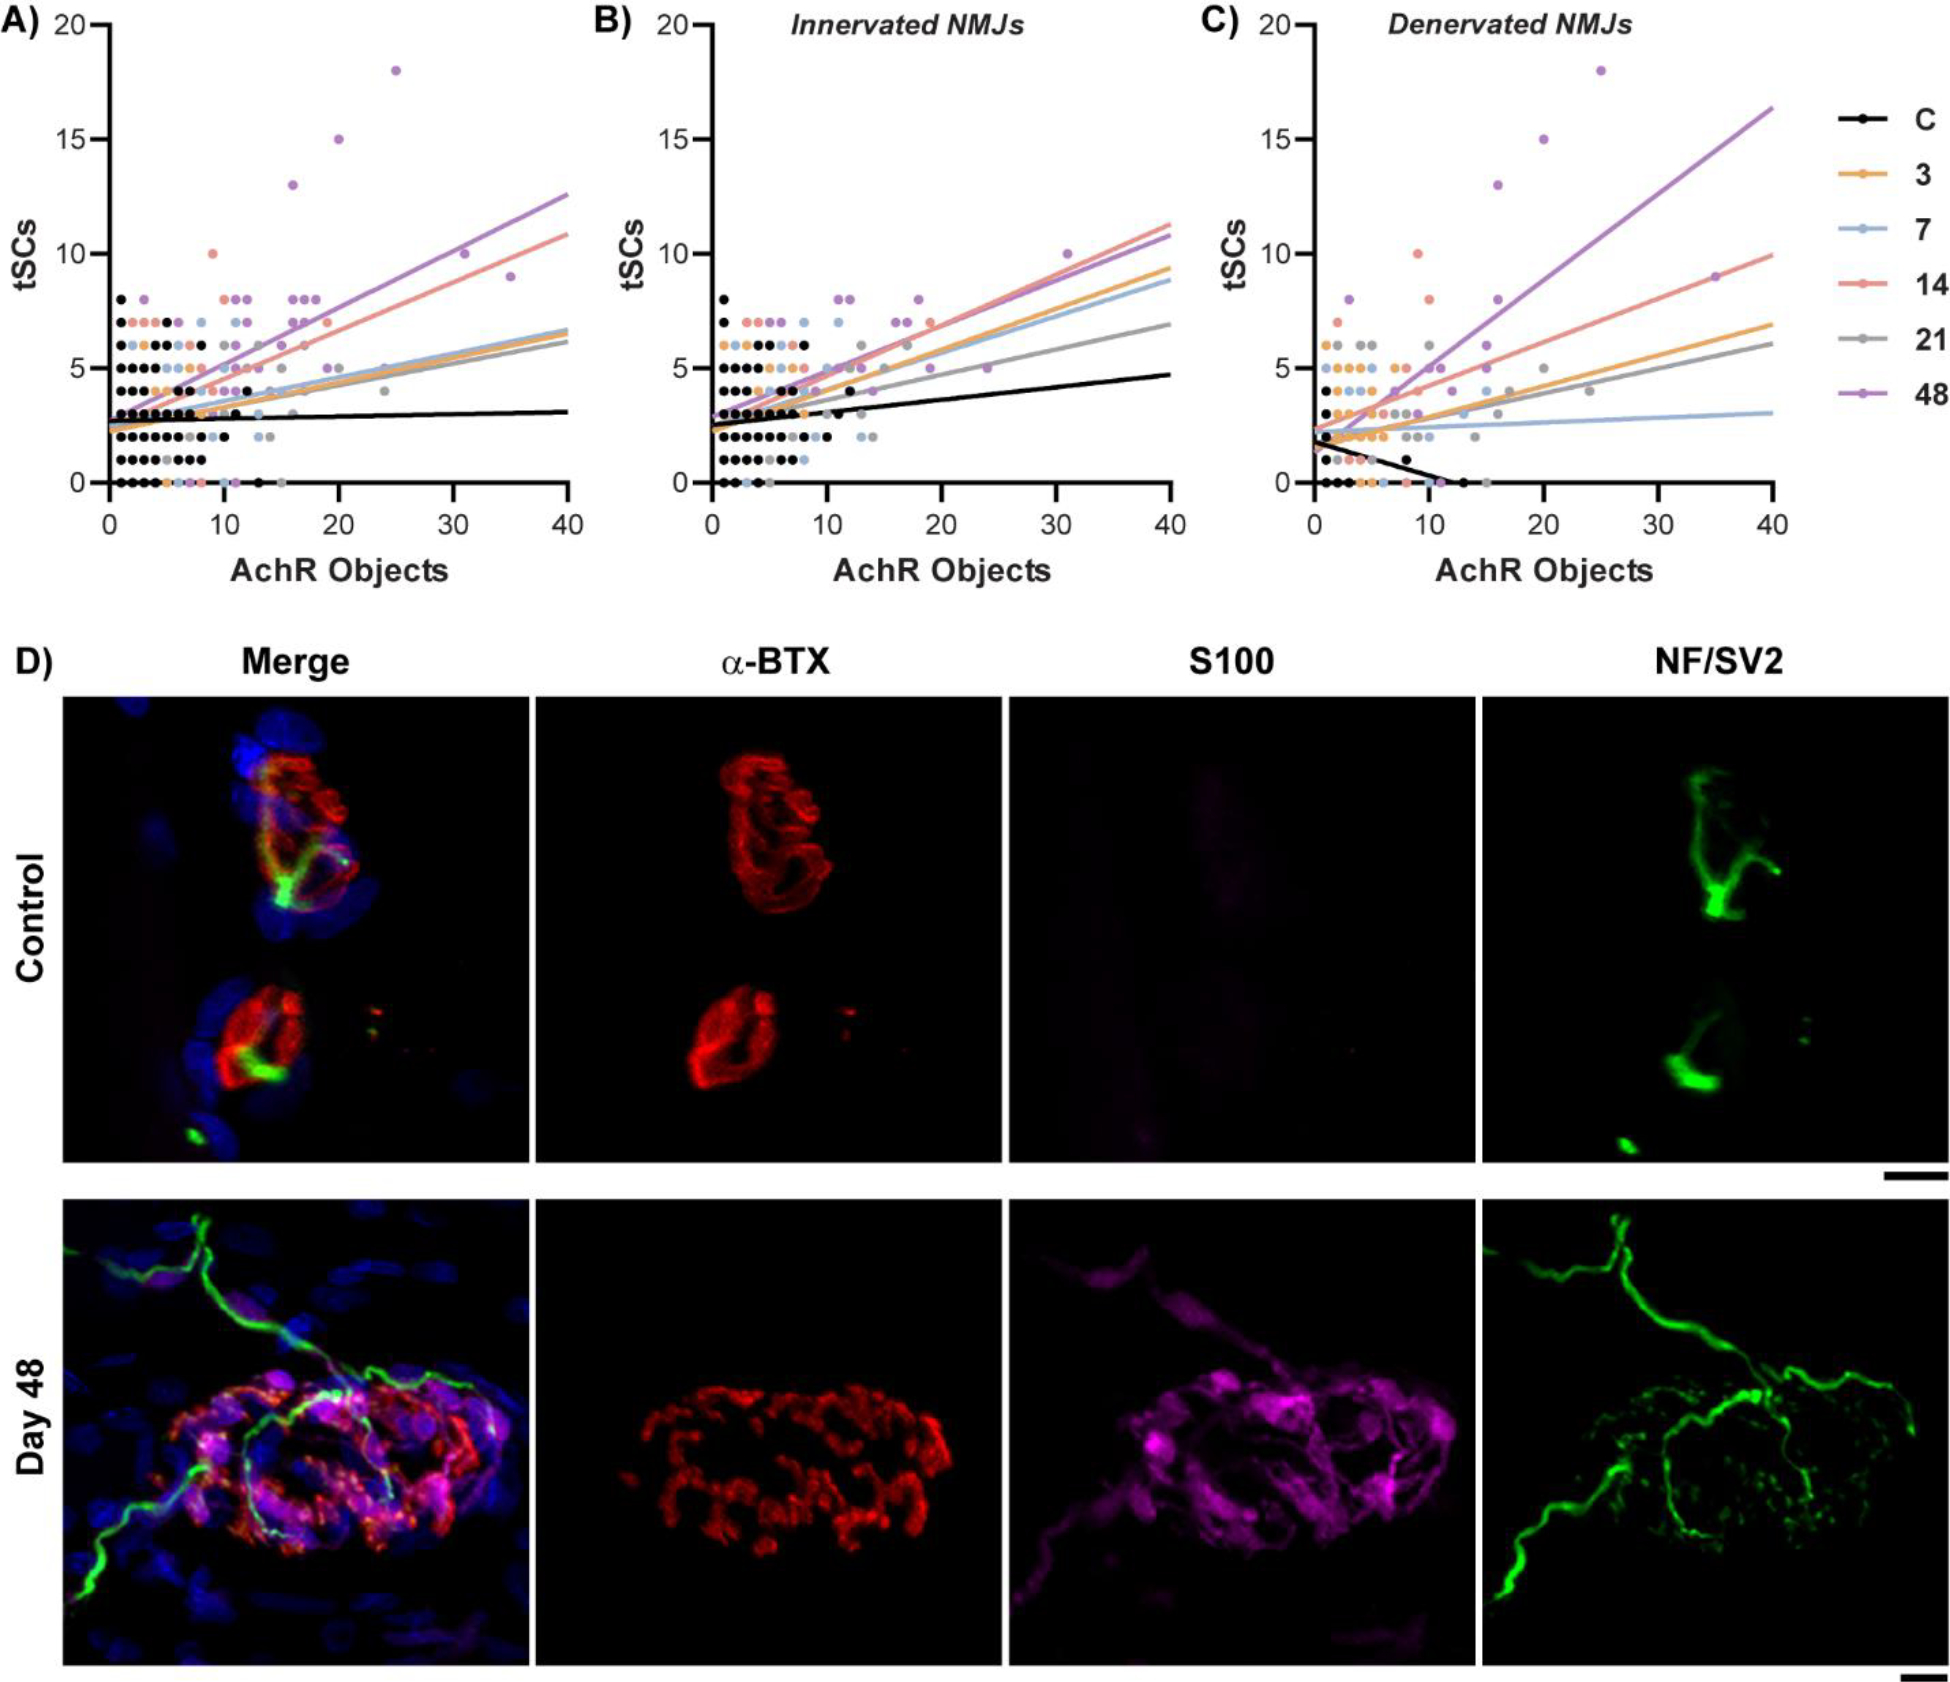
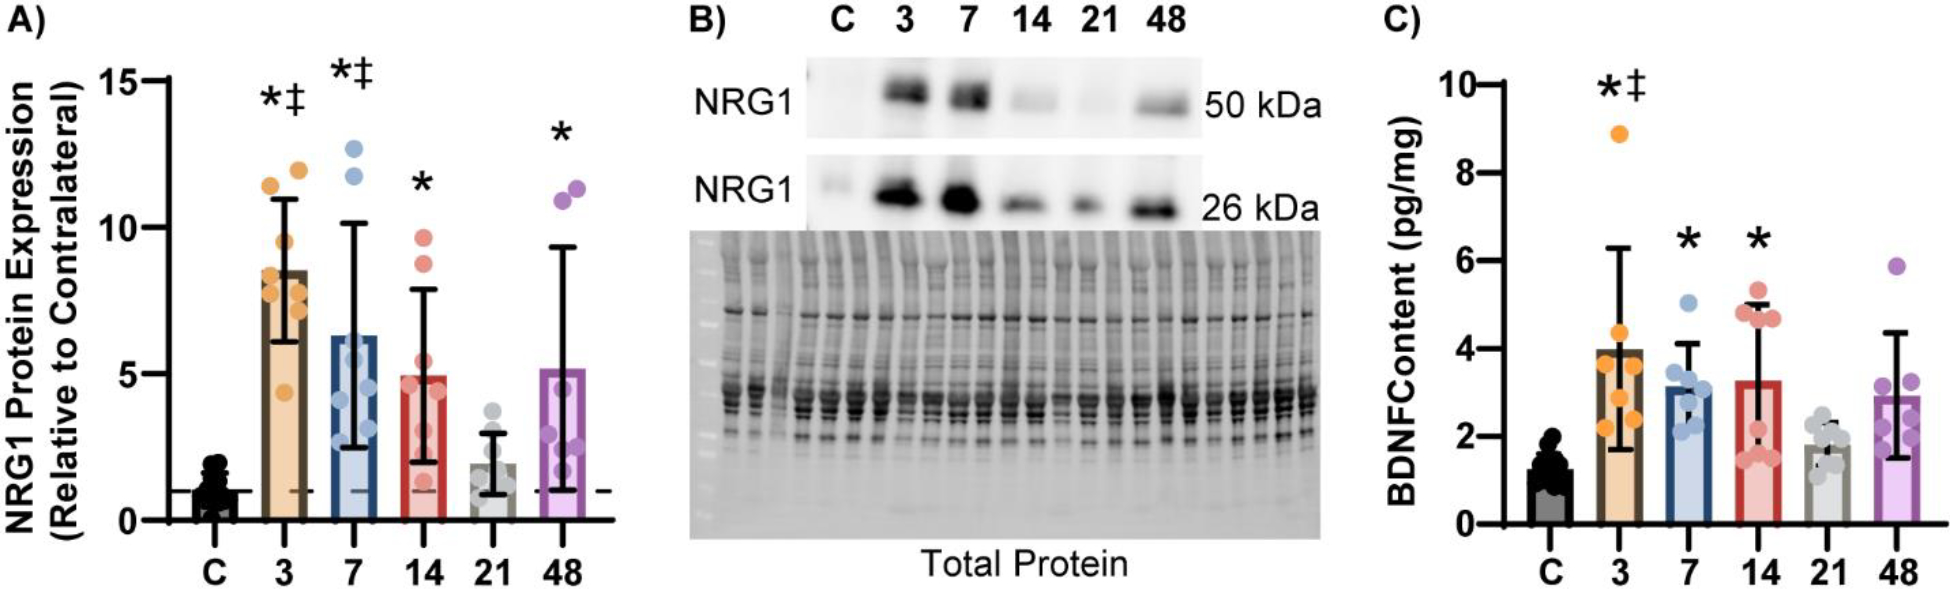
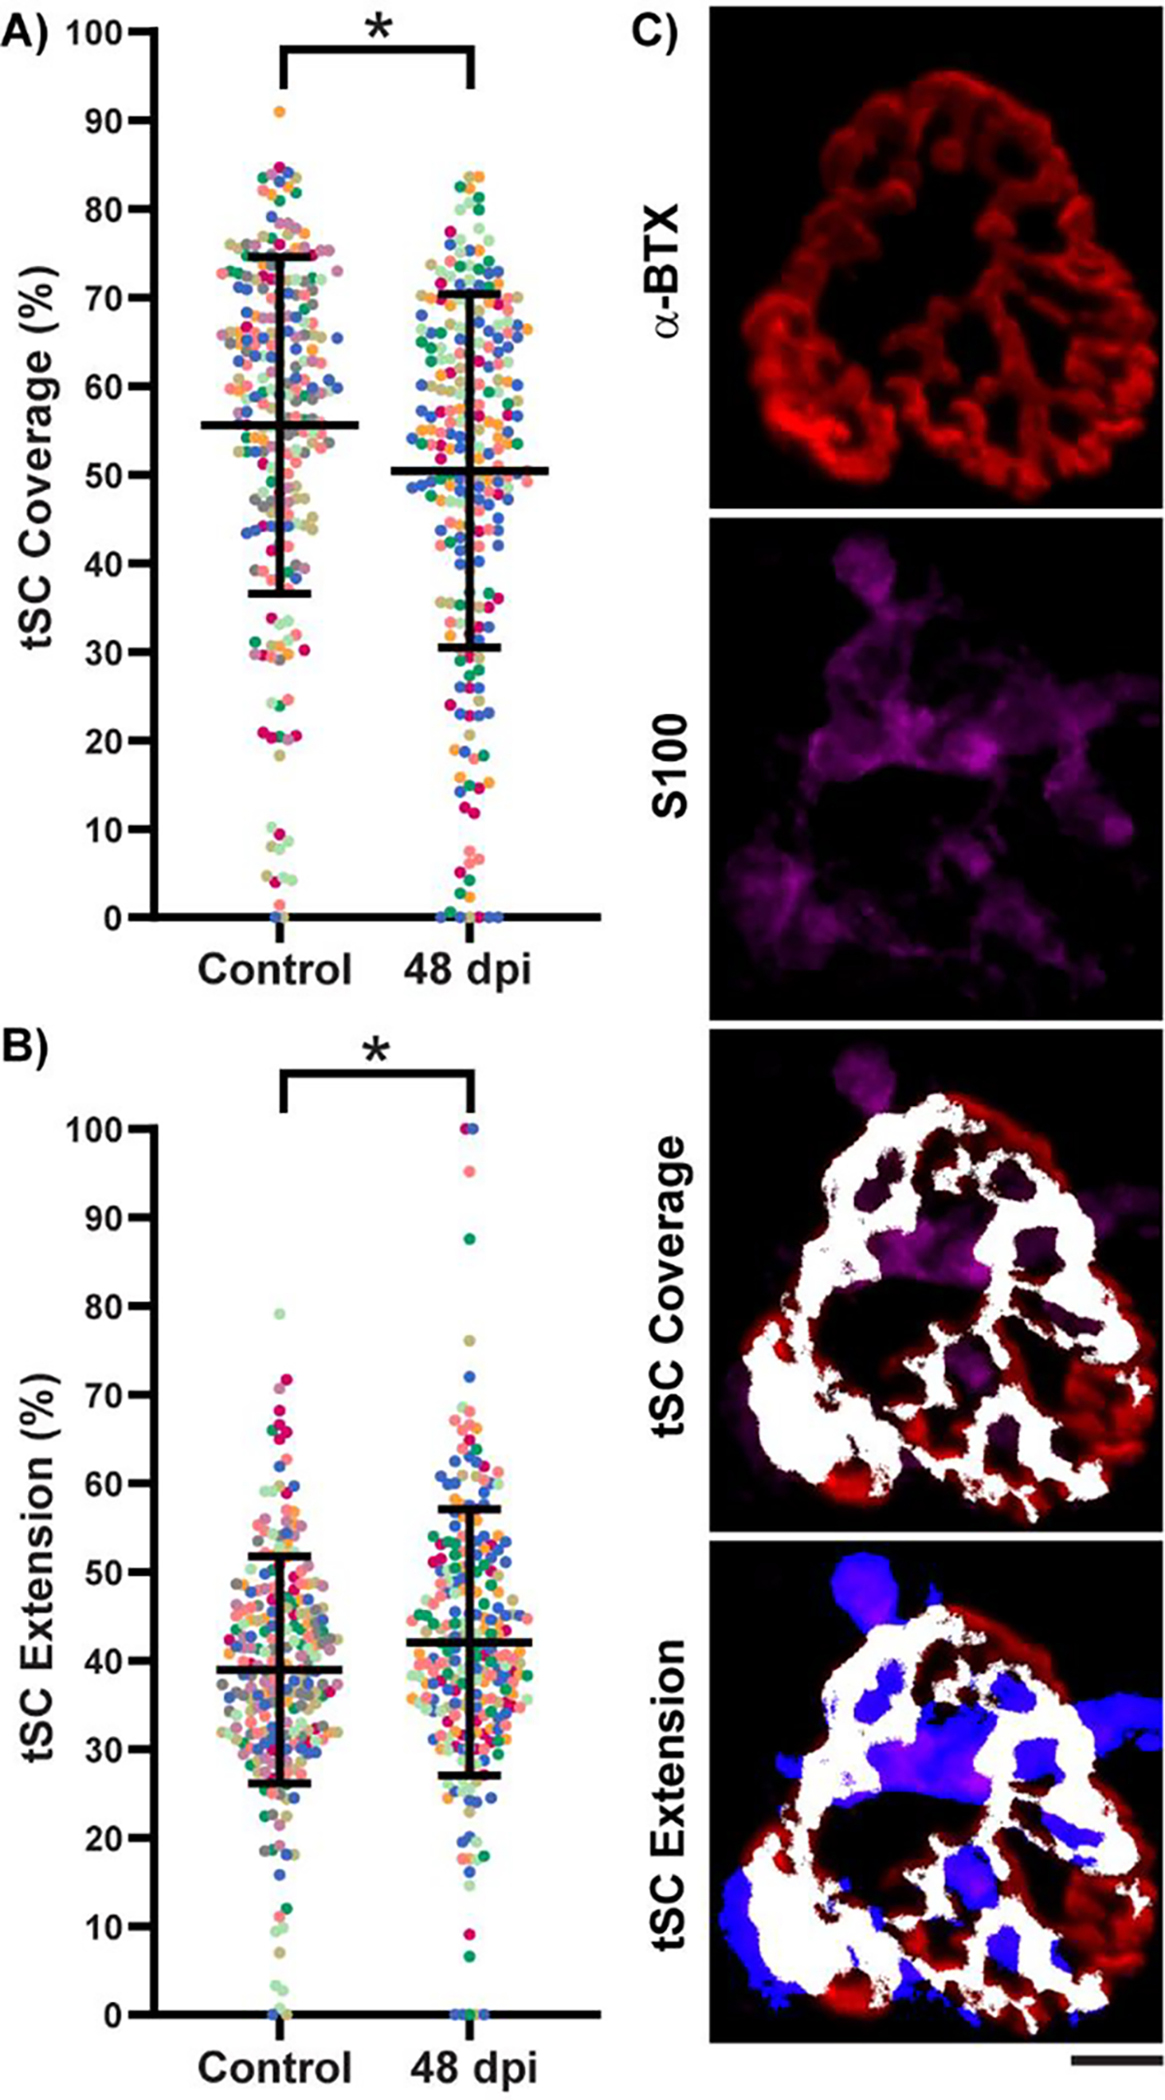
An often-overlooked component of traumatic skeletal muscle injuries is the impact on the nervous system and resultant innervation of the affected muscles. Recent work in a rodent model of volumetric muscle loss (VML) injury demonstrated a progressive, secondary loss of neuromuscular junction (NMJ) innervation, supporting a role of NMJ dysregulation in chronic functional deficits. Terminal Schwann cells (tSCs) are known to be vital for the maintenance of NMJ structure and function, in addition to guiding repair and regeneration after injury. However, the tSC response to a traumatic muscle injury such as VML is not known. Thus, a study was conducted to investigate the effect of VML on tSC morphological characteristics and neurotrophic signaling proteins in adult male Lewis rats that underwent VML injury to the tibialis anterior muscle using a temporal design with outcome assessments at 3, 7, 14, 21, and 48 days post-injury. The following salient observations were made; first, although there is a loss of innervation over time, the number of tSCs per NMJ increases, significantly so at 48 days post-injury compared to control. The degree of NMJ fragmentation was positively correlated with tSC number after injury. Moreover, neurotrophic factors such as NRG1 and BDNF are elevated after injury through at least 48 days. These results were unanticipated and in contrast to neurodegenerative disease models, in which there is a reduction in tSC number that precedes denervation. However, we found that while there are more tSCs per NMJ after injury, they cover a significantly smaller percent of the post-synaptic endplate area compared to control. These findings support a sustained increase in neurotrophic activity and tSC number after VML, which is a maladaptive response occurring in parallel to other aspects of the VML injury, such as over-accumulation of collagen and aberrant inflammatory signaling.
Keywords: Denervation; Musculoskeletal trauma; Neuromuscular junction; Neurotrophic factors.
Copyright © 2023 Elsevier Inc. All rights reserved.
Conflict of interest statement
Declaration of Competing Interest The authors declare that they have no competing interests.
Figures
Similar articles
-
Differential evaluation of neuromuscular injuries to understand re-innervation at the neuromuscular junction.Exp Neurol. 2024 Dec;382:114996. doi: 10.1016/j.expneurol.2024.114996. Epub 2024 Oct 10. Exp Neurol. 2024. PMID: 39393669
-
Secondary denervation is a chronic pathophysiologic sequela of volumetric muscle loss.J Appl Physiol (1985). 2021 May 1;130(5):1614-1625. doi: 10.1152/japplphysiol.00049.2021. Epub 2021 Apr 8. J Appl Physiol (1985). 2021. PMID: 33830817 Free PMC article.
-
Inhibition of ErbB2 mitigates secondary denervation after traumatic muscle injury.J Physiol. 2025 Mar 3. doi: 10.1113/JP287435. Online ahead of print. J Physiol. 2025. PMID: 40033740
-
Terminal Schwann Cell Aging: Implications for Age-Associated Neuromuscular Dysfunction.Aging Dis. 2021 Apr 1;12(2):494-514. doi: 10.14336/AD.2020.0708. eCollection 2021 Apr. Aging Dis. 2021. PMID: 33815879 Free PMC article. Review.
-
How to Build and to Protect the Neuromuscular Junction: The Role of the Glial Cell Line-Derived Neurotrophic Factor.Int J Mol Sci. 2020 Dec 24;22(1):136. doi: 10.3390/ijms22010136. Int J Mol Sci. 2020. PMID: 33374485 Free PMC article. Review.
Cited by
-
Inducible deletion of endothelial cell Efnb2 delays capillary regeneration and attenuates myofibre reinnervation following myotoxin injury in mice.J Physiol. 2024 Oct;602(19):4907-4927. doi: 10.1113/JP285402. Epub 2024 Aug 28. J Physiol. 2024. PMID: 39196901
-
Differential evaluation of neuromuscular injuries to understand re-innervation at the neuromuscular junction.Exp Neurol. 2024 Dec;382:114996. doi: 10.1016/j.expneurol.2024.114996. Epub 2024 Oct 10. Exp Neurol. 2024. PMID: 39393669
-
Limitations in metabolic plasticity after traumatic injury are only moderately exacerbated by physical activity restriction.NPJ Metab Health Dis. 2024;2:4. doi: 10.1038/s44324-024-00006-5. Epub 2024 Apr 6. NPJ Metab Health Dis. 2024. PMID: 39421399 Free PMC article.
-
Resistance wheel running improves contractile strength, but not metabolic capacity, in a murine model of volumetric muscle loss injury.Exp Physiol. 2023 Oct;108(10):1282-1294. doi: 10.1113/EP091284. Epub 2023 Aug 10. Exp Physiol. 2023. PMID: 37526646 Free PMC article.
-
Cell-scale porosity minimizes foreign body reaction and promotes innervated myofiber formation after volumetric muscle loss.NPJ Regen Med. 2025 Mar 1;10(1):12. doi: 10.1038/s41536-025-00395-1. NPJ Regen Med. 2025. PMID: 40025057 Free PMC article.
References
-
- Robitaille R Modulation of Synaptic Efficacy and Synaptic Depression by Glial Cells at the Frog Neuromuscular Junction. Neuron. 1998;21:847–855. - PubMed
Publication types
MeSH terms
Grants and funding
LinkOut - more resources
Full Text Sources
Medical
