. 2023 Jul 1:522:42-56.
doi: 10.1016/j.neuroscience.2023.04.020. Epub 2023 May 2.

Progressive Dysregulation of Tau Phosphorylation in an Animal Model of Temporal Lobe Epilepsy

Affiliations

Progressive Dysregulation of Tau Phosphorylation in an Animal Model of Temporal Lobe Epilepsy

F A Concepcion et al. Neuroscience. .

Abstract

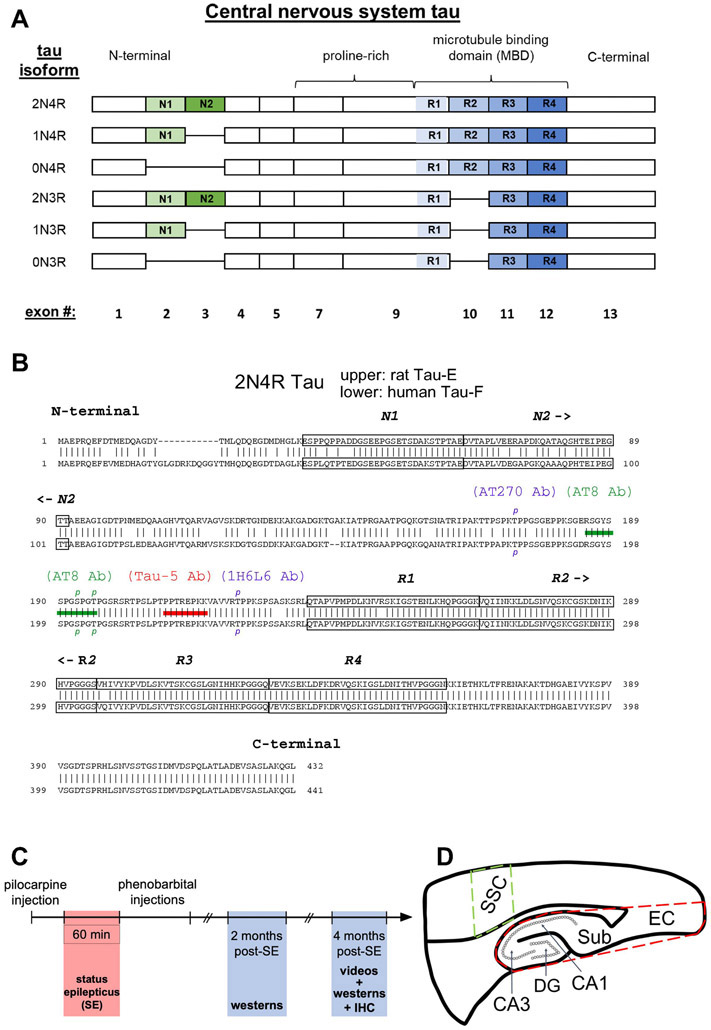
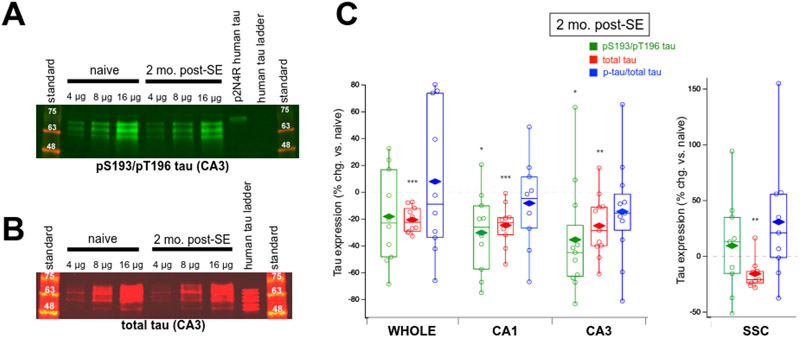
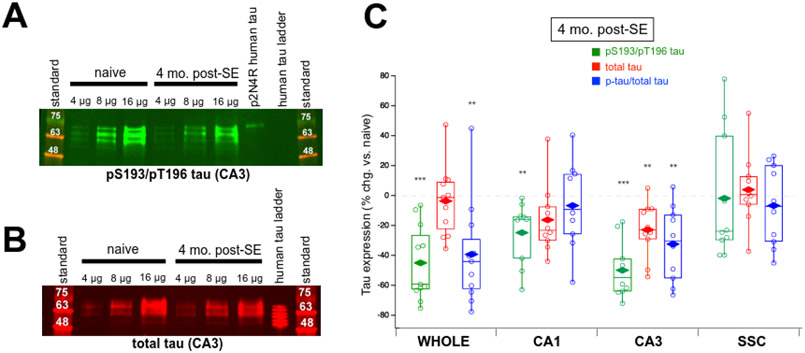
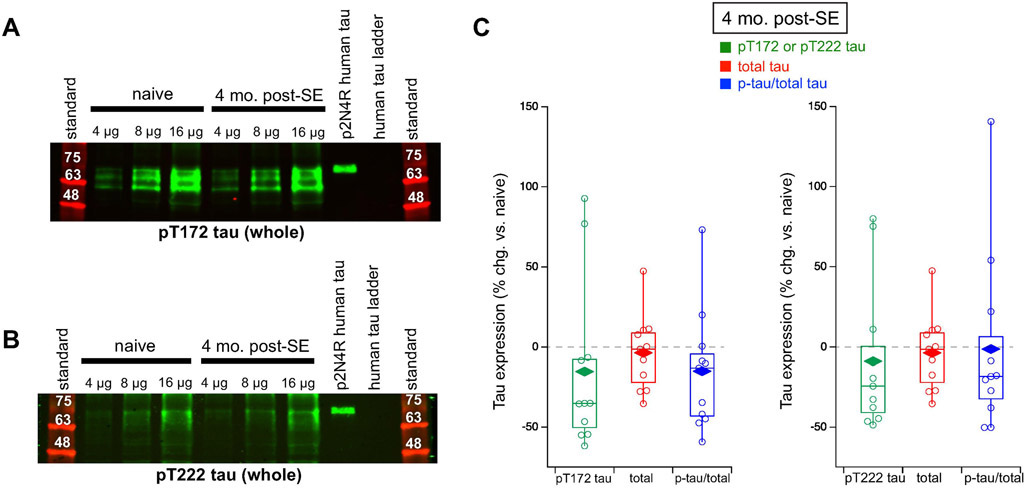
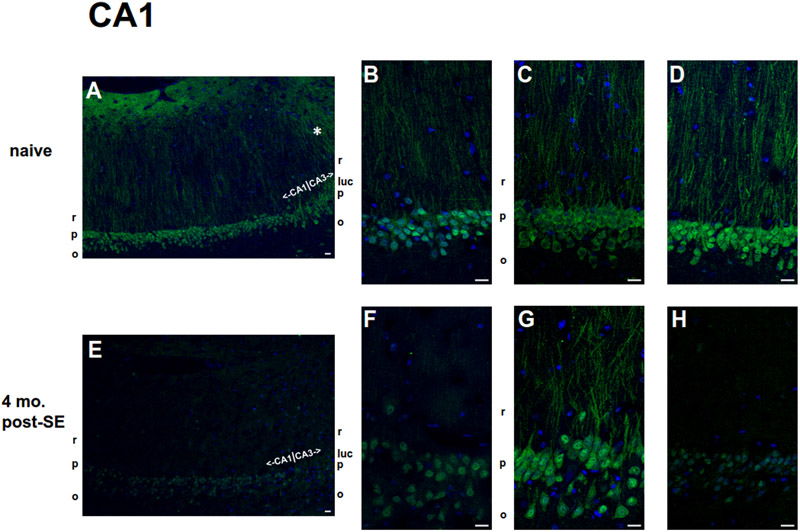
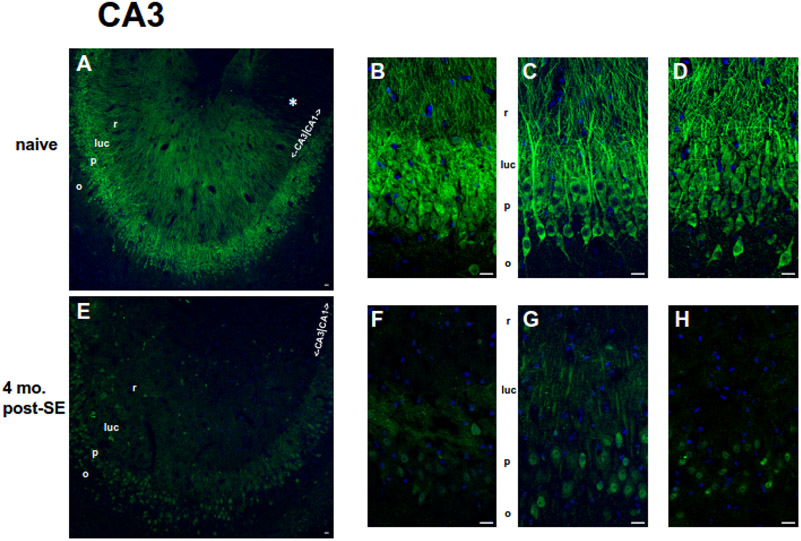
Tau is an intracellular protein known to undergo hyperphosphorylation and subsequent neuro-toxic aggregation in Alzheimer's disease (AD). Here, tau expression and phosphorylation at three canonical loci known to be hyperphosphorylated in AD (S202/T205, T181, and T231) were studied in the rat pilocarpine status epilepticus (SE) model of temporal lobe epilepsy (TLE). We measured tau expression at two time points of chronic epilepsy: two months and four months post-SE. Both time points parallel human TLE of at least several years. In the whole hippocampal formation at two months post-SE, we observed modestly reduced total tau levels compared to naïve controls, but no significant reduction in S202/T205 phosphorylation levels. In the whole hippocampal formation from four month post-SE rats, total tau expression had reverted to normal, but there was a significant reduction in S202/T205 tau phosphorylation levels that was also seen in CA1 and CA3. No change in phosphorylation was seen at the T181 and T231 tau loci. In somatosensory cortex, outside of the seizure onset zone, no changes in tau expression or phosphorylation were seen at the later time point. We conclude that total tau expression and phosphorylation in an animal model of TLE do not show hyperphosphorylation at the three AD canonical tau loci. Instead, the S202/T205 locus showed progressive dephosphorylation. This suggests that changes in tau expression may play a different role in epilepsy than in AD. Further study is needed to understand how these changes in tau may impact neuronal excitability in chronic epilepsy.

Keywords: epilepsy; hippocampus; phosphorylation; pilocarpine; tau.


Figures

Figure 1.
Figure 1.
Tau isoform composition. (A) Schematics of the six tau isoforms formed by alternative splicing of N-terminal exons (N1, N2, green-shaded) and of repeat domains (R1-R4, blue-shaded) within the microtubule binding region (MBD). The presence of none, one, or two N-terminal exons determines 0N, 1N, 2N tau isoform specificity, correspondingly; while the absence or presence of the R2 domain within the MBD generates 3R or 4R tau isoforms, respectively. Labeling at bottom is the exon number of the human microtubule associated protein tau gene, MAPT, that encodes for the corresponding domain above. Exons 6 and 8 are not expressed in the central nervous system. (B) Comparison of 2N4R tau amino acid sequences between rat (upper) and human (lower) showing 89% homology between the two species. Tau naming for each species found in Uniprot.org. The two N-terminal exons and four repeat domains are boxed within the sequences. Shown are epitopes for anti-tau antibodies (Abs) Tau-5 Ab (red bar) and AT8 Ab (green bar). To be recognized by the AT8 Ab, both S193 and T196 rat tau residues (S202 and T205 in humans) must be phosphorylated, denoted by green p’s. Additionally, two other phosphorylated tau residues, T172 rat/T181 human recognized by the AT270 Ab and T222 rat/T231 human recognized by the 1H6L6 Ab, are labelled as blue p’s. (C) Timeline of experiments involving the pilocarpine-induced rat model of chronic epilepsy. (D) Schematic of brain regions studied. Whole hippocampal formation encompassing CA1 and CA3 hippocampus, dentate gyrus (DG), subiculum (Sub), and entorhinal cortex (EC) is enclosed within the dashed red border. A region within the somatosensory cortex (SSC, dashed green boundary) served as control tissue outside the putative seizure onset zone within the hippocampus.
Figure 2.
Figure 2.
Expression of tau isoforms in hippocampal tissue. A ladder containing six human tau isoforms (h. tau ladder) allows for size comparison and serves as a negative control for phosphorylation. (A) 4R and 3R tau expression in raw tissue homogenate either without (1X homog.) or with phosphatase treatment [(+) pptase] from six week-old naïve rats. In the raw homogenate lanes of the top panel displaying 4R tau isoforms, tau proteins migrate between 50 to 72 kDa. Consolidation of these isoforms into three protein bands in phosphatase-treated homogenates indicate 4R tau isoforms are highly phosphorylated. In the raw homogenate lanes displaying 3R tau (middle panel), a doublet around 50 kDa converged into the lower band after phosphatase treatment. The bottom panel is a merged image showing four main tau isoforms. The yellow arrows in the three panels demonstrate that the upper doublet band in the merged panel consists of 0N3R tau and 0N4R tau. (B) 4R and 3R tau expression in 12-15 week-old naïve rats. Tau expression is similar as above, except for notably decreased expression of both 0N3R and 0N4R isoforms in the older rats. (C) AT8 Ab staining of dually phosphorylated S193/T196 tau in brain homogenates from 12-15 week old rats. Three tau bands are observed. Phosphorylated 2N4R human tau (h. p2N4R) served as a positive control for detection of dually phosphorylated S193/T196 tau. (D) Total tau staining of rat brain homogenates with the Tau-5 Ab. Four bands of staining are observed in raw homogenates. Phosphatase treatment consolidates staining to three bands. (E) Complete overlapping (merged) of bands composed of 4R tau (4R tau, green) and total tau (total tau, red) demonstrates that total tau staining reflects 4R tau expression in brain homogenates of 12-15 week-old rats.
Figure 3.
Figure 3.
Dual pS193/pT196 tau and total tau expression in brain tissue of two month post-SE rats. (A) Representative western blot of phosphorylated tau expression in CA3 hippocampal region using the AT8 Ab showing a decrease in phosphorylated tau expression in chronic epilepsy. Shown are three different loading amounts for naïve and epileptic conditions. Phosphorylated p2N4R human tau and human tau ladder served as positive and negative controls, respectively, for the detection of phosphorylated tau. (B) Representative western blot of total tau expression in rat CA3 hippocampus using the Tau-5 Ab demonstrating a modest reduction in total tau expression in chronic epilepsy. The human tau ladder provided a size reference. (C) Group data showing changes in tau expression in chronically epileptic rats at two months post-SE in the whole hippocampal formation, CA1 hippocampus, CA3 hippocampus, and somatosensory cortex (SSC) compared to age-matched naïve rats. Values shown are individual data points; boxes denoting median, 75th and 25th percentiles; whiskers showing 95th and 5th percentiles; and mean value (diamonds). Only the CA1 and CA3 hippocampal regions of chronically epileptic rats showed significantly reduced dual pS193/pT196 tau (green box plots). Reductions in total tau expression were found in every region, including the SSC (red box plots). No changes were observed in fractional dually phosphorylated tau (pS193/pT196 tau/total tau) in any region (blue box plots).
Figure 4.
Figure 4.
Dual pS193/pT196 tau and total tau expression in brain tissue of four month post-SE rats. (A) Representative western blot showing greatly decreased dual pS193/pT196 tau expression in CA3 hippocampus in chronic epilepsy using the AT8 Ab. (B) Representative western blot demonstrating a modest reduction in total tau expression in CA3 hippocampal regions using the Tau-5 Ab in chronic epilepsy. (C) Group data showing changes in tau expression in chronically epileptic rats at four months post-SE in the whole hippocampal formation, CA1 hippocampus, CA3 hippocampus, and somatosensory cortex (SSC) compared to age-matched naïve rats. Values shown are individual data points; boxes denoting median, 75th and 25th percentiles; whiskers showing 95th and 5th percentiles; and mean value (diamonds). Significant decreases in dual pS193/pT196 tau were observed in all hippocampal regions in epilepsy (green box plots). The only change in total tau expression was the decrease observed in the CA3 hippocampus (red box plots). Reductions in fractional pS193/pT196 tau expression (pS193/pT196 tau/total tau) were detected in the whole hippocampal formation and in the CA3 hippocampus (blue box plots). No change in tau expression was seen in the SSC.
Figure 5.
Figure 5.
pT172tau, pT222 tau, total tau expression, and fractional phosphorylated tau in whole hippocampal formation from four month post-SE rats. (A) Representative western blot showing unchanged pT172 tau expression in the whole hippocampal formation in chronic epilepsy using the AT270 Ab. (B) Representative western blot showing unchanged pT222 expression in the whole hippocampal formation in chronic epilepsy using the 1H6L6 Ab. (C) Group data showing no changes in either pT172 tau expression (left) or pT222 tau expression (right) in chronically epileptic rats. Data for total tau expression is the same as total tau expression in whole hippocampal formation used in Figure 4.
Figure 6.
Figure 6.
Localization of pS193/pT196 tau protein in the hippocampal CA1 region within age-matched naïve (A-D) and chronic 4 mo. post-SE (E-H) rats by AT8 Ab staining. pS193/pT196 tau staining is shown in green, and nuclear staining by 4′,6-diamidino-2-phenylindole (DAPI) is shown in blue. Scale bars = 20 μm. (A-D) The lower magnification image (A) represents a larger scale view of pS193/pT196 tau staining within the CA1 hippocampus of naïve rats. The boundary between CA1 and CA3 hippocampal subregions is demarcated. Note the qualitative increased dendritic staining within the CA3 hippocampus (*) compared to that within the CA1 hippocampus at the transition. pS193/pT196 tau staining examples from three different naïve rats of a magnified view within the CA1 subregion are displayed in (B-D). The most abundant expression of pS193/pT196 tau was observed in the CA1 somata within the stratum pyramidale (p) layer; some staining was present in the dendrites in the stratum radiatum layer (r), while little to no staining was observed in the axons within the stratum oriens (o). (E-F) The lower magnification image (E) represents a larger scale view of pS193/pT196 tau staining within the CA1 hippocampus of 4 mo. post-SE of chronically epileptic rats with the boundary between the CA1 and CA3 hippocampal subregions labelled. pS193/pT196 tau staining examples from three different chronically epileptic rats of a magnified view within the CA1 subregion are displayed in (F-H). The distribution of pS193/pT196 tau within the CA1 hippocampus in chronically epileptic rats was similar to that in age-matched naïve rats: the greatest expression was observed within the stratum pyramidale (p) layer; lesser extent in the stratum radiatum layer (r), while little to no staining within the stratum oriens (o). Overall, pS193/pT196 tau staining in the CA1 hippocampal subregion of chronically epileptic rats qualitatively was less than that of naïve rats.
Figure 7.
Figure 7.
Localization of pS193/pT196 tau protein in the hippocampal CA3 region within age-matched naïve (A-D) and chronic 4 mo. post-SE (E-H) rats by AT8 Ab staining. pS193/pT196 tau staining is shown in green, and DAPI is shown in blue. Scale bars = 20 μm. (A-D) The lower magnification image (A) represents a larger scale view of pS193/pT196 tau staining within the CA3 hippocampus of naïve rats. The boundary between CA1 and CA3 hippocampal subregions is included. Note the qualitative decreased dendritic staining within the CA1 hippocampus (*) compared to that within the CA3 hippocampus at the transition. pS193/pT196 tau staining examples from three different naïve rats of a magnified view within the CA3 subregion are displayed in (B-D). The most abundant region of dually phosphorylated S193/T196 tau expression was observed in the axons of mossy fibers within the stratum lucidum layer (luc) and in the cell bodies within the stratum pyramidale (p) layer. Less staining was observed in the dendrites originating from the stratum radiatum layer (r). Like the CA1 hippocampus, pS193/pT196 tau staining was lowest in the axons within the stratum oriens (o) layer. (E-F) The lower magnification image (E) represents a larger scale view of pS193/pT196 tau staining within the CA3 hippocampus of chronically epileptic rats. The boundary between the CA1 and CA3 hippocampal subregions is noted. pS193/pT196 tau staining examples from three different chronic rats of a magnified view within the CA3 subregion are displayed in (F-H). The distribution of pS193/pT196 tau within the CA3 hippocampus in chronically epileptic rats was similar to that in age-matched naïve rats: the greatest expression was observed in the stratum lucidum layer (luc) and within the stratum pyramidale (p) layer; lesser extent in the stratum radiatum layer (r), while little to no staining within the stratum oriens (o). Overall, pS193/pT196 tau staining qualitatively was reduced throughout the CA3 hippocampal subregion in chronically epileptic rats compared to that in naïve rats.

References

    1. Alves M, Kenny A, de Leo G, Beamer EH, & Engel T (2019). Tau Phosphorylation in a Mouse Model of Temporal Lobe Epilepsy. Front Aging Neurosci, 11, 308. doi: 10.3389/fnagi.2019.00308 - DOI - PMC - PubMed
    1. Aroor A, Nguyen P, Li Y, Das R, Lugo JN, and Brewster AL. Assessment of tau phosphorylation and β-amyloid pathology in human drug-resistant epilepsy. Epilepsia Open, in press. - PMC - PubMed
    1. Bertrand J, Plouffe V, Sénéchal P, & Leclerc N (2010). The pattern of human tau phosphorylation is the result of priming and feedback events in primary hippocampal neurons. Neuroscience, 168(2), 323–334. doi: 10.1016/j.neuroscience.2010.04.009 - DOI - PubMed
    1. Braak H, & Braak E (1991). Neuropathological stageing of Alzheimer-related changes. Acta Neuropathol, 82(4), 239–259. doi: 10.1007/BF00308809 - DOI - PubMed
    1. Buckmaster PS, Reyes B, Kahn T, & Wyeth M (2022). Ventral hippocampal formation is the primary epileptogenic zone in a rat model of temporal lobe epilepsy. J Neurosci, 42(39), 7482–7495. doi: 10.1523/JNEUROSCI.0429-22.2022 - DOI - PMC - PubMed

Publication types