. 2023 Nov;143(11):2177-2192.e13.
doi: 10.1016/j.jid.2023.02.040. Epub 2023 May 2.

Single-Cell and Spatial Transcriptomic Analysis of Human Skin Delineates Intercellular Communication and Pathogenic Cells

Affiliations

Single-Cell and Spatial Transcriptomic Analysis of Human Skin Delineates Intercellular Communication and Pathogenic Cells

Kim Thrane et al. J Invest Dermatol. 2023 Nov.

Abstract

Epidermal homeostasis is governed by a balance between keratinocyte proliferation and differentiation with contributions from cell-cell interactions, but conserved or divergent mechanisms governing this equilibrium across species and how an imbalance contributes to skin disease are largely undefined. To address these questions, human skin single-cell RNA sequencing and spatial transcriptomics data were integrated and compared with mouse skin data. Human skin cell-type annotation was improved using matched spatial transcriptomics data, highlighting the importance of spatial context in cell-type identity, and spatial transcriptomics refined cellular communication inference. In cross-species analyses, we identified a human spinous keratinocyte subpopulation that exhibited proliferative capacity and a heavy metal processing signature, which was absent in mouse and may account for species differences in epidermal thickness. This human subpopulation was expanded in psoriasis and zinc-deficiency dermatitis, attesting to disease relevance and suggesting a paradigm of subpopulation dysfunction as a hallmark of the disease. To assess additional potential subpopulation drivers of skin diseases, we performed cell-of-origin enrichment analysis within genodermatoses, nominating pathogenic cell subpopulations and their communication pathways, which highlighted multiple potential therapeutic targets. This integrated dataset is encompassed in a publicly available web resource to aid mechanistic and translational studies of normal and diseased skin.


Conflict of interest statement

Conflict of Interest

K.T. is a scientific consultant for 10X Genomics, Inc. M.C.G.W is co-founder of PSOMRI Holding AB, PHAMRI NORDEN AB. J.L. is a scientific consultant for 10X Genomics, Inc.

Figures

Figure 1.
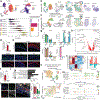
Figure 1.. Single-Cell and Spatial Transcriptomics of Adult Human Skin
(a) Top left, schematic of anatomic sites of samples within four scRNA-seq published datasets encompassing 24 donors (Cheng et al., 2018 [JC]; Ji et al., 2020 [AJ]; Tabib et al., 2018 [TT]; Takahashi et al., 2020 [RT]). Top right, uniform manifold approximation and projection (UMAP) of 80,344 cells labeled by dataset. Bottom, UMAP with cells from each dataset highlighted. (b) UMAP of all cells from (a) labeled by clusters and inferred cell types after integration with spatial data. (c) UMAP feature plots of select known marker genes for specific cell types. (d) Representative hematoxylin and eosin staining (left) with ST clustering of spots (right). Spatial clusters are annotated by most represented cell types within each compartment. Scale bar=500μm. (e) Spatial clusters associated with epithelial compartments with spatial marker gene expression shown in spatial feature plots. (f) Seurat predictions for human scRNA-seq clusters on ST data. Spatial feature plots demonstrate prediction values for clusters shown in UMAP in (b), which inform final cell type annotations labeled in (b). (g) UMAP feature plot of KRT77 (top), which is selectively expressed in eccrine duct cells in IHC staining from Human Protein Atlas (bottom). Scale bar = 100μm.
Figure 2.
Figure 2.. Comparison of Human and Mouse Skin Subpopulations
(a) UMAPs of isolated epithelial cells of human (top) and mouse (bottom) pilosebaceous unit (PSU) cells labeled by cluster/subpopulation (left) and donor/sample (right, encompassing all four datasets). INF = infundibulum, IST = isthmus, OB = outer bulge, HG = hair germ, ORS = outer root sheath, IRS = inner root sheath, HS = hair shaft, B = basal, SB = suprabasal, SG = sebaceous gland, GL = germinative layer, CX = cortex, MED = medulla, CP = companion layer, LPC = lower proximal cup, LD = lateral disc. (b) Dot plot of overlapping subpopulation markers of human and mouse PSU. (c) Integration prediction scores of PSU and mesenchymal scRNA-seq clusters in ST data from donor P10 (Methods). DS = dermal sheath. EC = epithelial cluster. Scale bar = 200μm. (d) Human (blue text labels)-mouse (red text labels) clustered correlation matrix of overlapping PSU gene markers determined by differential expression (Supplementary Table 4, Methods). (e) UMAPs of isolated mesenchymal cells of human (top) and mouse (bottom) labeled by cluster/subpopulation (left) and donor/sample (right). (f) Dot plot of overlapping subpopulation markers of human and mouse PSU. (g) Same as (d) but for mesenchymal subpopulation markers. (h) UMAPs of isolated interfollicular epidermis (IFE) cells of human (top) and mouse (bottom) labeled by cluster/subpopulation (left) and donor/sample (right). (i) Dot plot of overlapping subpopulation markers of human and mouse PSU. (j) Same as (d) but for IFE subpopulation markers.
Figure 3.
Figure 3.. Ligand-Receptor Crosstalk Within Human Skin Compartments
(a) Left, heatmap of scRNA-seq average log fold-change (logFC) of ligands grouped by signaling family across IFE and mesenchymal cells. Bottom, heatmap of scRNA-seq average logFC of ligand-matched receptors expressed by IFE and mesenchymal. Middle, heatmap of significant ligand-receptor pairs between at least one IFE or mesenchymal cell type pair in scRNA-seq. *indicates spatial transcriptomics L-R co-expression P value < 0.05 in at least one donor. P value was determined by a permutation test (Methods). (b) Diagram of selected cell types in IFE and top predicted ligands signaling from and to labeled cell types. (c) Same as (a), but with PSU epithelial and mesenchymal cells. (d) Same as (b), but with top ligands predicted to signal from select PSU epithelial or mesenchymal cells. Average logFCs in heatmaps from (d) and (f) were calculated using Seurat.
Figure 4.
Figure 4.. Human vs. Mouse Interfollicular Epidermis Subpopulation Proliferation and Differentiation Dynamics
(a) Top, UMAP feature plot of pseudotime values for human and mouse IFE cells. Bottom, violin plots of human and mouse pseudotime values by IFE layer (left) and bar plots of median pseudotime difference between human and mouse pseudotime values in each layer (right). (b) UMAPs of re-clustered human IFE cycling cells labeled by sample, cell cycle phase, and expression of COL17A1 (basal) and KRT10 (spinous) after cell cycle phase regression. (c) Same as (b) but for mouse cycling IFE cells. (d) Bar plots of proportion of cycling cells that are assigned to spinous layer in human and mouse IFE. ****p-value < 0.0001 by unpaired t-test, two-tailed. (e) Top, representative immunofluorescence (IF) staining of healthy human skin. Bottom, representative IF of mouse skin across anatomic sites. Scale bar = 20μm. (f) Quantification of suprabasal Ki-67+ cells in human vs. mouse. Data shown are mean ± S.E.M., N = 4 human samples from four human patients, N = 4 mouse samples from two independent mice, **p < 0.01 by unpaired t-test, two-tailed. (g) Bar plots of cell cycle phase proportion per subpopulation. ****adjusted p-value < 0.0001, paired two-way ANOVA test followed by Tukey multiple comparisons test. (h) Volcano plot of differentially expressed genes between Spinous II vs. all other spinous cells. (i) Select gene ontology (GO) terms for upregulated (n = 44) and downregulated (n = 97) genes in Spinous II cells. (j) Left, representative immunofluorescence (IF) staining of healthy human skin. Red arrows: double Ki-67+/MT1G+ suprabasal cells. Green arrow: double Ki-67+/MT1G+ basal cell. Scale bar = 20μm. Right, quantification of suprabasal and basal single Ki-67+ or double Ki-67+/MT1G+ cells. Data shown are mean ± S.E.M., N = 4 donors, *p < 0.05 by one-tailed paired t-test. (k) UMAPs of joint scRNA-seq and scATAC-seq profiling of 6,108 IFE cells from two human donors with predicted cluster labels using AJ cohort as reference. Cluster 2 (Spinous II) predictions are highlighted in red in each top right UMAP. Multi-ome data re-analyzed from Solé-Boldo et al, 2022. (l) Left, clustered heatmap of differentially accessible chromatin peaks (n = 13,553) across the main predicted clusters (basal, spinous, and granular clusters). Right, bar plots showing number of significantly increased or decreased peaks in each cluster (p < 0.005) (m) Gene tracks for KRT5 and KRT10 showing differences in accessibility in gene promoter, gene body, and cis-regulatory elements across clusters. Corresponding RNA expression of each cluster is shown in violin plots at right.
Figure 5.
Figure 5.. Cycling Spinous Cells are Expanded in Inflammatory Skin Diseases
(a) Top row, integrated UMAPs of healthy and psoriasis human IFE cells (left) labeled by Seurat clusters, cell cycle phase scoring, and feature plots for marker gene expression. Bottom row, isolation and re-clustering of cycling IFE cells into basal (cluster 1) and spinous (cluster 0) clusters, as well as cell cycle phase scoring and marker gene feature plots. Data re-analyzed from Cheng et al., 2018. (b) Quantification for human scRNA-seq proportion analysis of healthy and psoriasis cycling basal and spinous cells. *p < 0.05, **p < 0.01, ****p < 0.0001, one-way ANOVA with Tukey’s multiple comparison test. (c) Top, representative image of immunofluorescence staining from psoriasis patient skin. Scale bar = 20μm. Bottom, quantification of MT1G+/Ki-67+ double-positive cells in basal (B) and suprabasal (SB) layers of healthy and psoriasis human skin samples. Data shown are mean ± S.E.M., n = 5 healthy donors, n = 2 psoriasis patients. *p<0.05, **p < 0.01, ****p < 0.0001, one-way ANOVA with Tukey’s multiple comparison test. (d) Top row, integrated UMAPs of healthy and imiquimod (IMQ)-treated mouse IFE cells (left) labeled by Seurat clusters, cell cycle phase scoring, and feature plots for marker gene expression. Bottom row, isolation and re-clustering of cycling IFE cells into basal (cluster 0) and spinous (cluster 1) clusters, as well as cell cycle phase scoring and marker gene feature plots. Data re-analyzed from Zhu et al., 2022. (e) Quantification for mouse scRNA-seq proportion analysis of healthy and IMQ cycling basal and spinous cells. *p < 0.05, **p < 0.01, ****p < 0.0001, one-way ANOVA with Tukey’s multiple comparison test. (f) Left, representative H&E staining of human site-matched healthy (top) and zinc-deficiency dermatitis (bottom) skin. Right, quantification of suprabasal:basal MT1G staining. Data shown are mean ± S.E.M., n = 5 healthy donors, n = 5 zinc-deficiency dermatitis patients. *p-value < 0.05 by unpaired t-test with Welch’s correction. Scale bar = 50μm. (g) Left, representative H&E staining of human healthy (top) and zinc-deficiency dermatitis (bottom) skin. Red arrows: Ki-67+ mid-spinous cells. Scale bar = 50μm. Right, quantification of suprabasal Ki-67+ staining. Data shown are mean ± S.E.M., N = 5 healthy donors, N = 5 zinc-deficiency dermatitis patients, *p-value < 0.05 by unpaired t-test with Welch’s correction.
Figure 6.
Figure 6.. Candidate Cell Type Origins in Human Skin Disease
(a) Dot plot summarizing categorized disease-associated gene expression across cell types of the skin demonstrating cell type specificity across disease categories (Supplementary Table 6; Methods). Mel_Neoplasm = melanocytic neoplasm, Epi_Neoplasm = epithelial neoplasm, DP = dermal papilla, DS = dermal sheath, INF = infundibulum, IST = isthmus, HF = hair follicle, CP = companion layer, IRS = inner root sheath, HS = hair shaft, SG = sebaceous gland, LC = Langerhans cell, Grn = granular layer. (b) Heatmap of expression of genes associated with non-epithelial neoplastic disorders across cell types (c) Heatmap of normalized expression of genes across mesenchymal cell types for markers used in diagnosis of dermatofibroma (DF) and dermatofibrosarcoma tuberans (DFSP) (left), and atypical fibroxanthoma (AFX) (right). (d) Heatmap of expression genes associated with inflammatory disorders across cell types with disease. (e) Circos plot of top ligands from granular layer cells predicted to interact with skin immune cells. Size of arrows is proportional to average expression of ligand and receptors in cell type pairs.

References

    1. Andersson A, Bergenstråhle J, Asp M, Bergenstråhle L, Jurek A, Fernández Navarro J, et al. Single-cell and spatial transcriptomics enables probabilistic inference of cell type topography. Commun. Biol. Springer US; 2020;3(1):1–8 Available from: 10.1038/s42003-020-01247-y - DOI - PMC - PubMed
    1. Ascensión AM, Fuertes-Álvarez S, Ibañez-Solé O, Izeta A, Araúzo-Bravo MJ. Human Dermal Fibroblast Subpopulations Are Conserved across Single-Cell RNA Sequencing Studies. J. Invest. Dermatol. 2021;141(7):1735–1744.e35 - PubMed
    1. Bandarchi B, Ma L, Marginean C, Hafezi S, Zubovits J, Rasty G. D2–40, a novel immunohistochemical marker in differentiating dermatofibroma from dermatofibrosarcoma protuberans. Mod. Pathol. Nature Publishing Group; 2010;23(3):434–8 - PubMed
    1. Blanpain C, Fuchs E. Epidermal homeostasis: a balancing act of stem cells in the skin. Nat. Rev. Mol. Cell Biol. 2009;10(3):207–17 Available from: http://www.nature.com/doifinder/10.1038/nrm2636 - DOI - PMC - PubMed
    1. Brocard A, Knol AC, Khammari A, Dréno B. Hidradenitis suppurativa and zinc: A new therapeutic approach - A pilot study. Dermatology. 2007;214(4):325–7 - PubMed

Publication types

LinkOut - more resources