Area-based comparison of risk factors and testing rates to improve sexual health care access: cross-sectional population-based study in a Dutch multicultural area
- PMID: 37142318
- PMCID: PMC10163550
- DOI: 10.1136/bmjopen-2022-069000
Area-based comparison of risk factors and testing rates to improve sexual health care access: cross-sectional population-based study in a Dutch multicultural area
Abstract
Objectives: Areas with high sexually transmitted infection (STI) testing rates may not require additional strategies to improve testing. However, it may be necessary to intervene in areas with elevated STI risk, but with low STI testing rates. We aimed to compare STI-related risk profiles and STI testing rates by geographical area to determine areas for improvement of sexual healthcare access.
Design: Cross-sectional population-based study.
Setting: Greater Rotterdam area, the Netherlands (2015-2019).
Participants: All residents aged 15-45 years. Individual population-based register data were matched with laboratory-based STI testing data of general practitioners (GPs) and the only sexual health centre (SHC).
Outcome measures: Postal code (PC) area-specific STI risk scores (based on age, migratory background, education level and urbanisation), STI testing rates and STI positivity.
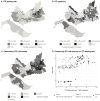
Results: The study area consists of approximately 500 000 residents aged 15-45 years. Strong spatial variation in STI testing, STI positivity and STI risk was observed. PC area testing rate ranged from 5.2 to 114.9 tests per 1000 residents. Three PC clusters were identified based on STI risk and testing rate: (1) high-high; (2) high-low; (3) low, independently of testing rate. Clusters 1 and 2 had comparable STI-related risk and STI positivity, but the testing rate differed greatly (75.8 vs 33.2 per 1000 residents). Multivariable logistic regression analysis with generalised estimating equation was used to compare residents in cluster 1 and cluster 2. Compared with cluster 1, residents in cluster 2 more often did not have a migratory background, lived in less urbanised areas with higher median household income, and more distant from both GP and SHC.
Conclusion: The determinants associated with individuals living in areas with high STI-related risk scores and low testing rates provide leads for improvement of sexual healthcare access. Opportunities for further exploration include GP education, community-based testing and service (re)allocation.
Keywords: epidemiology; health services accessibility; public health; registries; sexually transmitted disease.
© Author(s) (or their employer(s)) 2023. Re-use permitted under CC BY-NC. No commercial re-use. See rights and permissions. Published by BMJ.
Conflict of interest statement
Competing interests: None declared.
Figures

References
-
- Staritsky LE, Van Aar F, Visser M, et al. . Sexually transmitted infections in the Netherlands in 2019. Bilthoven, the Netherlands: National Institute for Public Health and the Environment (RIVM), 2020.
Publication types
MeSH terms
LinkOut - more resources
Full Text Sources
Medical
Miscellaneous
