. 2023 May 4;14(1):2586.
doi: 10.1038/s41467-023-38186-1.

Re-convolving the compositional landscape of primary and recurrent glioblastoma reveals prognostic and targetable tissue states

Affiliations

Re-convolving the compositional landscape of primary and recurrent glioblastoma reveals prognostic and targetable tissue states

Osama Al-Dalahmah et al. Nat Commun. .

Abstract

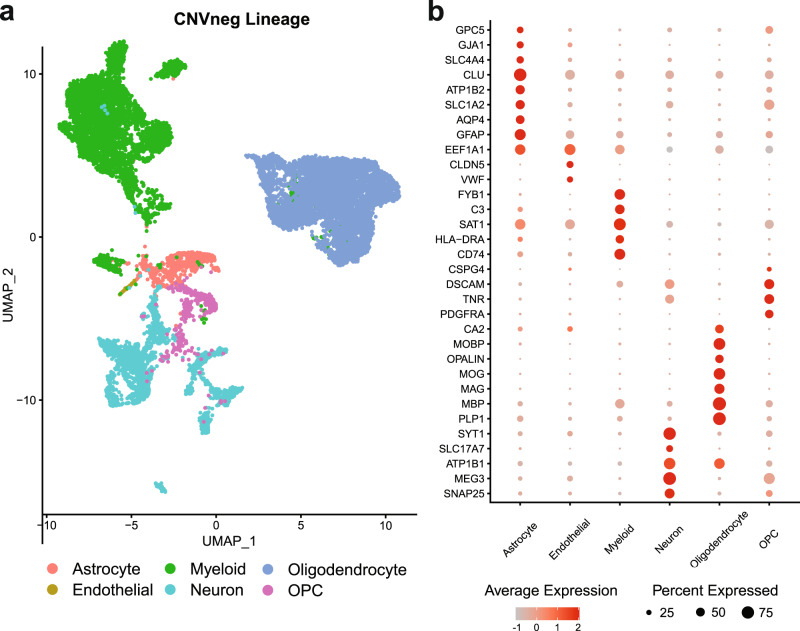
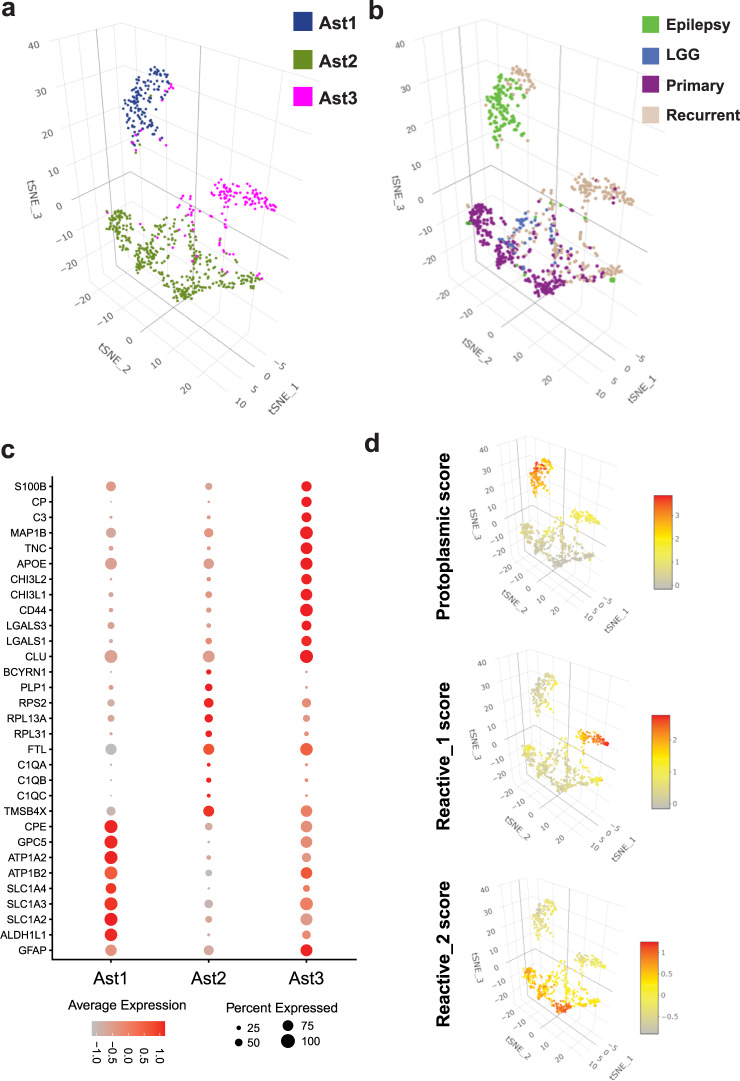
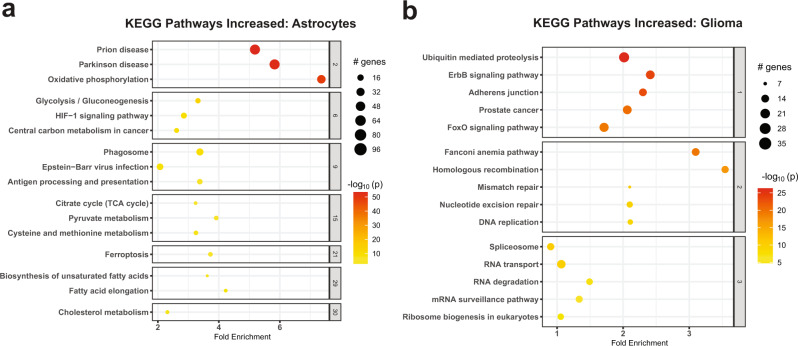
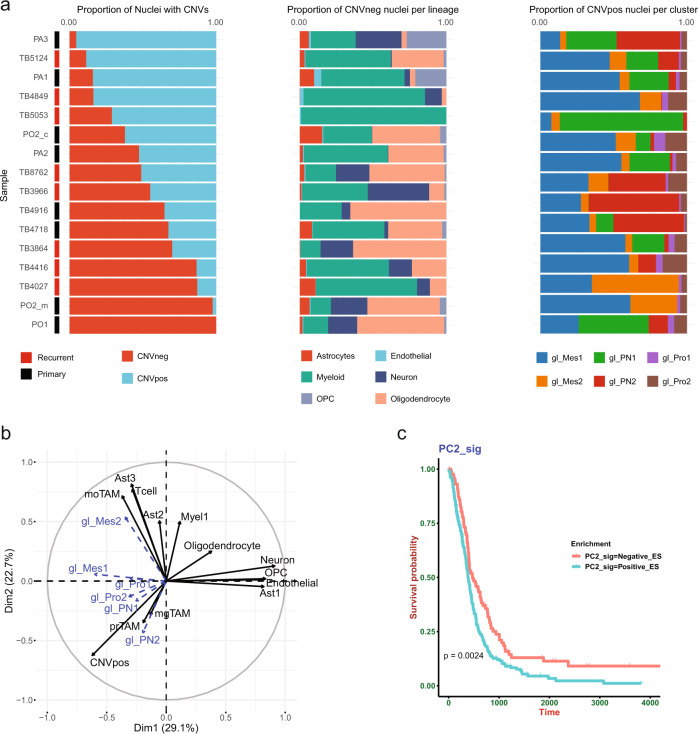
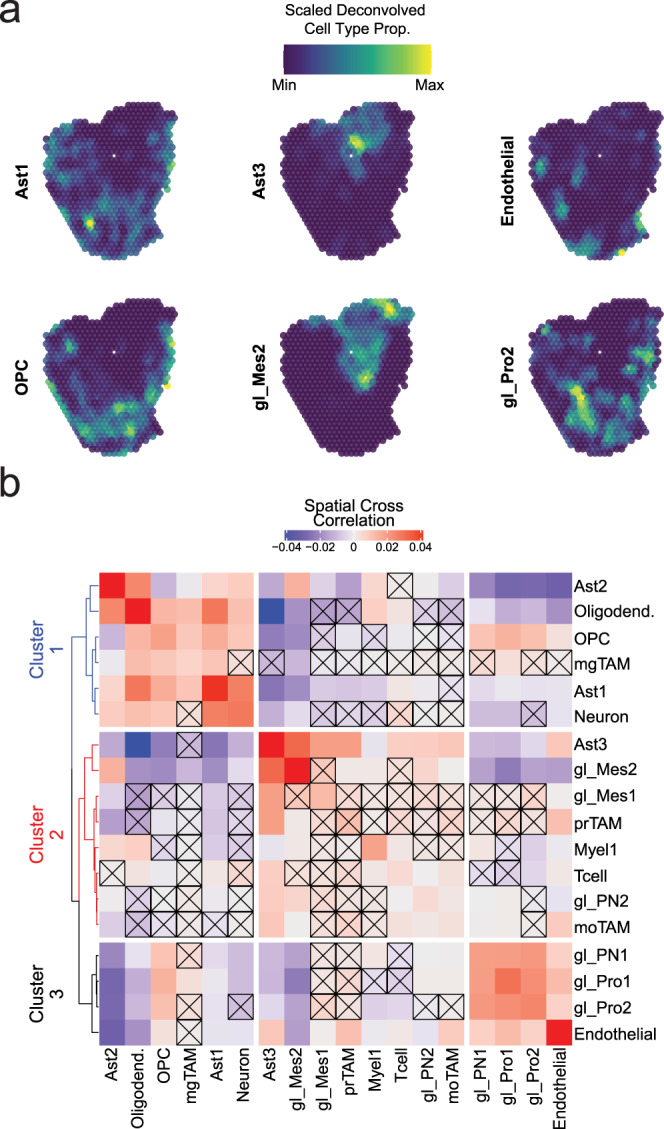
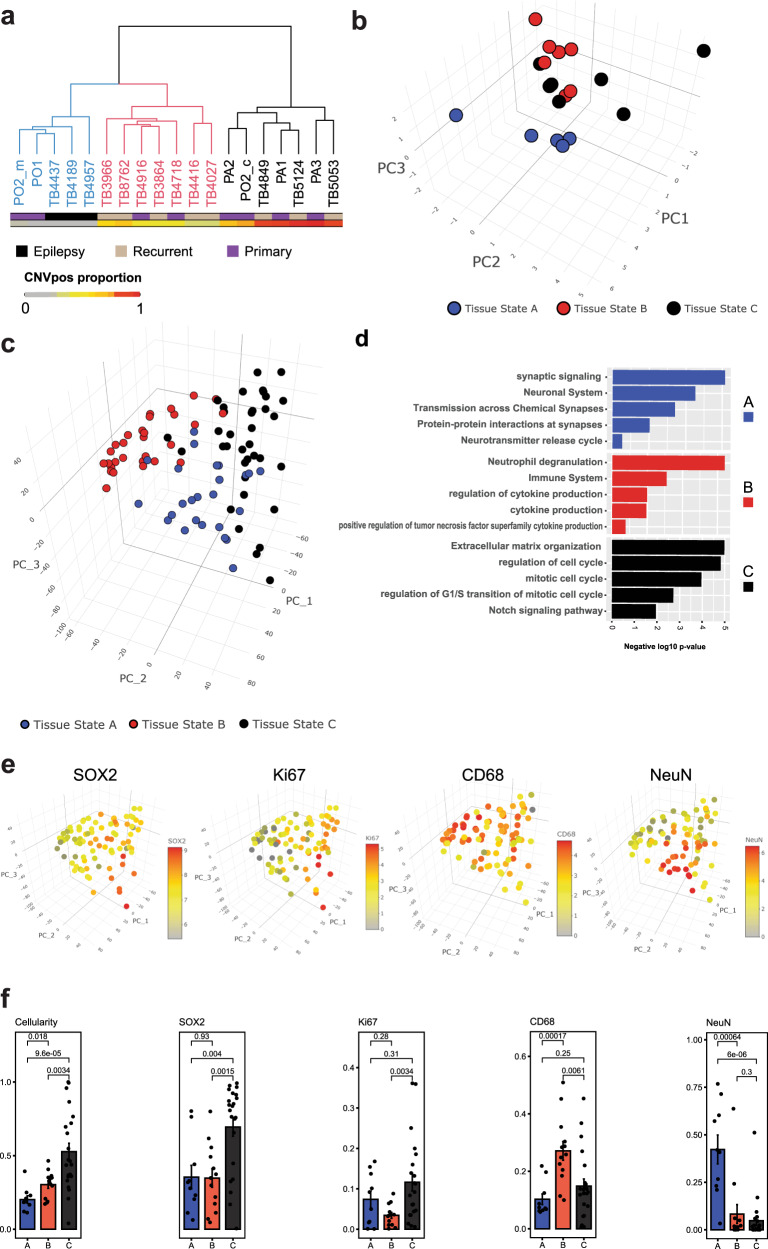
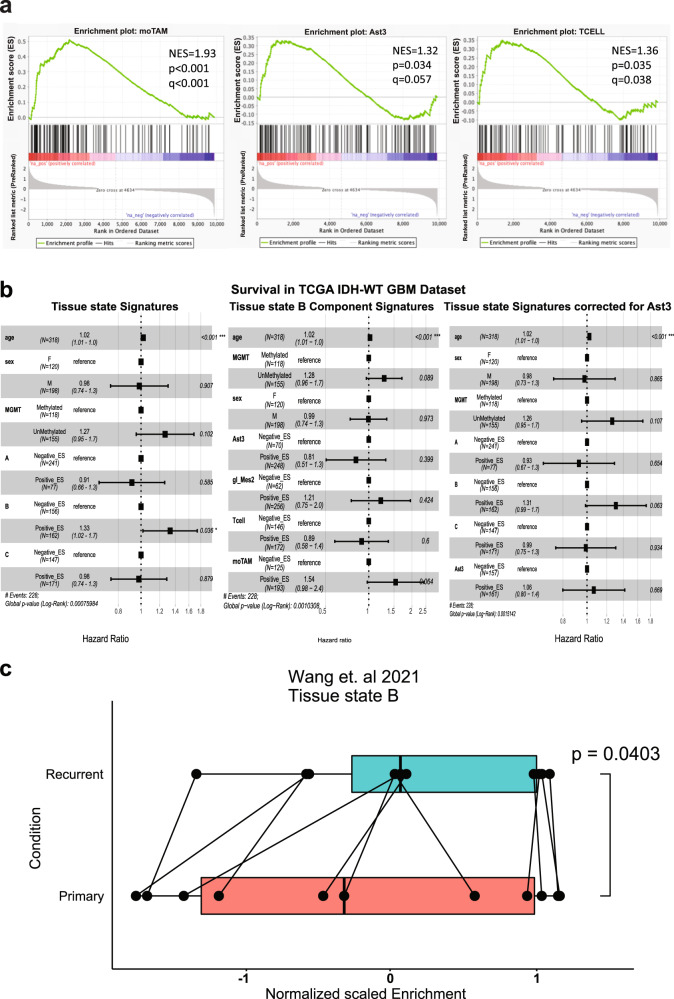
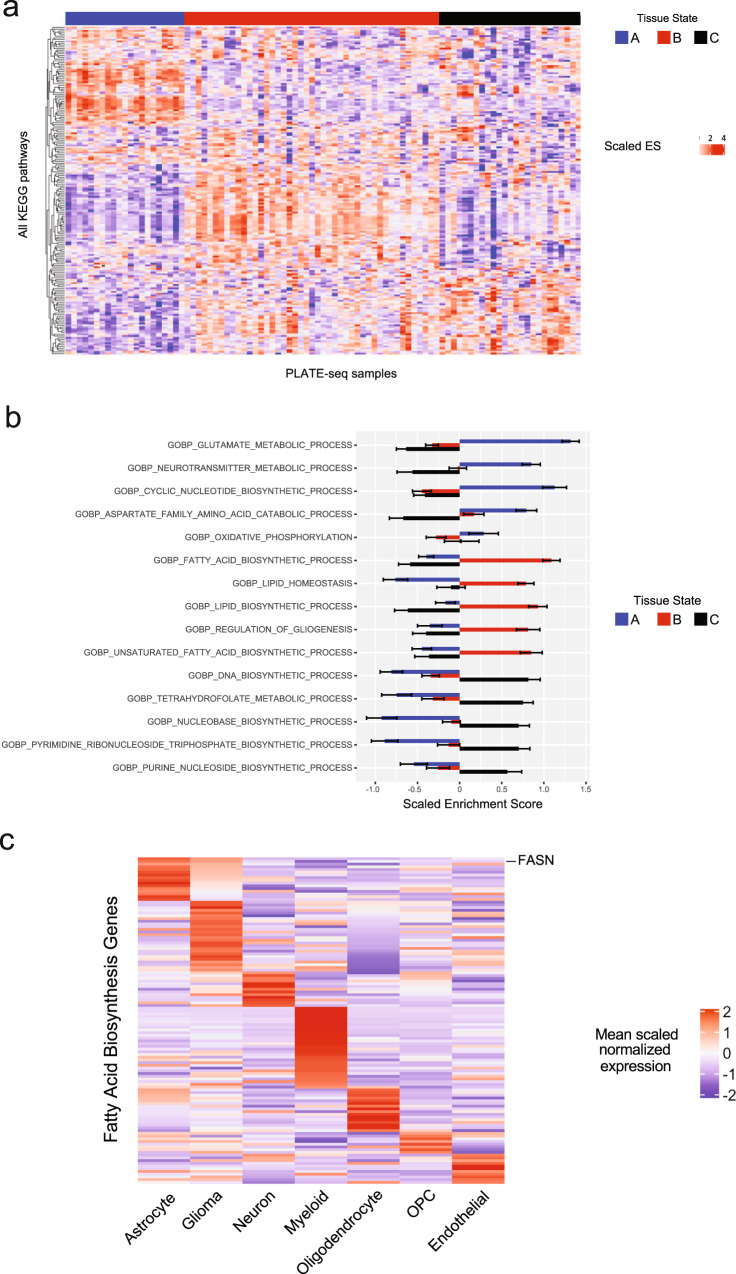
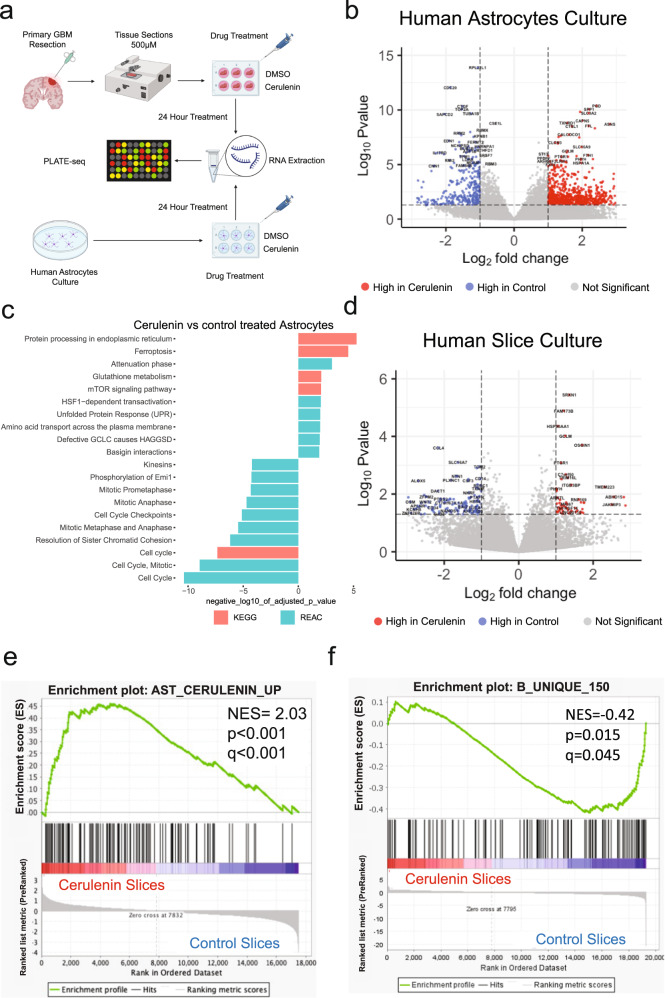
Glioblastoma (GBM) diffusely infiltrates the brain and intermingles with non-neoplastic brain cells, including astrocytes, neurons and microglia/myeloid cells. This complex mixture of cell types forms the biological context for therapeutic response and tumor recurrence. We used single-nucleus RNA sequencing and spatial transcriptomics to determine the cellular composition and transcriptional states in primary and recurrent glioma and identified three compositional 'tissue-states' defined by cohabitation patterns between specific subpopulations of neoplastic and non-neoplastic brain cells. These tissue-states correlated with radiographic, histopathologic, and prognostic features and were enriched in distinct metabolic pathways. Fatty acid biosynthesis was enriched in the tissue-state defined by the cohabitation of astrocyte-like/mesenchymal glioma cells, reactive astrocytes, and macrophages, and was associated with recurrent GBM and shorter survival. Treating acute slices of GBM with a fatty acid synthesis inhibitor depleted the transcriptional signature of this pernicious tissue-state. These findings point to therapies that target interdependencies in the GBM microenvironment.


Conflict of interest statement

P.A.S. receives patent royalties from Guardant Health. Columbia University has filed a patent application on the microwell single-cell RNA-seq technology used in this study, and P.A.S. is listed as a co-inventor. The patent number is WO/2016/191533. The patent title is “RNA printing and sequencing devices, methods, and systems”. None of the other authors declare any competing interests.

Figures

Fig. 1
Fig. 1. snRNAseq identifies non-neoplastic nuclei in the tumor microenvironment.
a Uniform-manifold approximation and projection (UMAP) graphs showing putative non-neoplastic (CNVneg) nuclei from primary glioma, recurrent glioma, low-grade glioma (LGG)—and epilepsy (see supplementary data for the analysis of LGG and epilepsy cases). The nuclei are color-coded by lineage (oligodendrocytes, oligodendrocyte-precursor cells (OPC), neurons, astrocytes, myeloid cells, and endothelial cells). b Dot plots showing normalized expression of select lineage genes (rows) in the lineages from a (columns). The size of each circle corresponds to the proportion of each lineage that expresses a given gene.
Fig. 2
Fig. 2. snRNAseq identifies three transcriptionally distinct astrocytes states in the glioma microenvironment.
a Three-dimensional tSNE plots showing all astrocyte nuclei color-coded by astrocyte state (Ast1—protoplasmic astrocytes, Ast2—reactive astrocytes with misexpression of non-astrocyte lineage genes, and Ast3—reactive astrocytes with expression of inflammatory genes. b Three-dimensional tSNE plots showing all astrocyte nuclei color-coded by disease condition. c Gene expression dot plots showing select gene marker expression for the astrocyte states. d tSNE plots showing the enrichment of gene signatures used for astrocyte clustering in astrocyte nuclei.
Fig. 3
Fig. 3. Differentially expressed genes in astrocytes and glioma are enriched for different gene ontologies.
a, b Active subnetwork enrichment analysis of KEGG pathways in genes differentially expressed in CNVneg glioma-associated astrocytes compared to CNVpos glioma cells in primary and recurrent IDH-WT glioma. Fold-enrichment is represented on the x-axis and the pathways in the y-axis. The pathways are clustered to denote shared genes driving enrichment. Significance was calculated using a Fisher exact test. The size of the circle per pathway denotes the number of enriched genes, and the negative log10 of the Bonferroni adjusted p-value is represented by color. Pathways enriched in genes significantly higher in astrocytes compared to glioma cells are shown in a and include neurodegenerative diseases and oxidative phosphorylation, metabolism including fatty acid metabolism. Pathways enriched in genes significantly higher in glioma cells compared to astrocytes are shown in b and include DNA replication, splicing, and ErbB signaling.
Fig. 4
Fig. 4. snRNAseq identifies compositional patterns that correlate with survival.
a Bar plots demonstrating the fractional composition of each one of 16 samples analyzed by snRNAseq (8 primary IDH-WT glioma from 7 patients, one case was divided to core and overlying cortex, and 8 recurrent IDH-WT glioblastoma). The left panel shows the fraction of neoplastic (CNVpos) and non-neoplastic (CNVneg) nuclei. The middle panel shows the fraction of the non-neoplastic nuclei contributed by neurons, oligodendrocytes, OPCs, astrocytes, myeloid cells, endothelial cells, and astrocytes. The right panel shows the fraction of the neoplastic nuclei contributed by proneural/progenitor-like glioma (gl_PN1, gl_PN2), astrocyte-like/mesenchymal glioma (gl_Mes1, gl_Mes2), and proliferative glioma (gl_Pro1, and gl_Pro2). The description of glioma states is provided in the supplementary results. b Principal component analysis of the fractional composition matrix of 19 samples encompassing eight primary and eight recurrent gliomas plus three epilepsy samples (Supplementary dataset 1). The tissue composition matrix consists of the percentage of nuclei per each tissue state. Immune-cell states are: mgTAMs (microglia-derived Tumor-associated macrophages), moTAM (monocyte-derived TAMs), prTAM (proliferative TAM), Myel1 (baseline myeloid cells), and T cells. Astrocyte states include baseline (protoplasmic) astrocytes (Ast1), reactive CD44 + astrocytes (Ast3), and reactive astrocytes with expression of non-astrocyte genes (Ast2)—see text and supplementary results for additional description of these cell states. CNVpos represents the total percentage of all glioma states per sample. Individual glioma states were not used in PCA calculation, rather they were used as supplementary quantitative variables and their coordinates were predicted from the PCA analysis—see methods. c Kaplan–Meier survival plot graphing survival (days) in the combined TCGA and CGGA RNAseq datasets. The samples were classified based on positive or negative enrichment for the PC2 gene signature. Statistical significance was computed using the log-rank test.
Fig. 5
Fig. 5. Spatial transcriptomics identifies significant spatial relationships between cell types in GBM.
a Representative plots showing deconvolved proportions of select cell types and glioma states across an ST sample. Each subplot is range scaled for the proportion of that cell type in the sample to show the relative spatial distribution of that cell type. b Heatmap showing the average spatial cross-correlation between all cell types at a radius of 900 µm surrounding spatial transcriptomic spots across all nine ST experiments. The diagonal of the matrix, which shows the spatial cross-correlation between a cell type and itself, is an indication of the degree of spatial autocorrelation in that cell type and is not necessarily equal to one. Spatial cross-correlation relationships were tested for significance using permutation (see methods), and non-significant relationships are denoted with an X. Hierarchical clustering of the distance matrix derived from the cross-correlation matrix produced three clusters.
Fig. 6
Fig. 6. Tissue composition analysis defines “tissue states” recapitulated in a validation bulk RNAseq dataset.
a Dendrogram of hierarchically clustered glioma and epilepsy samples based on Manhattan sample distance analysis drawn from the fractional composition matrix (see Fig. 4a). Three clusters were identified and are color-coded on the dendrogram in black (Tissue-state C), red (Tissue-state B), and blue (Tissue-state A). The condition (primary, recurrent and epilepsy) and proportion of neoplastic nuclei are indicated. b Three-dimensional scatter plot showing the samples in panel a projected in the first three principal component loadings—see Fig. 4b for PCA analysis. c Bulk RNAseq samples from 91 primary and recurrent IDH-WT glioblastoma samples projected in the principal component space. The samples were clustered (Hierarchical clustering—Ward.D2 method) on the Euclidian distance of the enrichment scores of the genes unique to each tissue state signature into three clusters A–C. d Gene ontology term analysis of the differentially expressed genes for each cluster in panel c. KEGG, REACTOME, or Biological Process GO pathways are shown in the y-axis. Negative log10 adjusted p-value is shown on the x-axis. e Normalized expression of select genes characteristic of each of the clusters projected onto the compositional-signature enrichment score space shown in panel c. Red denotes high expression, and gray denotes low expression. NeuN (RBFOX3) is highest in the samples of Cluster A. CD68 is highest in the samples of cluster B. SOX2 is highest in the samples of clusters B and C. MKI67 is highest in the samples of cluster C. f Quantification of histological cellularity analysis and immunohistochemistry labeling indices of SOX2, KI67, CD68, and NeuN. The labeling index is shown on the y-axis. Note that the y-axis for the cellularity graph is total cellularity normalized to the most cellular sample. The sample clusters are labeled (A–C) as in panel c. Indicated p-values were calculated using a Kruskal–Wallis test. n = 45 biological samples: 8 for cluster A, 25 for cluster B, and 12 for cluster C. Source Data are provided as a Source data file.
Fig. 7
Fig. 7. Enrichment for tissue state B is independently associated with worse survival.
a Pre-ranked Gene Set Enrichment Analysis (GSEA) comparing tissue state B bulk RNAseq samples with tissue states A & C samples for 3 sub-lineages: Ast3, moTAM, and T-cells. Marker genes for each cell type were used as the gene set for each analysis. Normalized Enrichment Score (NES) is displayed, along with p-values and FDR-adjusted q-values. b Cox proportional hazard ratio of survival in the combined TCGA and CGGA IDH-WT GBM dataset given enrichment of each of the tissue state signatures (left), for the individual cell types that comprise Tissue State B (middle), and for each of the tissue states, regressing out enrichment of the Ast3 gene signature (right). Age, sex, and MGMT status are included as co-variates in the model. The p-values are shown on the left, bars indicate confidence intervals (also noted on the right). Enrichment of each geneset was categorized as negative or positive. c Boxplots of the tissue state B normalized enrichment scores in the Wang et al. (2021) paired primary and recurrent GBM dataset. Each box indicates the 25th, 50th, and 75th percentile enrichment scores per condition and paired samples are denoted by connected points. The whiskers indicate the minimum and maximum values. Significance was assessed using a one-tailed paired t-test, n = 11 per group. The p-value is indicated. Source Data are provided as a Source data file.
Fig. 8
Fig. 8. Metabolic pathways drive targetable tissue state signatures.
a Heatmap displaying scaled enrichment scores for all KEGG pathways across all PLATE-seq samples. The heatmap is grouped by tissue state (cluster A, B, C), annotated by the horizontal bar at the top. Hierarchical clustering was performed on the rows (pathways), demonstrating cluster-specific metabolic programs. b Bar plot displaying scaled ssGSEA scores for select KEGG metabolic programs from panel a. Bar plots represent mean scaled ssGSEA score ± standard error for each of the three clusters for a given pathway. c Representative example showing a heatmap displaying mean lineage-specific scaled normalized expression of genes in the GO: Biological Process—Fatty Acid Biosynthesis gene set—which was most enriched in tissue state B. Note the expression of FASN is highest in astrocytes and glioma cells. Source Data are provided as a Source data file.
Fig. 9
Fig. 9. Fatty acid synthase inhibition depletes tissue state B signature in GBM slice cultures.
a Scheme of in vitro and ex vivo fatty acid synthase perturbation studies. This panel was created with BioRender.com. b Volcano plot showing the log2 fold-change (x-axis) and log10 p-value (y-axis, two-tailed t-test) of differentially expressed genes in astrocytes treated with Cerulenin (5 mg/ml) vs. control. c KEGG and Reactome pathway enrichment analysis with the terms indicated on the y-axis, and the log10 p-value on the x-axis. The sign of the log10 p-value indicates the direction of change (i.e., negative = reduced in Cerulenin treatment). d Volcano plot showing the log2 fold-change (x-axis) and log10 p-value (y-axis, two-tailed Wald-test) of differentially expressed genes in GBM slice cultures treated with Cerulenin (5 mg/ml) vs. control. e, f GSEA plots of pre-ranked enrichment of the genes increased in astrocytes treated with Cerulenin (e) and the top 150 genes unique to tissue state B signature (f). The normalized enrichment scores (NES), p-value (p), and adjusted p-value (q) are indicated.

References

    1. Quail DF, Joyce JA. The microenvironmental landscape of brain tumors. Cancer Cell. 2017;31:326–341. doi: 10.1016/j.ccell.2017.02.009. - DOI - PMC - PubMed
    1. Yuan J, et al. Single-cell transcriptome analysis of lineage diversity in high-grade glioma. Genome Med. 2018;10:57. doi: 10.1186/s13073-018-0567-9. - DOI - PMC - PubMed
    1. Gill BJ, et al. MRI-localized biopsies reveal subtype-specific differences in molecular and cellular composition at the margins of glioblastoma. Proc. Natl Acad. Sci. USA. 2014;111:12550–12555. doi: 10.1073/pnas.1405839111. - DOI - PMC - PubMed
    1. Puchalski RB, et al. An anatomic transcriptional atlas of human glioblastoma. Science. 2018;360:660–663. doi: 10.1126/science.aaf2666. - DOI - PMC - PubMed
    1. Jin X, et al. Targeting glioma stem cells through combined BMI1 and EZH2 inhibition. Nat. Med. 2017;23:1352–1361. doi: 10.1038/nm.4415. - DOI - PMC - PubMed

Publication types