. 2023 May 4;14(1):2567.
doi: 10.1038/s41467-023-38150-z.

Chemical imaging reveals diverse functions of tricarboxylic acid metabolites in root growth and development

Affiliations

Chemical imaging reveals diverse functions of tricarboxylic acid metabolites in root growth and development

Tao Zhang et al. Nat Commun. .

Abstract

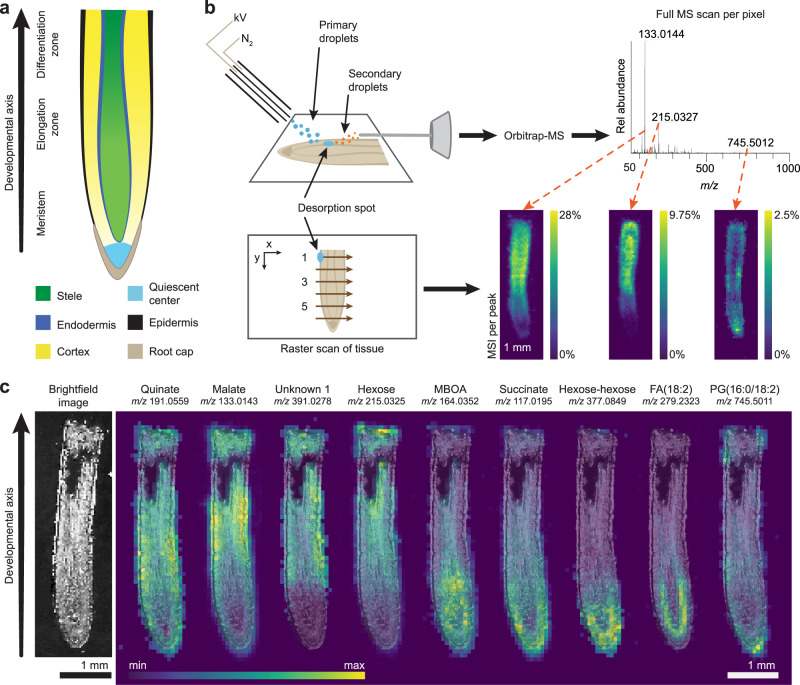
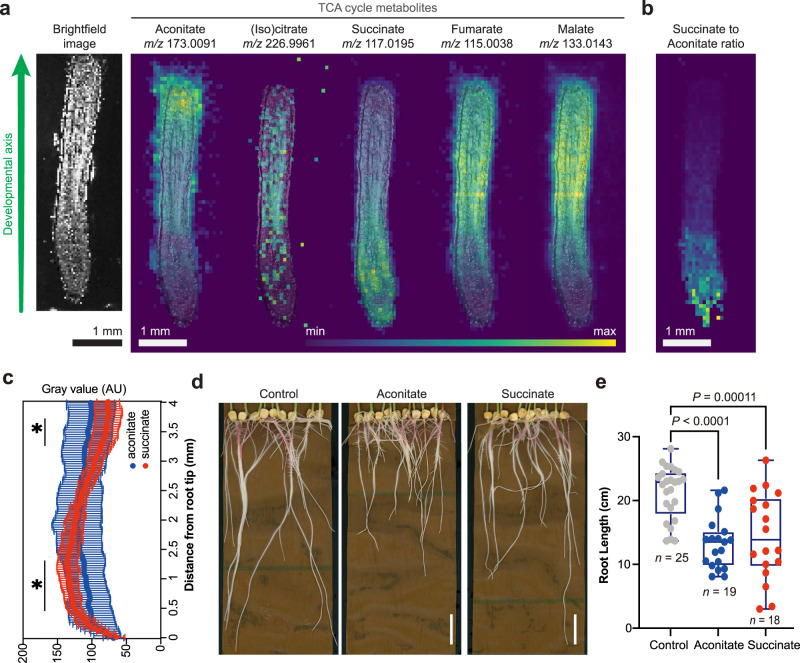
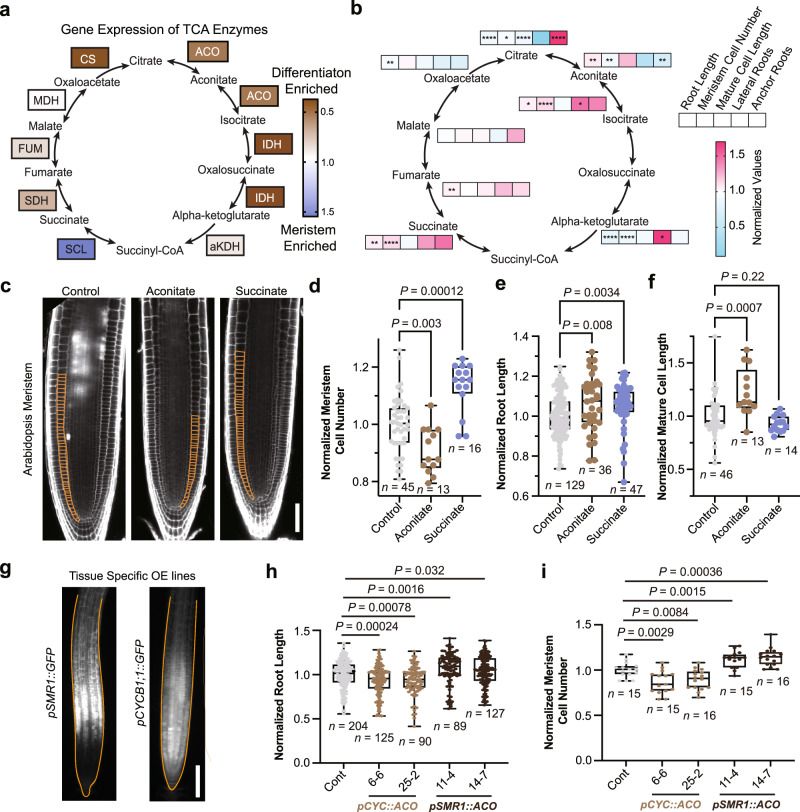
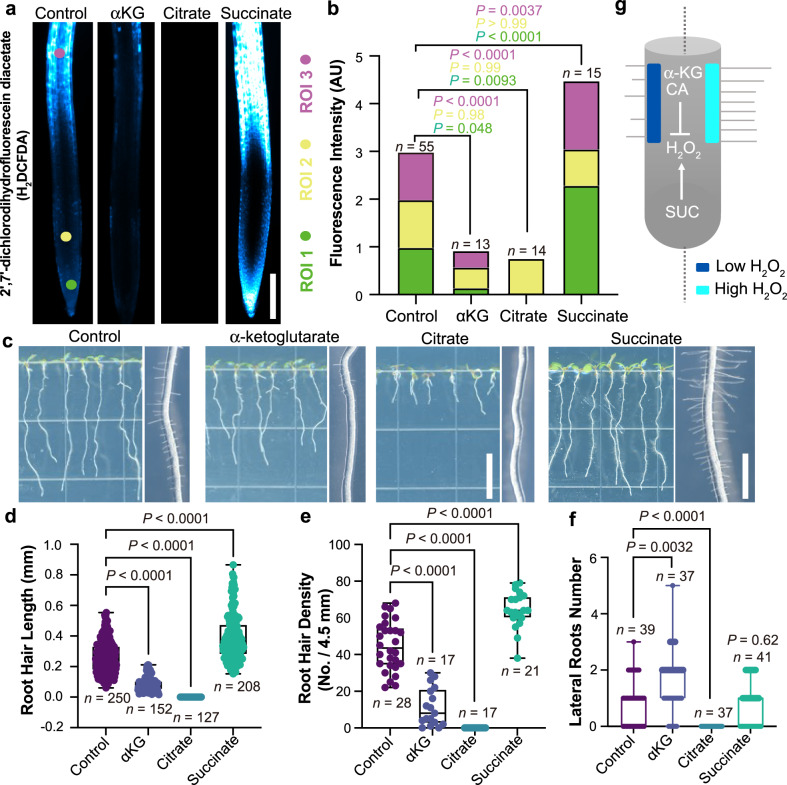
Understanding how plants grow is critical for agriculture and fundamental for illuminating principles of multicellular development. Here, we apply desorption electrospray ionization mass spectrometry imaging (DESI-MSI) to the chemical mapping of the developing maize root. This technique reveals a range of small molecule distribution patterns across the gradient of stem cell differentiation in the root. To understand the developmental logic of these patterns, we examine tricarboxylic acid (TCA) cycle metabolites. In both Arabidopsis and maize, we find evidence that elements of the TCA cycle are enriched in developmentally opposing regions. We find that these metabolites, particularly succinate, aconitate, citrate, and α-ketoglutarate, control root development in diverse and distinct ways. Critically, the developmental effects of certain TCA metabolites on stem cell behavior do not correlate with changes in ATP production. These results present insights into development and suggest practical means for controlling plant growth.


Conflict of interest statement

The authors declare no competing interest.

Figures

Fig. 1
Fig. 1. DESI-MSI captures the distinct distribution patterns of endogenous molecules within the developing maize root.
a Maize root tip with developmental zones and tissue types. b Schematic of DESI-MSI shows the mechanism of ambient desorption and ionization by continuous spray of charged droplets, where one full scan is captured per pixel. The desorption spot is moved in a raster scan across the tissue to produce a pixelated map. Each peak in the full spectrum corresponds to one MS image. c Brightfield image of a maize root section prior to DESI imaging. DESI-MS images show that certain metabolites and lipids are most intense in distinct tissues and developmental zones. MS images are in the negative ionization mode and are overlaid with the brightfield image. The maximum intensity of each ion as a percentage of total ion current is: quinate, 1.40%; malate, 21.8%; unknown 1, 1.13%; hexose, 12.3%; 6-methoxy-2-benzoxazolinone (MBOA), 2.74%; succinate, 5.07%; hexose-hexose, 1.47%; fatty acid (18:2), 3.83%; and phosphatidylglycerol (16:0/18:2), 2.61%. This experiment was replicated ten times across three biological samples (Supplementary Table 1). Data from one representative tissue section are shown here. MS images of all ten sections are available in Supplementary Figs. 11–17, 23, 25.
Fig. 2
Fig. 2. The TCA cycle metabolites are differentially distributed along the developmental axis of the maize root.
a DESI-MS images of the detectable TCA cycle metabolites overlaid with a brightfield image captured prior to MS imaging. The maximum ion intensity as % TIC is different for each ion and is: aconitate, 2.99%; citrate/isocitrate, 0.271%; succinate, 3.12%; fumarate, 4.55%; and malate, 28.0%. b MS image of the intensity ratio of succinate to aconitate per pixel. Maximum of ratio scale is 11 (yellow). Imaging experiments were replicated ten times across three biological samples (Supplementary Table 1). Data from one representative tissue section are shown here. MS images of all ten sections are available in Supplementary Figs. 21–30. c Normalized intensity of aconitate and succinate along the root axis. The data are presented as means ± s.d. (n = 10 root sections across three biological replicates, Supplementary Table 1). Asterisks indicate statistical significance by two-tailed unpaired Student’s t-test (*P < 0.05, detailed P-values for each point can be seen in the Source Data file). All MS data were acquired in the negative ionization mode. d, e Maize root phenotypes under 10 mM aconitate and succinate treatment, respectively. Scale bars, 3 cm. For the boxplots, each dot represents the datapoint of one biological replicate; the central line indicates the median; the bounds of the box show the 25th and 75th percentiles; and the whiskers indicate maximum and minimum values. All P-values were determined by one-way ANOVA (all n and P-values are indicated in the graphs). Source data are provided as a Source Data file.
Fig. 3
Fig. 3. Succinate and aconitate have opposing effects on meristem cell divisions in Arabidopsis.
a Enrichment of the expression levels (log[3xFPKM]) of TCA biosynthesis genes in the root meristem. Data were quantified from Li S. et al.. Enrichment was calculated by dividing the average expression in the meristem by the average expression in the differentiation zone. b Heat map of Arabidopsis root phenotypes under 1 mM TCA metabolite treatments. c Confocal images of root meristems treated with 1 mM succinate or aconitate, respectively. Scale bar, 100 μm. Meristematic cortex cells are outlined in orange. df Quantification of the effects of 1 mM treatments on the number of meristematic cells (d), the total primary root length (e), and the average cell length of the mature root (f), normalized to the control. g Transcriptional reporters for SMR, a promoter specific to the early differentiation zone, and CYCB1;1, a meristem promoter. Scale bar, 150 μm. Root outlines are highlighted in orange. h, i Quantification of primary root length and number of meristem cells in genetically engineered lines, respectively. (CYC = CYCB1;1, ACO = ACONITASE 1). Data were normalized to the control treatment for each genotype. For the boxplots, each dot represents the datapoint of one biological replicate; the central line indicates the median; the bounds of the box show the 25th and 75th percentiles; and the whiskers indicate maximum and minimum values. All P-values were determined by one-way ANOVA in (df) and by two-tailed unpaired Student’s t-tests in (b, h, i). All P-values are shown in the plots, except for (b) which are provided in the Source Data (*P < 0.05, **P < 0.01, ***P < 0.001, ****P < 0.0001). Source data are provided as a Source Data file.
Fig. 4
Fig. 4. TCA metabolites alter ROS levels and root hair development in Arabidopsis.
a Images of H2DCFDA, a biological reporter for H2O2, in roots treated with 5 mM TCA metabolites. Scale bar, 200 μm. b Quantification of the H2DCFDA fluorescence intensity in three regions of interest (ROIs). Data represent means. All P-values were determined by one-way ANOVA. c Images of Arabidopsis roots treated with 5 mM TCA metabolites. Scale bar for primary root (left), 1 cm. Scale bar for root hair (right), 1 mm. d, e Quantification of the effects of 5 mM TCA metabolite treatments on root hair phenotypes. All P-values were determined by one-way ANOVA. For the boxplots, the central line indicates the median; the bounds of the box show the 25th and 75th percentiles; and the whiskers indicate maximum and minimum values. f Effect of TCA metabolites on lateral root number. All P-values were determined by two-tailed unpaired Student’s t-test. g A model for how succinate (SUC), citrate (CA), and α-ketoglutarate (αKG) influence root hair development through their effects on H2O2 levels. Source data are provided as a Source Data file.

References

    1. Moussaieff A, et al. High-resolution metabolic mapping of cell types in plant roots. Proc. Natl Acad. Sci. USA. 2013;110:E1232–E1241. doi: 10.1073/pnas.1302019110. - DOI - PMC - PubMed
    1. Wiseman JM, Ifa DR, Song Q, Cooks RG. Tissue imaging at atmospheric pressure using Desorption Electrospray Ionization (DESI) mass spectrometry. Angew. Chem. Int. Ed. 2006;45:7188–7192. doi: 10.1002/anie.200602449. - DOI - PubMed
    1. Ifa DR, et al. Tissue imprint imaging by desorption electrospray ionization mass spectrometry. Anal. Methods. 2011;3:1910–1912. doi: 10.1039/c1ay05295k. - DOI - PMC - PubMed
    1. Thunig J, Hansen SH, Janfelt C. Analysis of secondary plant metabolites by indirect desorption electrospray ionization imaging mass spectrometry. Anal. Chem. 2011;83:3256–3259. doi: 10.1021/ac2004967. - DOI - PubMed
    1. Li B, Bjarnholt N, Hansen SH, Janfelt C. Characterization of barley leaf tissue using direct and indirect desorption electrospray ionization imaging mass spectrometry. J. Mass Spectrom. 2011;46:1241–1246. doi: 10.1002/jms.2010. - DOI - PubMed

Publication types

MeSH terms

Substances