. 2023 May 5;14(5):306.
doi: 10.1038/s41419-023-05806-z.

Intratumor heterogeneity and cell secretome promote chemotherapy resistance and progression of colorectal cancer

Affiliations

Intratumor heterogeneity and cell secretome promote chemotherapy resistance and progression of colorectal cancer

Julia Källberg et al. Cell Death Dis. .

Abstract

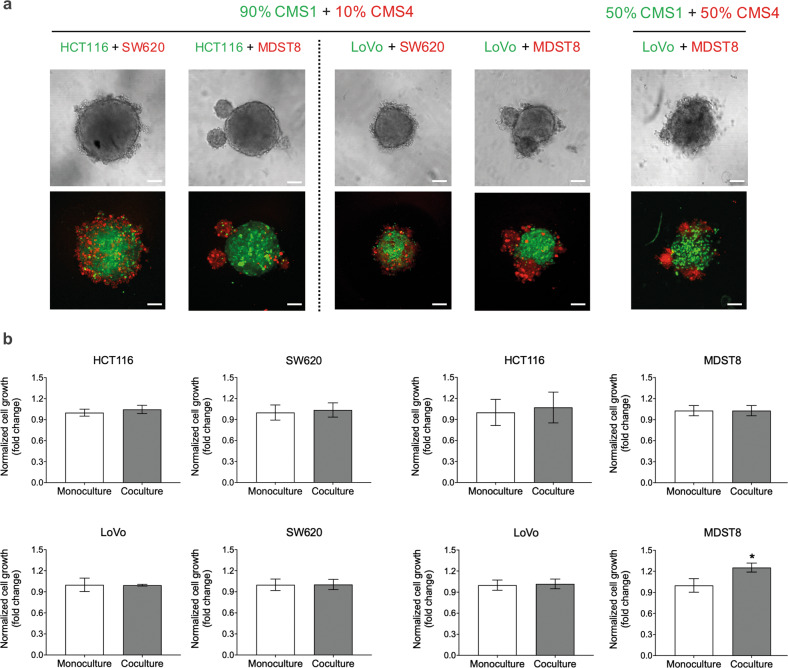
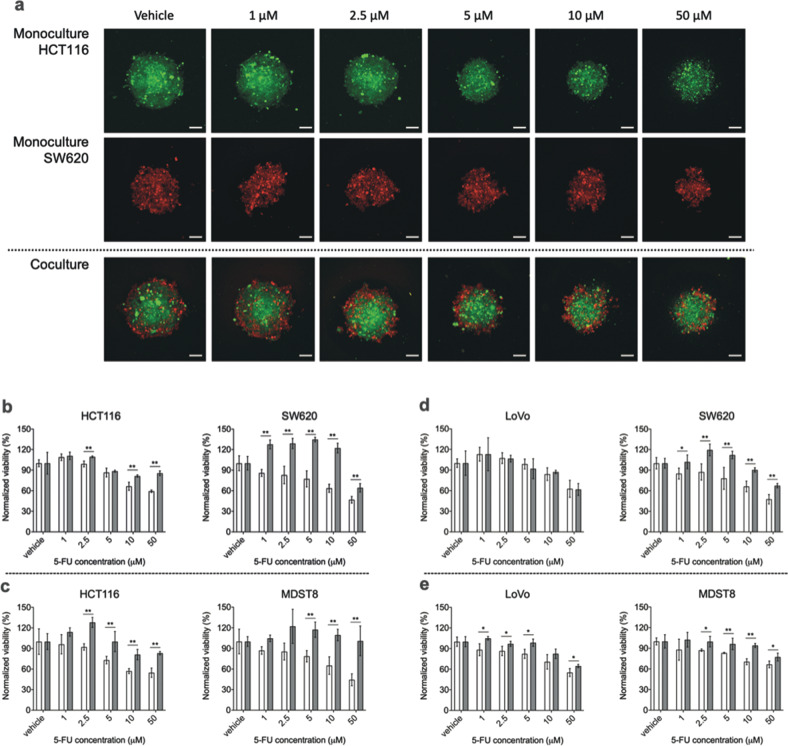
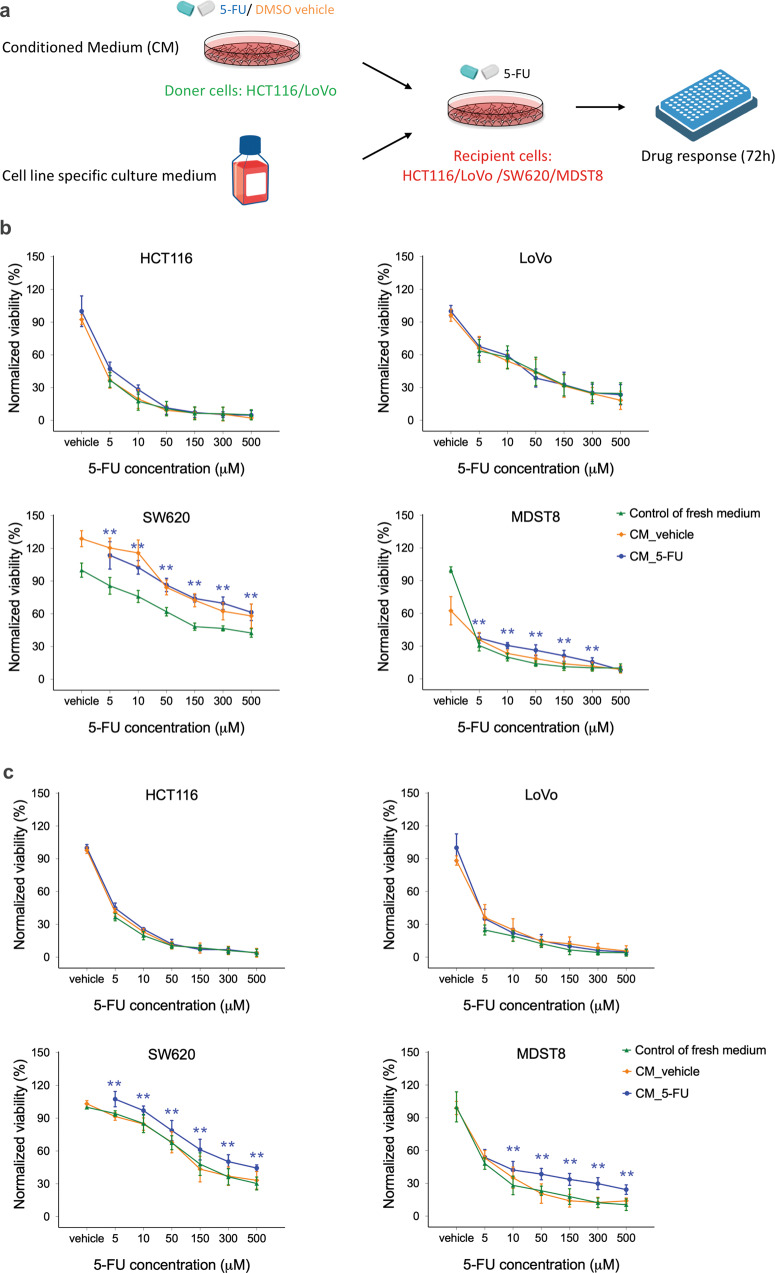
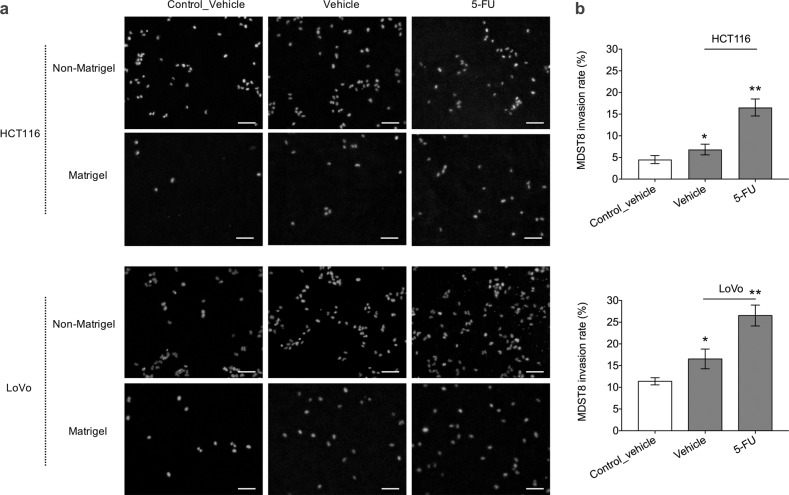
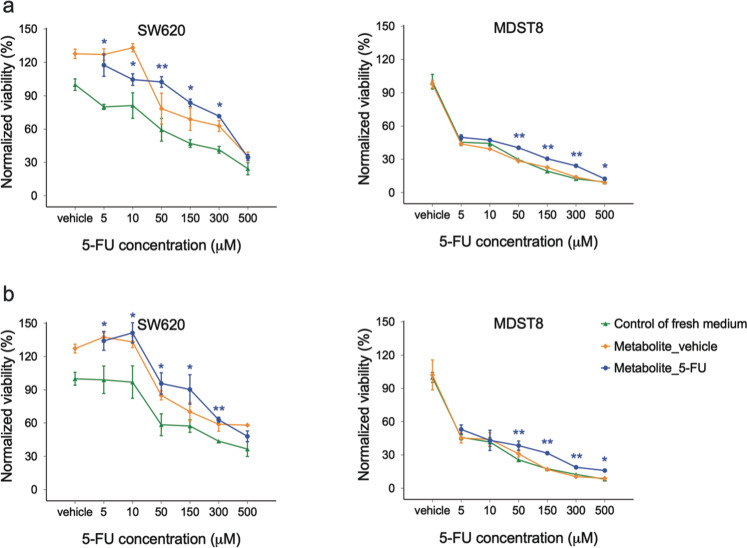
The major underlying cause for the high mortality rate in colorectal cancer (CRC) relies on its drug resistance, to which intratumor heterogeneity (ITH) contributes substantially. CRC tumors have been reported to comprise heterogeneous populations of cancer cells that can be grouped into 4 consensus molecular subtypes (CMS). However, the impact of inter-cellular interaction between these cellular states on the emergence of drug resistance and CRC progression remains elusive. Here, we explored the interaction between cell lines belonging to the CMS1 (HCT116 and LoVo) and the CMS4 (SW620 and MDST8) in a 3D coculture model, mimicking the ITH of CRC. The spatial distribution of each cell population showed that CMS1 cells had a preference to grow in the center of cocultured spheroids, while CMS4 cells localized at the periphery, in line with observations in tumors from CRC patients. Cocultures of CMS1 and CMS4 cells did not alter cell growth, but significantly sustained the survival of both CMS1 and CMS4 cells in response to the front-line chemotherapeutic agent 5-fluorouracil (5-FU). Mechanistically, the secretome of CMS1 cells exhibited a remarkable protective effect for CMS4 cells against 5-FU treatment, while promoting cellular invasion. Secreted metabolites may be responsible for these effects, as demonstrated by the existence of 5-FU induced metabolomic shifts, as well as by the experimental transfer of the metabolome between CMS1 and CMS4 cells. Overall, our results suggest that the interplay between CMS1 and CMS4 cells stimulates CRC progression and reduces the efficacy of chemotherapy.


Conflict of interest statement

The authors declare no competing interests.

Figures

Fig. 1
Fig. 1. CMS1 and CMS4 cells in cocultured 3D spheroids.
a Representative live cell confocal fluorescence microscopy images showing spheroid morphology and cell distribution on day 4 post-seeding. HCT116 cells were stained with cell tracker CMFDA (green), SW620 and MDST8 cells were stained with CMRA (red) fluorescent probes, LoVo cells express GFP. Scale bars = 100 μm. b Cell growth in cocultured 3D spheroids. Cell growth was measured in cocultured tumor spheroids by means of image analysis quantifying the fluorescence intensity of cell trackers that represent the cell number, and normalized to the monoculture as a control. The bars represent the average of cell growth and the error bars represent the standard deviation (n = 3). Statistical significance was calculated using a one-way ANOVA followed by Student’s t-test. P-values of <0.05 and 0.01 were considered significant (*) and highly significant (**), respectively.
Fig. 2
Fig. 2. Monocultured and cocultured spheroids of CMS1 and CMS4 cells.
a Representative live cell confocal fluorescence microscopy images showing the spheroid morphology of HCT116 and SW620 after 3 days of 5-FU treatment. Cells were stained with either cell tracker CMFDA (green) or CMRA (red) fluorescent probes. Scale bars = 100 μm. be 5-FU response of CMS1 and CMS4 cells in spheroids. Monocultured (white bars) and cocultured spheroids (gray bars) of b HCT116 and SW620, c HCT116 and MDST8, d LoVo and SW620 and e LoVo and MDST8 were exposed to different concentrations of 5-FU for 3 days. Cell viability was measured by means of image analysis quantifying the fluorescence intensity of cell trackers that represent the cell number, and normalized to the vehicle control. The bars represent the average of viability and the error bars represent the standard deviation (n = 3). Statistical significance was calculated using a one-way ANOVA followed by Student’s t-test. P-values of <0.05 and 0.01 were considered significant (*) and highly significant (**), respectively, when compared to the monoculture.
Fig. 3
Fig. 3. Drug resistance effect of conditioned media (CM) of CMS1 cells.
a Schematic of recipient cells treated with CM of donor cells. Recipient cells were treated with either CM_vehicle or CM_5-FU of b HCT116 or c LoVo doner cells, and were exposed to different concentrations of 5-FU for 3 days. Cells treated with media only were taken as a control. Cell viability was measured using MTS assays. The squares, circles, and triangles represent the average viability normalized to the vehicle control and the error bars represent the standard deviation (n = 3). Statistical significance was calculated using a one-way ANOVA followed by Student’s t-test. P-values of <0.05 and 0.01 were considered significant (*) and highly significant (**), respectively, when compared to the control.
Fig. 4
Fig. 4. MDST8 cell invasion through transwell membrane.
a Representative widefield fluorescence microscopy images showing MDST8 migration and invasion through transwell membrane with and without Matrigel coating after 2 day exposure to HCT116 or LoVo in the bottom wells. MDST8 exposed to only media without cells were taken as a control. Cells were treated with either DMSO vehicle or 2.5 μM of 5-FU. Cell nuclei were stained with Hoechst (blue). Scale bars = 100 μm. b Invasion rate of MDST8 presented as the percentage of cell invasion through Matrigel-coated transwell membrane relative to the cell migration through the non-Matrigel coated transwell membrane. The bars represent the average and the error bars represent the standard deviation (n = 3). Statistical significance was calculated using a one-way ANOVA followed by Student’s t-test. P-values of <0.05 and 0.01 considered significant (*) and highly significant (**), respectively, when compared to the control.
Fig. 5
Fig. 5. Drug resistance effect of metabolites of CMS1 cells.
CMS4 cells were treated with either metabolite_vehicle or metabolite_5-FU of a HCT116 or b LoVo CMS1 cells, and were exposed to different concentrations of 5-FU for 3 days. Cells treated with media only were taken as a control. Cell viability was measured using MTS assays. The squares, circles, and triangles represent the average viability normalized to the control and the error bars represent the standard deviation (n = 3). Statistical significance was calculated using a one-way ANOVA followed by Student’s t-test. P-values of <0.05 and 0.01 were considered significant (*) and highly significant (**), respectively, when compared to the control.

References

    1. Allemani C, Matsuda T, Di Carlo V, Harewood R, Matz M, Nikšić M, et al. Global surveillance of trends in cancer survival 2000–14 (CONCORD-3): analysis of individual records for 37 513 025 patients diagnosed with one of 18 cancers from 322 population-based registries in 71 countries. Lancet. 2018;391:1023–75. doi: 10.1016/S0140-6736(17)33326-3. - DOI - PMC - PubMed
    1. Colorectal Cancer Survival Rates | Colorectal Cancer Prognosis. https://www.cancer.org/cancer/colon-rectal-cancer/detection-diagnosis-st....
    1. Carethers JM. Systemic treatment of advanced colorectal cancer: tailoring therapy to the tumor. Ther Adv Gastroenterol. 2008;1:33–42. doi: 10.1177/1756283X08093607. - DOI - PMC - PubMed
    1. Hammond WA, Swaika A, Mody K. Pharmacologic resistance in colorectal cancer: a review. Ther Adv Med Oncol. 2016;8:57–84. doi: 10.1177/1758834015614530. - DOI - PMC - PubMed
    1. Bray LJ, Hutmacher DW, Bock N. Addressing patient specificity in the engineering of tumor models. Front Bioeng Biotechnol. 2019;7:217. doi: 10.3389/fbioe.2019.00217. - DOI - PMC - PubMed

Publication types

MeSH terms