. 2023 May 4;14(1):2575.
doi: 10.1038/s41467-023-38239-5.

Reversible transitions between noradrenergic and mesenchymal tumor identities define cell plasticity in neuroblastoma

Affiliations

Reversible transitions between noradrenergic and mesenchymal tumor identities define cell plasticity in neuroblastoma

Cécile Thirant et al. Nat Commun. .

Abstract

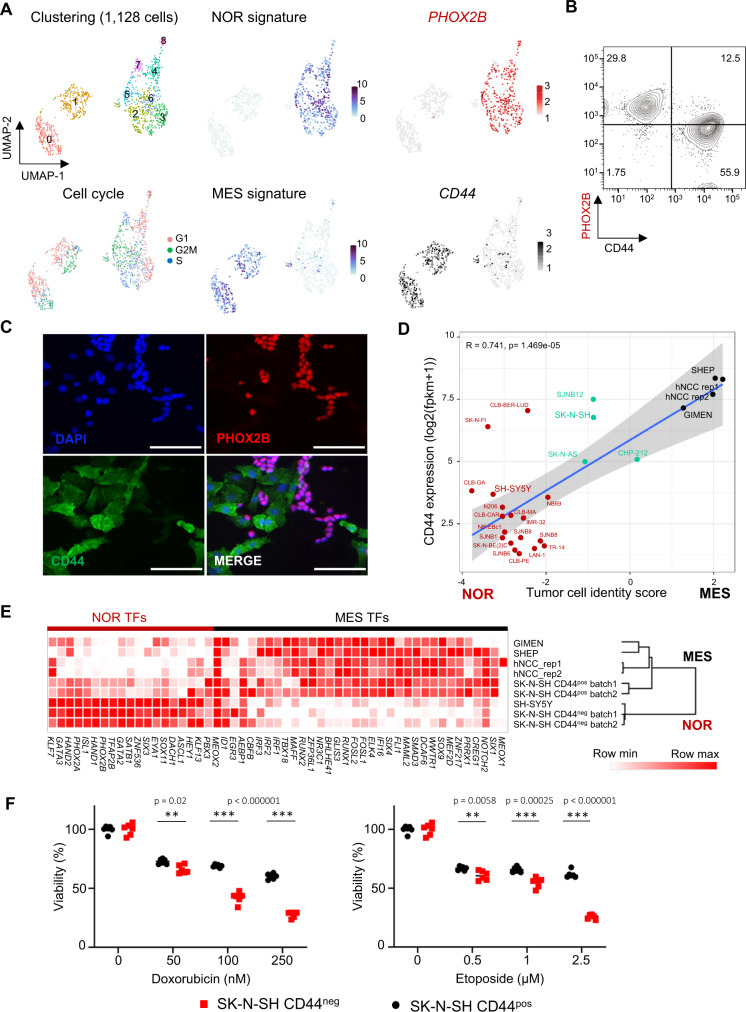
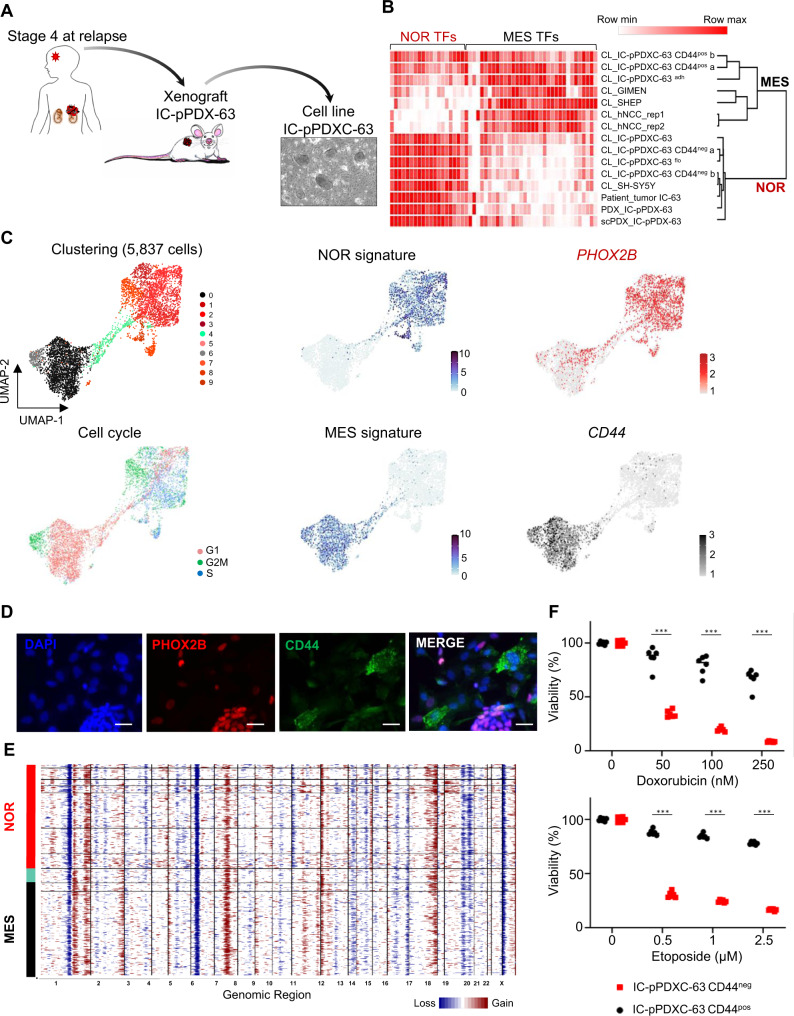
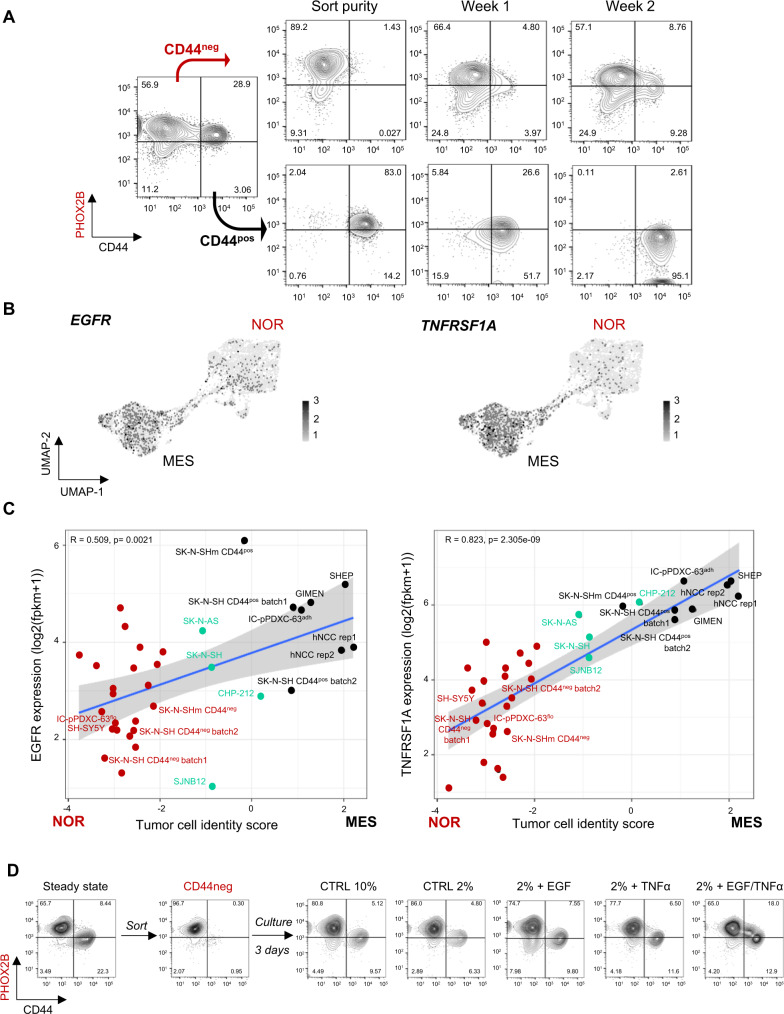
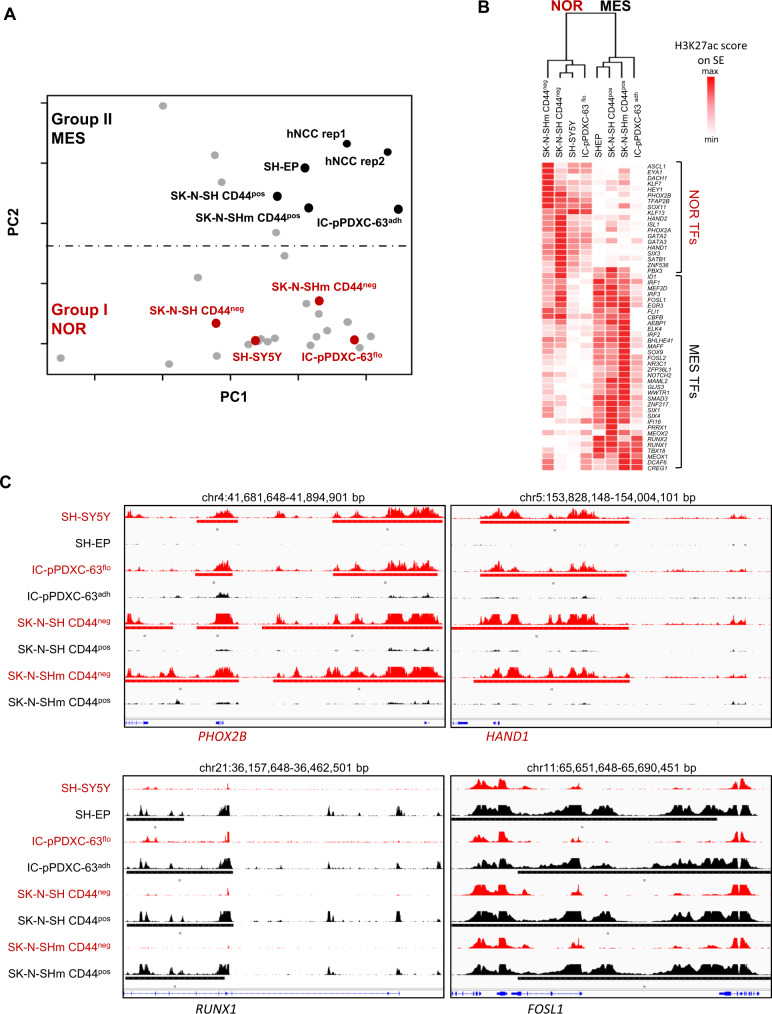
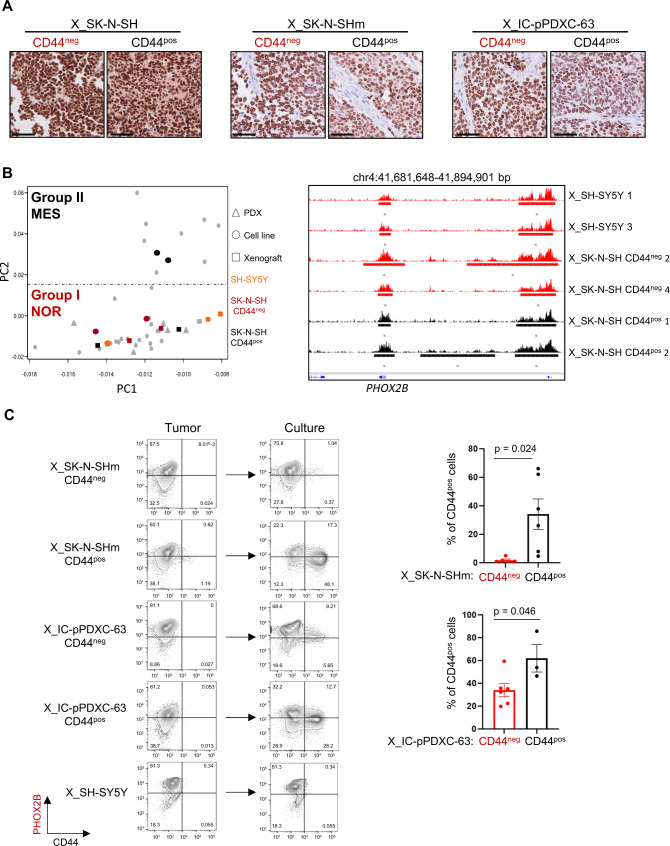
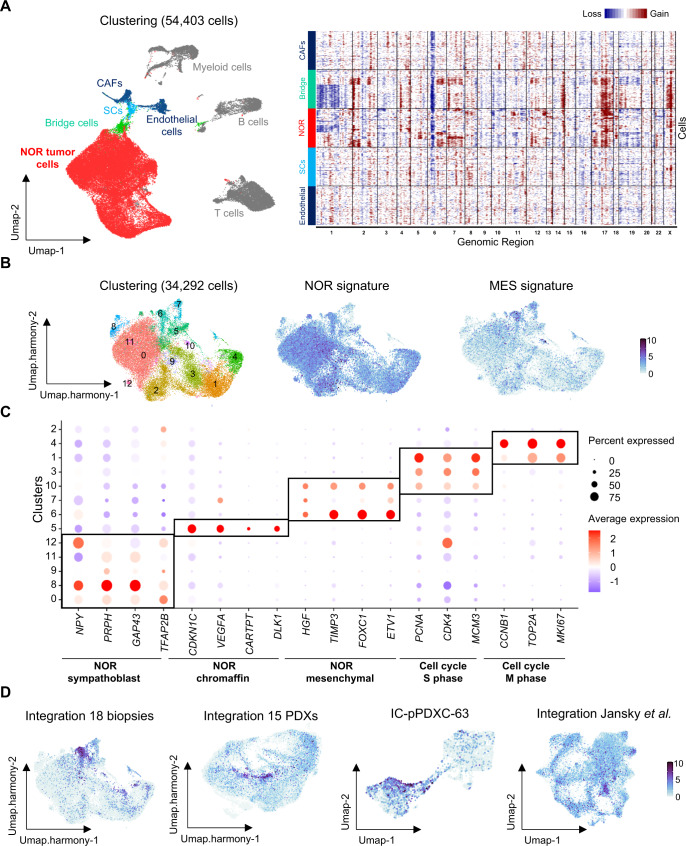
Noradrenergic and mesenchymal identities have been characterized in neuroblastoma cell lines according to their epigenetic landscapes and core regulatory circuitries. However, their relationship and relative contribution in patient tumors remain poorly defined. We now document spontaneous and reversible plasticity between the two identities, associated with epigenetic reprogramming, in several neuroblastoma models. Interestingly, xenografts with cells from each identity eventually harbor a noradrenergic phenotype suggesting that the microenvironment provides a powerful pressure towards this phenotype. Accordingly, such a noradrenergic cell identity is systematically observed in single-cell RNA-seq of 18 tumor biopsies and 15 PDX models. Yet, a subpopulation of these noradrenergic tumor cells presents with mesenchymal features that are shared with plasticity models, indicating that the plasticity described in these models has relevance in neuroblastoma patients. This work therefore emphasizes that intrinsic plasticity properties of neuroblastoma cells are dependent upon external cues of the environment to drive cell identity.


Conflict of interest statement

The authors declare no competing interests.

Figures

Fig. 1
Fig. 1. The cell surface marker CD44 discriminates noradrenergic and mesenchymal tumor cells in the SK-N-SH cell line.
NOR noradrenergic, MES mesenchymal. A Single-cell RNA-seq analysis by Seurat of the SK-N-SH cell line (batch 1). The umap plot shows the clustering at resolution 0.8 and the cell cycle score. Two main cell identities are highlighted by noradrenergic and mesenchymal transcription factor signatures, and PHOX2B and CD44 expression, respectively. Each cell identity includes cycling cells. B FACS analysis of the SK-N-SH cell line (batch 1) after cell permeabilization using PHOX2B and CD44 antibodies, gated in live cells after doublet exclusion. C Immunofluorescence analysis of the SK-N-SH cell line (batch 1) with the PHOX2B and CD44 markers (scale bar = 50 µm, representative of 3 independent experiments). D Scatterplot showing the correlation of CD44 expression by bulk RNAseq in each cell line with the tumor cell identity score (score MES - score NOR). Noradrenergic and mesenchymal scores correspond to the mean expression of transcription factors that define each identity. Simple linear regression line is shown, and gray cloud represents the 95% two-tailed confidence interval of the slope. The measure of linear association is given by Pearson’s product moment correlation production (r) with its associated p-value (t = 5.4123, df = 24, 95% CI for r [0.4966679, 0.8769103]). Color code: red = noradrenergic, black = mesenchymal, green =  intermediate cell lines. E Unsupervised clustering of samples using the expression of noradrenergic and mesenchymal transcription factors (TFs), on bulk RNAseq data indicates that CD44neg and CD44pos sorted cells exhibit a transcriptomic profile close to the noradrenergic SH-SY5Y and mesenchymal SH-EP, GIMEN or hNCC cells, respectively. Two independent replicates of SK-N-SH (batches 1 and 2) have been analyzed. F Mesenchymal/CD44pos sorted cells are more resistant to doxorubicin and etoposide than noradrenergic/CD44neg cells. Cell viability was measured by resazurin assay after 72 h of chemotherapy treatments (Doxorubicin 50, 100, 250 nM and Etoposide 0.5, 1, 2.5 µM) (mean ± sd; n = 6 replicates). P-values were determined via two-tailed unpaired Welch’s t-test. Source data are provided as a Source Data file.
Fig. 2
Fig. 2. IC-pPDXC-63 is an original model of phenotypic heterogeneity including noradrenergic and mesenchymal tumor identities.
NOR noradrenergic, MES mesenchymal. A Ex vivo culture of the noradrenergic IC-pPDX-63 neuroblastoma model established from a brain metastasis of a stage 4 case at relapse resulted in the IC-pPDXC-63 cell line that includes floating neurospheres and adherent cells as observed by contrast phase microscopy. B Heatmap and unsupervised clustering of samples (cell lines, patient tumors and PDXs) using the expression of transcription factors (TFs) of the noradrenergic and mesenchymal identities, on bulk RNAseq data. The transcriptomic profile of the IC-pPDX-63 model (bulk RNAseq of the PDX tumor (PDX) or from its single-cell (scPDX)) and its derived-cell line (CL_IC-pPDXC-63) are noradrenergic and highly similar to that of the matched patient tumor (IC-63) from which it has been generated. Two replicates of CD44pos and CD44neg cell sorts of the cell line are included (a and b). CL cell line, flo floating neurospheres, adh adherent cells. hNCC human neural crest cells. Source data are provided as a Source Data file. C Single-cell transcriptomic analyses of the IC-pPDXC-63 cell line by Seurat showing clustering at resolution 0.8, cell cycle phases, and the noradrenergic and mesenchymal identities highlighted by noradrenergic and mesenchymal transcription factor signatures, and PHOX2B and CD44 expression, respectively, plus a bridge in-between. D Immunofluorescence shows the specific expression of the PHOX2B and CD44 markers by neurospheres and adherent cells, respectively (scale bar = 20 µm, representative of 3 independent experiments). E Inferred genomic profile of the IC-pPDXC-63 cell line obtained with InferCNV on single-cell data. F Mesenchymal (IC-pPDXC-63 CD44pos) cells are more resistant to chemotherapy than noradrenergic (IC-pPDXC-63 CD44neg) cells. Cell viability was measured with resazurin assay after 72 h of chemotherapy treatments (Doxorubicin 50, 100, 250 nM and Etoposide 0.5, 1, 2.5 µM, mean ± sd; n = 6 replicates). P-values were determined via two-tailed unpaired Welch’s t-test (***p < 0.000001). Source data are provided as a Source Data file.
Fig. 3
Fig. 3. Noradrenergic to mesenchymal plasticity can be induced by extrinsic factors including EGF and TNFα.
NOR noradrenergic, MES mesenchymal. A Noradrenergic to mesenchymal shift of identity of the IC-pPDXC-63 cell line. Mesenchymal/CD44pos and noradrenergic/CD44neg cells were FACS sorted and cultured for two weeks. Only the CD44neg sorted population reconstituted a heterogeneous cell population after several days in culture. Representative FACS analyses of PHOX2B and CD44 staining gated on live cells after doublet exclusion are shown. B Umap plot of EGFR and TNFRSF1A gene expression in scRNAseq of IC-pPDXC-63. C Scatterplot showing the correlation of EGFR and TNFRSF1A gene expression by RNAseq in each cell line with the tumor cell identity score (score MES - score NOR). Noradrenergic and mesenchymal scores correspond to the mean expression of transcription factors that define each identity,. Simple linear regression line is shown, and gray cloud represents the 95% two-tailed confidence interval of the slope. The measure of linear association is given by Pearson’s product moment correlation production (r) with its p-value (TNFRSF1A: t = 8.1978, df = 32, 95% CI for r [0.6719094, 0.9083932]; EGFR: t = 3.3464, df = 32, 95% CI for r [0.2065378, 0.7228518]). Color code: red = noradrenergic, black = mesenchymal, green = intermediate cell lines. Source data are provided as a Source Data file. D Representative FACS analysis using PHOX2B and CD44 marker expression gated on live cells after doublet exclusion to follow the noradrenergic to mesenchymal shift of identity of the SK-N-SHm cell line. CD44neg cells were culture in control conditions (CTRL, 2% FBS) or with EGF and TNFα growth factors (20 nM each) for 48 h.
Fig. 4
Fig. 4. The noradrenergic to mesenchymal plasticity is associated with an epigenetic reprogramming.
NOR noradrenergic, MES mesenchymal. A Principal component (PC) analysis based on neuroblastoma and hNCC super-enhancer log scores that discriminates the two neuroblastoma cell groups I (noradrenergic) and II (NCC-like/mesenchymal) and in which were added the floating and adherent cells of the IC-pPDXC-63 and CD44neg and CD44pos sorted cells of the SK-N-SH cell line. B Heatmap showing the H3K27ac signal on the super-enhancer regions of the transcription factors (TFs) of the noradrenergic and mesenchymal identities, in the floating and adherent cells of the IC-pPDXC-63 cell line and in the CD44pos and CD44neg sorted cells of the SK-N-SH cell lines, and the SH-SY5Y and SH-EP control cell lines. For the TFs associated with several super-enhancers, the signal was summarized as described in the “Methods” section to have one value per TF. The unsupervised hierarchical clustering based on H3K27ac signals discriminated noradrenergic and mesenchymal cell identity. Source data are provided as a Source Data file. C IGV tracks of ChIP-seq profiles (scale 0-100) for H3K27ac at PHOX2B, HAND1, RUNX1, and FOSL1 super-enhancers in the SH-SY5Y, SH-EP, the floating and adherent IC-pPDXC-63 cells and the CD44pos and CD44neg sorted SK-N-SH and SK-N-SHm cells.
Fig. 5
Fig. 5. Reversible mesenchymal to noradrenergic shift in the SK-N-SH and IC-pPDXC-63 models.
NOR noradrenergic, MES mesenchymal, X xenograft. A PHOX2B immunohistochemistry of one representative mouse xenograft per group (obtained from CD44neg or CD44pos sorted cells of SK-N-SH, SK-N-SHm and IC-pPDXC-63 cell lines). Scale bar = 50 µm. Similar results were obtained for all analyzed xenografts. B Left: PCA based on super-enhancer log scores as in Fig. 4A in which were added the xenografts of the SH-SY5Y and the xenografts of the CD44pos or CD44neg sorted cells of the SK-N-SH cell line. Right: tracks of ChIP-seq profiles (scale 0-100) for H3K27ac at PHOX2B super-enhancer in the xenografts of the SH-SY5Y and SK-N-SH cell populations sorted according to CD44 expression. C Left panels: FACS analyses using PHOX2B and CD44 marker expression gated on live cells after doublet exclusion comparing the profile of cells from the xenograft tumor at ethical size and the same cells cultivated until they reached confluence. Conditions are SK-N-SHm and IC-pPDXC-63 cells, CD44pos or CD44neg FACS sorted before engraftment in mice, and SH-SY5Y. Right panels: Quantification of CD44pos cells by FACS after culture, mean ± sd; n = 6 replicates except for X_IC-pPDXC-63 CD44pos n = 3, unpaired two-tailed t-test, *p < 0.05, each dot corresponds to one xenograft. Source data are provided as a Source Data file.
Fig. 6
Fig. 6. Single-cell transcriptomic reveals a noradrenergic population with mesenchymal features in neuroblastoma patients.
NOR noradrenergic, MES mesenchymal. A (Left) Umap of the 54,403 cells from 18 biopsies integrated with Seurat. (Right) InferCNV analysis on 600 randomly selected cells from four clusters. Color code: gray = immune cells, dark blue = mesenchymal cells (endothelial cells and cancer-associated fibroblasts CAFs), light blue = Schwann cells (SCs), red = NOR tumor cells, green = bridge cells. B Umap of the clustering of the 34,292 tumor cells integrated with Harmony, extracted from the 18 biopsies. Plots of noradrenergic and mesenchymal transcription factor signatures,. C Dot plot graph illustrating cluster-specific gene expression. Three main tumor cell identities could be defined: noradrenergic tumor cells with either sympathoblast, chromaffin or mesenchymal features. D Plot of the signature identifying the noradrenergic cells with mesenchymal features composed of HGF, TIMP3, FOXC1, and ETV1 in the integration of single-cell RNAseq data of biopsies and PDXs, in the IC-pPDXC-63 cell line and in an independent cohort of 14 neuroblastoma cases already published.

References

    1. Matthay KK, et al. Neuroblastoma. Nat. Rev. Dis. Prim. 2016;2:16078. doi: 10.1038/nrdp.2016.78. - DOI - PubMed
    1. Brodeur GM. Neuroblastoma: biological insights into a clinical enigma. Nat. Rev. Cancer. 2003;3:203–216. doi: 10.1038/nrc1014. - DOI - PubMed
    1. Chen Y, et al. Oncogenic mutations of ALK kinase in neuroblastoma. Nature. 2008;455:971–974. doi: 10.1038/nature07399. - DOI - PubMed
    1. George RE, et al. Activating mutations in ALK provide a therapeutic target in neuroblastoma. Nature. 2008;455:975–978. doi: 10.1038/nature07397. - DOI - PMC - PubMed
    1. Janoueix-Lerosey I, et al. Somatic and germline activating mutations of the ALK kinase receptor in neuroblastoma. Nature. 2008;455:967–970. doi: 10.1038/nature07398. - DOI - PubMed

Publication types