. 2023 May 4;14(1):2573.
doi: 10.1038/s41467-023-38165-6.

Restoration of lysosomal acidification rescues autophagy and metabolic dysfunction in non-alcoholic fatty liver disease

Affiliations

Restoration of lysosomal acidification rescues autophagy and metabolic dysfunction in non-alcoholic fatty liver disease

Jialiu Zeng et al. Nat Commun. .

Abstract

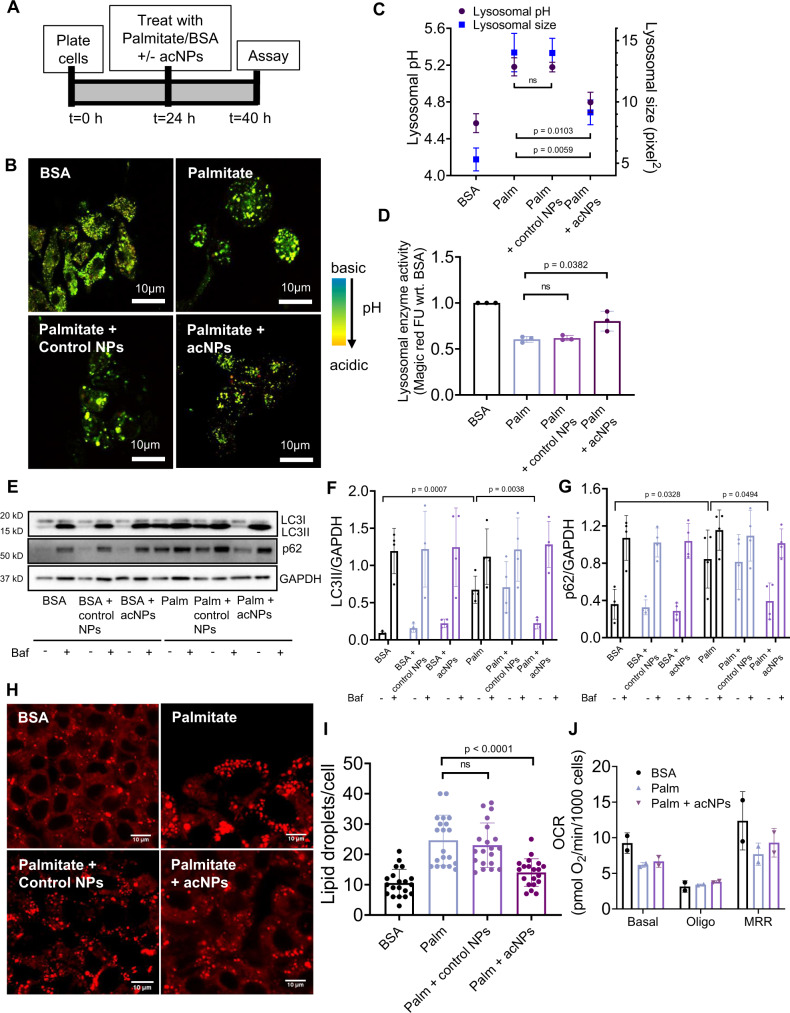
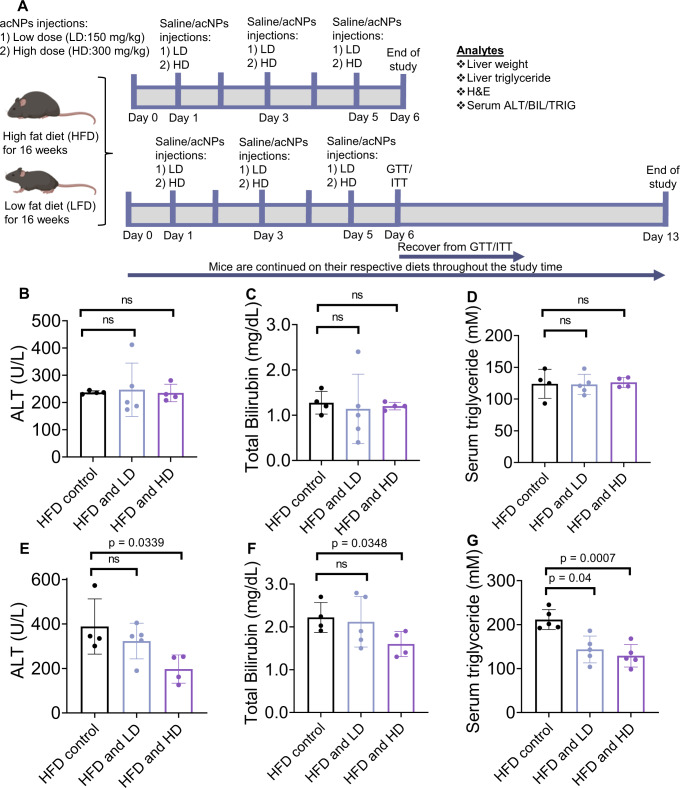
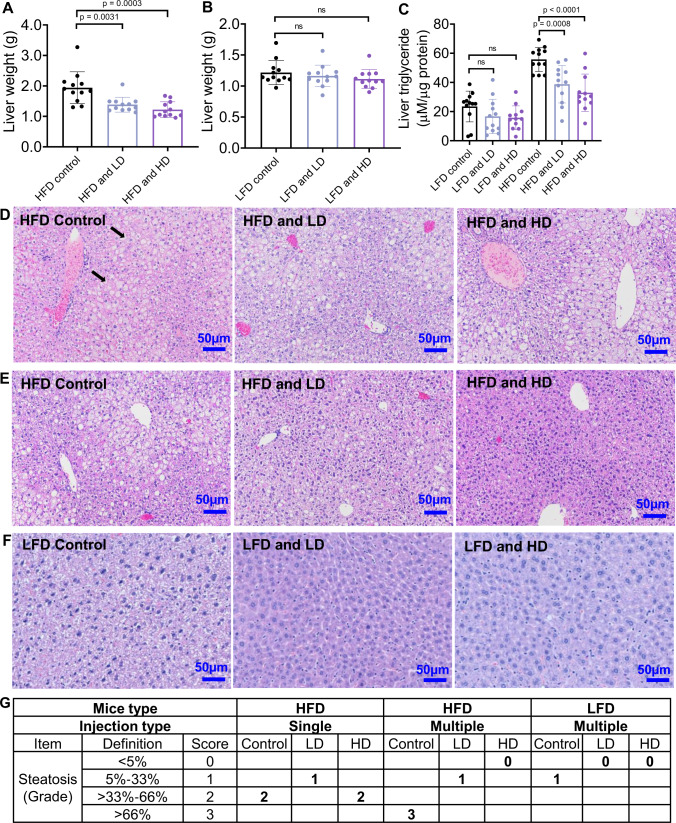
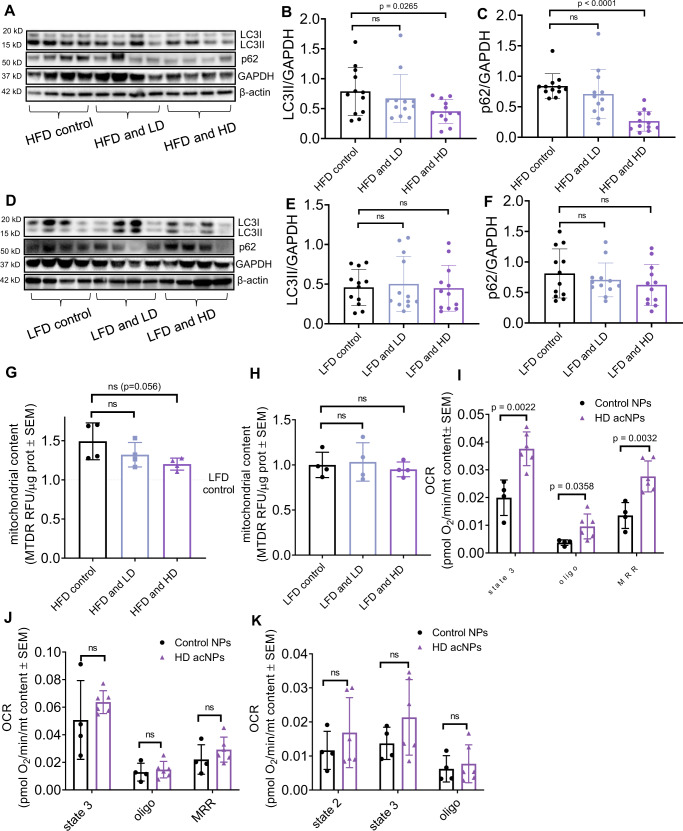
Non-alcoholic fatty liver disease (NAFLD) is the most common liver disease in the world. High levels of free fatty acids in the liver impair hepatic lysosomal acidification and reduce autophagic flux. We investigate whether restoration of lysosomal function in NAFLD recovers autophagic flux, mitochondrial function, and insulin sensitivity. Here, we report the synthesis of novel biodegradable acid-activated acidifying nanoparticles (acNPs) as a lysosome targeting treatment to restore lysosomal acidity and autophagy. The acNPs, composed of fluorinated polyesters, remain inactive at plasma pH, and only become activated in lysosomes after endocytosis. Specifically, they degrade at pH of ~6 characteristic of dysfunctional lysosomes, to further acidify and enhance the function of lysosomes. In established in vivo high fat diet mouse models of NAFLD, re-acidification of lysosomes via acNP treatment restores autophagy and mitochondria function to lean, healthy levels. This restoration, concurrent with reversal of fasting hyperglycemia and hepatic steatosis, indicates the potential use of acNPs as a first-in-kind therapeutic for NAFLD.


Conflict of interest statement

M.W.G., O.S.S., and J.L.Z. are co-inventors on a patent filed and granted in the United States Patent and Trademark Office (Patent number: US10925975B2) on the application of acidic nanoparticles as a treatment for lysosomal acidity compromised diseases. O.S.S. and M.W.G. are co-founders of Enspire Bio/Capacity Bio, which are testing the application of these acidic nanoparticles. The remaining authors declare no other competing interests.

Figures

Fig. 1
Fig. 1. The role of defective lysosomal function in NAFLD.
In an NAFLD liver, diet-induced obesity leads to increased plasma lipids accumulation, contributing to hepatic steatosis and lipotoxicity. Lipotoxicity affords impaired lysosomal acidification, lysosomal dysfunction, autophagic degradation dysfunction, and subsequent leads to impaired mitochondria function and lipid droplets accumulation. We hypothesize that acid nanoparticle (acNP) treatment inhibits impaired lysosomal acidification through restoration of lysosomal acidity, thereby restoring autophagic and mitochondria function, with a resultant decrease in lipid droplets accumulation and steatosis in NAFLD. This figure is created with BioRender.com<http://BioRender.com>.
Fig. 2
Fig. 2. Synthesis and characterization of acNPs.
A Synthesis route of PESU and PEFSU polymer using polycondensation. B Scanning electron micrograph images of the control NPs and acNPs show that they are of spherical morphology and size around 100 nm (N = 3 independent experiments). Bar, 200 nm. C pH changes of acNPs in 20 mM pH 6.0 and D pH 7.4 PBS buffers over a period of 48 h (N = 3 independent experiments). acNPs significantly acidified buffer within the first 24 h. E Fractional molecular weight changes of control NPs and acNPs in 20 mM pH 6.0 PBS buffer (N = 3 independent experiments). F Dependency of acNP toxicity on dose. Cells were incubated with a range of acNP concentrations for 24 h. acNPs up to 1000 μg/mL did not induce significant cell death. To avoid cytotoxicity, a treatment dose of 100 μg/mL was chosen for further studies (N = 3 independent experiments). G Quantification of rhodamine-labeled acNP (Rho-acNP) uptake in HepG2 cells by flow cytometry. Cellular uptake of Rho-acNPs occurs within 4 h, with complete uptake after 24 h of incubation (N = 3 independent experiments). H Representative confocal microscopy images of Rho-acNPs in HepG2 cells. Rho-acNPs (red channel) localize within the lysosomal compartments (LysoTracker; blue channel) of HepG2 cells. Bar, 10 μm (N = 3 independent experiments). Data are expressed as means ± SD. Source data are available as a Source Data file.
Fig. 3
Fig. 3. Treatment of HepG2 with acNPs reverses the defects in lysosomal acidity, cathepsin L activity and autophagic flux induced by lipotoxicity.
A Schematic of experimental protocol for cell treatment for 16 h before assaying for lysosomal acidity, autophagy, or cellular function. The indicated conditions are control BSA, 400 µM palmitate complexed to BSA, or 400 µM palmitate with control NPs and acNPs treatment. The 16 h timepoint is chosen because it shows the highest amount of autophagic flux inhibition in HepG2 cells under palmitate. B Representative confocal microscopy images of HepG2 cells treated with the indicated conditions and stained with 75 nM pH-sensitive Lysosensor dye to assess lysosome acidity. Bar, 10 μm. C Mean lysosomal pH and lysosomal area per cell for cells exposed to the indicated conditions were analyzed by MetaMorph® show significant restoration of lysosomal pH compared with palmitate cells (N = 3 independent experiments with n = 20 cells analyzed per condition). D Assessment of lysosomal cathepsin L activity by Magic red fluorescent substrate assay in HepG2 cells exposed to all the conditions showed significant restoration of lysosomal enzyme activity with acNPs treatment but not with control NPs treatment (N = 3 independent experiments). EG Representative western blot exposure images showing protein expression data for control NPs and acNPs treated to HepG2 cells, before and after addition of Bafilomycin A1 (Baf) (N = 4 independent experiments). H Representative confocal images of HepG2 cells stained with Nile Red dye for 15 min and imaged with fluorescence microscopy. Nile red dye accumulated quickly in the lipid vesicles. Bar, 10 μm. I Quantification of lipid vesicles number indicated significant reduction in lipid droplets density after acNPs treatment in HepG2 cells exposed to palmitate. Control NPs addition did not reduce lipid droplets (n = 20 cells analyzed per condition). J Mitochondria oxygen consumption rates in HepG2 cells under BSA, palmitate or palmitate with acNPs (N = 3 independent experiments). Two-tailed unpaired t-test (C, D, F, G, I, J); data are expressed as means ± SD, n.s. not statistically significant. Source data are available as a Source Data file.
Fig. 4
Fig. 4. AcNPs counteracts high-fat diet induced liver damage.
A Time chart of animal experiment with tail vein injection of acNPs. This schematic is created with BioRender.com<http://BioRender.com>. BD Liver ALT, BIL levels and triglyceride levels in HFD-fed C57BL/6J mice serum after a single injection of LD or HD acNPs or (EG) multiple injections of LD or HD acNPs for 6 days (n = 4 animals for HFD control, n = 5 animals for HFD and LD, n = 4 animals for HFD and HD). ALT and BIL levels do not change significantly as compared to control after single injection of either LD or HD acNPs, but decrease after multiple injections of HD acNPs, indicating no significant toxicity caused by acNPs. Serum triglyceride levels are decreased after multiple injections of LD or HD acNPs, indicating functional effect of acNPs in reducing serum triglyceride levels. Two-tailed unpaired t-test (AG); data are expressed as means ± SD. n.s. not statistically significant. Source data are available as a Source Data file.
Fig. 5
Fig. 5. Treatment with acNPs improves insulin sensitivity in high-fat diet-fed mice.
A Fasting insulin levels in mice serum. B Fasting c-peptide levels in mice serum. C Blood glucose response curves for low-fat diet (LFD) mice and D Insulin tolerance response curves for LFD mice. E Blood glucose response curves for high-fat diet (HFD) mice. Exact p-values between different treatment conditions are as follows: p = 0.0137 between HFD control and HFD and LD for 20 min timepoint, p = 0.0204 between HFD control and HFD and HD for 20 min timepoint. p = 0.0643 between HFD control and HFD and LD for 30 min timepoint, p = 0.0101 between HFD control and HFD and HD for 30 min timepoint. p = 0.0074 between HFD control and HFD and LD for 60 min timepoint, p = 0.0013 between HFD control and HFD and HD for 60 min timepoint. p = 0.0143 between HFD control and HFD and LD for 90 min timepoint, p = 0.0011 between HFD control and HFD and HD for 90 min timepoint. p = 0.0131 between HFD control and HFD and LD for 120 min timepoint, p = 0.0015 between HFD control and HFD and HD for 120 min timepoint. F Area under curve (AUC) of ipGTT. High-dose acNPs (HD) show greater improvement in blood glucose response compared to HFD control. G Insulin tolerance response curves for HFD mice. Exact p-values between different treatment conditions are as follows: p = 0.006 between HFD control and HFD and LD at 30 min timepoint, p = 0.0068 between HFD control and HFD and HD at 30 min timepoint. p = 0.0212 between HFD control and HFD and LD at 60 min timepoint, p = 0.0042 between HFD control and HFD and HD at 60 min timepoint. p = 0.0016 between HFD control and HFD and LD at 90 min timepoint, p = 0.0057 between HFD control and HFD and HD at 90 min timepoint. p = 0.0020 between HFD control and HFD and LD at 120 min timepoint, p = 0.0199 between HFD and HFD and HD at 120 min timepoint. For AG, n = 11 animals for LFD control group, n = 11 animals for LFD and LD group, n = 12 animals for LFD and HD, n = 10 animals for HFD control group, n = 11 animals for HFD and LD group, n = 12 for HFD and HD group. Two-tailed unpaired t-test (AG); data are expressed as means ± SD. *p < 0.05, **p < 0.01, ***p < 0.001, ****p < 0.0001, n.s. not statistically significant. Source data are available as a Source Data file.
Fig. 6
Fig. 6. Treatment with acNPs reverses liver steatosis in high-fat diet-fed mice.
A Multiple injections of LD or HD acNPs to mice result in significant liver weight reduction, with more significant reductions with  HD acNPs (n = 12 animals per group). B Multiple injections of LD or HD acNPs to LFD mice do not result in significant liver reduction (n = 12 animals per group). C Liver triglycerides level measured in mice across all treatment conditions (n = 12 animals per group). LD and HD acNPs result in liver triglyceride reduction, with HD acNPs having a greater response. Two-tailed unpaired t-test (A, B, C); data are expressed as means ± SD. n.s. not statistically significant. DF Representative H & E stains of mice liver tissue slices from different treatments. Bar, 50 μm. Black arrows indicate lipid droplets or microvesicular steatosis (n = 3 animals were used for each treatment condition). G The degree of steatosis is determined with a histopathological grid (Supplementary Table. 3) and scored blindly by a pathologist. Source data are available as a Source Data file.
Fig. 7
Fig. 7. AcNPs improve autophagic flux and mitochondrial oxidative capacity in high-fat diet-fed mice.
AC Representative western blot exposure images showing protein expression of LC3II and p62 in HFD mice (n = 12 animals per treatment group). DF Representative western blot exposure images showing protein expression of LC3II and p62 in LFD mice (n = 12 animals per treatment group). G Mitochondria content of mice livers under HFD, HFD and LD acNP, and HFD and HD acNP treatments (n = 4 animals per treatment group). H Mitochondria content of mice livers under LFD, LFD and LD acNP, and LFD and HD acNP treatments (n = 4 animals per treatment group). I Oxygen consumption rate of mice liver lysates mitochondria in pyruvate-malate substrate (n = 4 animals in control NPs group, n = 6 animals in HD acNPs group). J Succinate-rotenone substrate (n = 4 animals in control NPs group, n = 6 animals in HD acNPs group), and K Palmitoyl-L-carnitine substrate (n = 4 animals in control NPs group, n = 6 animals in HD acNPs group). Oligo: Oligomycin, MRR: Maximal respiratory rate. Two-tailed unpaired t-test (B, C, E, F, G, H, I, J, K); data are expressed as means ± SD. n.s. not statistically significant. Source data are available as a Source Data file.

References

    1. Ahmed M. Non-alcoholic fatty liver disease in 2015. World J. Hepatol. 2015;7:1450–1459. doi: 10.4254/wjh.v7.i11.1450. - DOI - PMC - PubMed
    1. Bozorgzadeh A, et al. Survival outcomes in liver transplantation for hepatocellular carcinoma, comparing impact of hepatitis C versus other etiology of cirrhosis. Liver Transplant. 2007;13:807–813. doi: 10.1002/lt.21054. - DOI - PubMed
    1. Chitturi S. Treatment options for nonalcoholic Fatty liver disease. Therap. Adv. Gastroenterol. 2008;1:173–189. doi: 10.1177/1756283X08096951. - DOI - PMC - PubMed
    1. Cassidy S, Syed BA. Nonalcoholic steatohepatitis (NASH) drugs market. Nat. Rev. Drug Discov. 2016;15:745–746. doi: 10.1038/nrd.2016.188. - DOI - PubMed
    1. Portillo-Sanchez P, Cusi K. Treatment of Nonalcoholic Fatty Liver Disease (NAFLD) in patients with type 2 diabetes mellitus. Clin. Diabetes Endocrinol. 2016;2:9. doi: 10.1186/s40842-016-0027-7. - DOI - PMC - PubMed

Publication types