. 2023 May 4;13(1):7266.
doi: 10.1038/s41598-023-33367-w.

Integrated gene expression profiles reveal a transcriptomic network underlying the thermogenic response in adipose tissue

Affiliations

Integrated gene expression profiles reveal a transcriptomic network underlying the thermogenic response in adipose tissue

Jordi Rodó et al. Sci Rep. .

Abstract

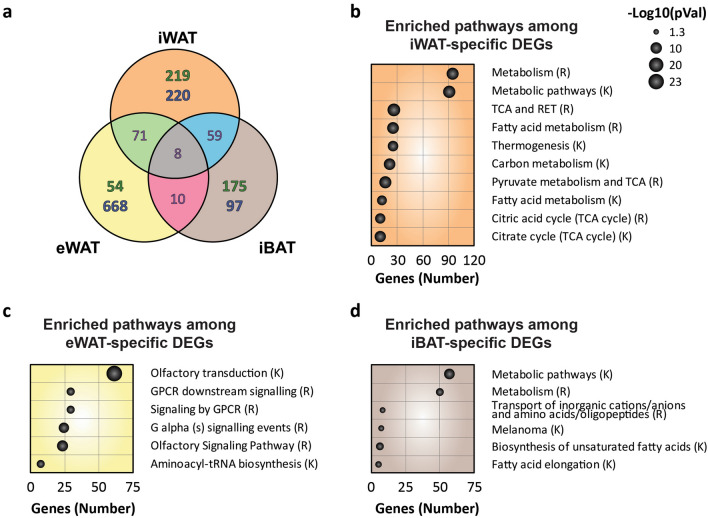
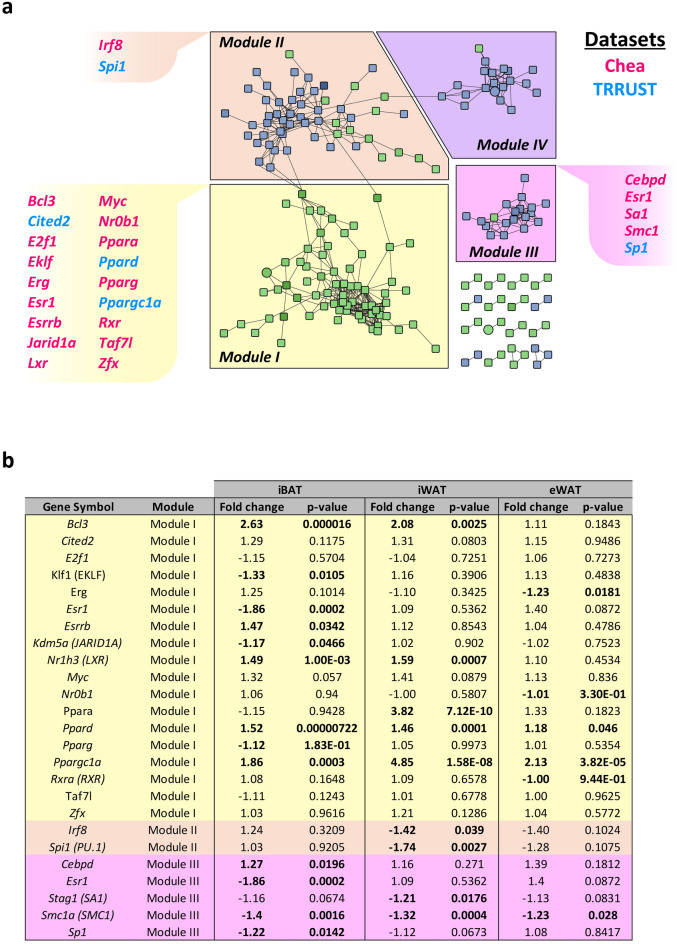
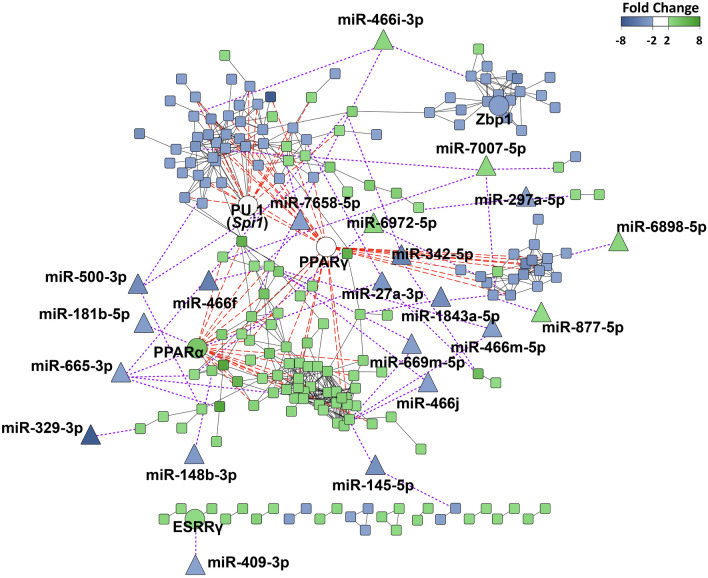
Obesity and type 2 diabetes are two closely related diseases representing a serious threat worldwide. An increase in metabolic rate through enhancement of non-shivering thermogenesis in adipose tissue may represent a potential therapeutic strategy. Nevertheless, a better understanding of thermogenesis transcriptional regulation is needed to allow the development of new effective treatments. Here, we aimed to characterize the specific transcriptomic response of white and brown adipose tissues after thermogenic induction. Using cold exposure to induce thermogenesis in mice, we identified mRNAs and miRNAs that were differentially expressed in several adipose depots. In addition, integration of transcriptomic data in regulatory networks of miRNAs and transcription factors allowed the identification of key nodes likely controlling metabolism and immune response. Moreover, we identified the putative role of the transcription factor PU.1 in the regulation of PPARγ-mediated thermogenic response of subcutaneous white adipose tissue. Therefore, the present study provides new insights into the molecular mechanisms that regulate non-shivering thermogenesis.


Conflict of interest statement

The authors declare no competing interests.

Figures

Figure 1
Figure 1
Gene expression analysis of different adipose tissue depots from mice exposed to cold. (a) Visualization of the data variance by principal component analysis. (b-d) Volcano plot displaying -log10 (p-value) vs. fold change of each gene expressed in (b) eWAT, (c) iWAT, and (d) iBAT. Green dots highlight significantly upregulated genes. Blue dots highlight significantly downregulated genes. The number of significant upregulated and downregulated genes are indicated in the top right and left corners, respectively. Data were obtained from two groups of mice that were either exposed to cold (4 °C) or maintained at room temperature (22 °C) for 4 days (n = 4/group).
Figure 2
Figure 2
Functional analysis of depot-specific differentially expressed genes. (a) Set relationship analysis reporting the number of DEGs that were specific or common among the different adipose tissue depots. Highlighted in green: number of upregulated DEGs; Highlighted in blue: number of downregulated DEGs. (b) Ten most numerous enriched pathways among the iWAT-specific differentially expressed genes. (c-d) Pathways enriched among the (c) eWAT-specific and (d) iBAT-specific differentially expressed genes. -Log10 of the p-value correlates with the area of each ball, and the number of enriched genes of each pathway is indicated in the x-axis. RET respiratory electron transport. TCA tricarboxylic acid cycle. (R); Reactome. (K); KEGG Pathways. Data were obtained from two groups of mice that were either exposed to cold (4 °C) or maintained at room temperature (22 °C) for 4 days (n = 4/group).
Figure 3
Figure 3
Protein‑protein interaction network of DEGs and module function identification. (a) The network of protein–protein interactions among the iWAT-specific differentially expressed genes, (b) among the eWAT-specific differentially expressed genes, and (c) among the iBAT-specific differentially expressed genes. (df) Fifteen most numerous enriched pathways among the encoding genes of the proteins located in (d) iWAT module I, (e) iWAT module II, and (f) iWAT module III. (g) Pathways enriched among the encoding genes of the proteins located in iWAT module IV. Green nodes indicate upregulated DEGs and blue nodes indicated downregulated DEGs. Edges stand for the regulatory association between any 2 nodes. Closer edges indicate stronger interaction validation. − Log10 of the p-value correlates with the area of each ball, and the number of enriched genes of each pathway is indicated in the x-axis. RET respiratory electron transport. TCA tricarboxylic acid cycle. NAFLD non-alcoholic fatty liver disease. C-CR cytokine-cytokine receptor, Ab Antibody. (R); Reactome. (K); KEGG Pathways.
Figure 4
Figure 4
Transcription factors with a putative regulatory role in the iWAT-specific DEGs network. (a) Putative regulatory transcription factors determined by ChEA (pink) or TRRUST (light blue) are indicated for each iWAT module. (b) Fold change and p-values of the different selected transcription factors for each tissue. Factors with a significant differential expression were highlighted in bold.
Figure 5
Figure 5
miRNA expression analysis of different adipose tissue depots from mice exposed to cold. (ac) Volcano plot displaying -log10 (p-value) vs. fold change of each gene expressed in (a) eWAT, (b) iWAT, and (c) iBAT. Green dots highlight upregulated genes. Blue dots highlight downregulated genes. The number of upregulated and downregulated genes are indicated in the top right and left corners, respectively. (d) Set relationship analysis reporting the number of miRNAs that were specific or common among the different adipose tissue depots. Highlighted in green: number of upregulated genes; Highlighted in blue: number of downregulated genes.
Figure 6
Figure 6
Regulatory network of the iWAT-specific differentially expressed genes. The regulatory network of the iWAT-specific DEGs was generated using the Cytoscape v3.9 software (https://cytoscape.org). Square nodes represent genes, circular nodes represent transcription factors and triangular nodes represent miRNAs. Long red dashed lines indicate interactions between transcription factors and genes. Short purple dashed lines indicate interactions between miRNAs and genes. Black lines indicate interactions between genes.

References

    1. Müller TD, Blüher M, Tschöp MH, DiMarchi RD. Anti-obesity drug discovery: Advances and challenges. Nat. Rev. Drug Discov. 2022;21:201–223. doi: 10.1038/s41573-021-00337-8. - DOI - PMC - PubMed
    1. Chondronikola M, et al. Brown adipose tissue improves whole-body glucose homeostasis and insulin sensitivity in humans. Diabetes. 2014;63:4089–4099. doi: 10.2337/db14-0746. - DOI - PMC - PubMed
    1. Matsushita M, et al. Impact of brown adipose tissue on body fatness and glucose metabolism in healthy humans. Int. J. Obes. 2014;38:812–817. doi: 10.1038/ijo.2013.206. - DOI - PubMed
    1. Becher T, et al. Brown adipose tissue is associated with cardiometabolic health. Nat. Med. 2021;27:58–65. doi: 10.1038/s41591-020-1126-7. - DOI - PMC - PubMed
    1. Wu J, et al. Beige adipocytes are a distinct type of thermogenic fat cell in mouse and human. Cell. 2012;150:366–376. doi: 10.1016/j.cell.2012.05.016. - DOI - PMC - PubMed

Publication types