. 2023 May 4;13(1):7282.
doi: 10.1038/s41598-023-34457-5.

Raman spectroscopy and topological machine learning for cancer grading

Affiliations

Raman spectroscopy and topological machine learning for cancer grading

Francesco Conti et al. Sci Rep. .

Abstract

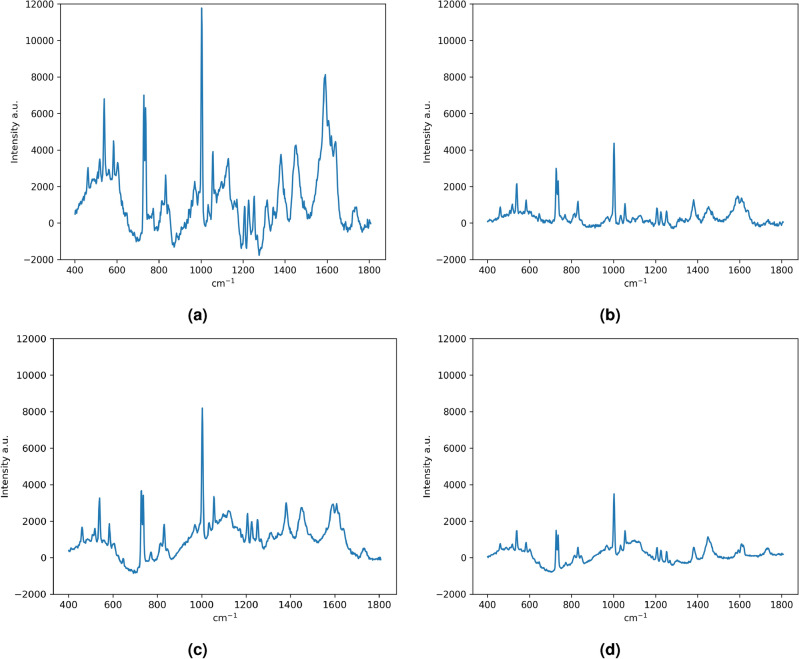
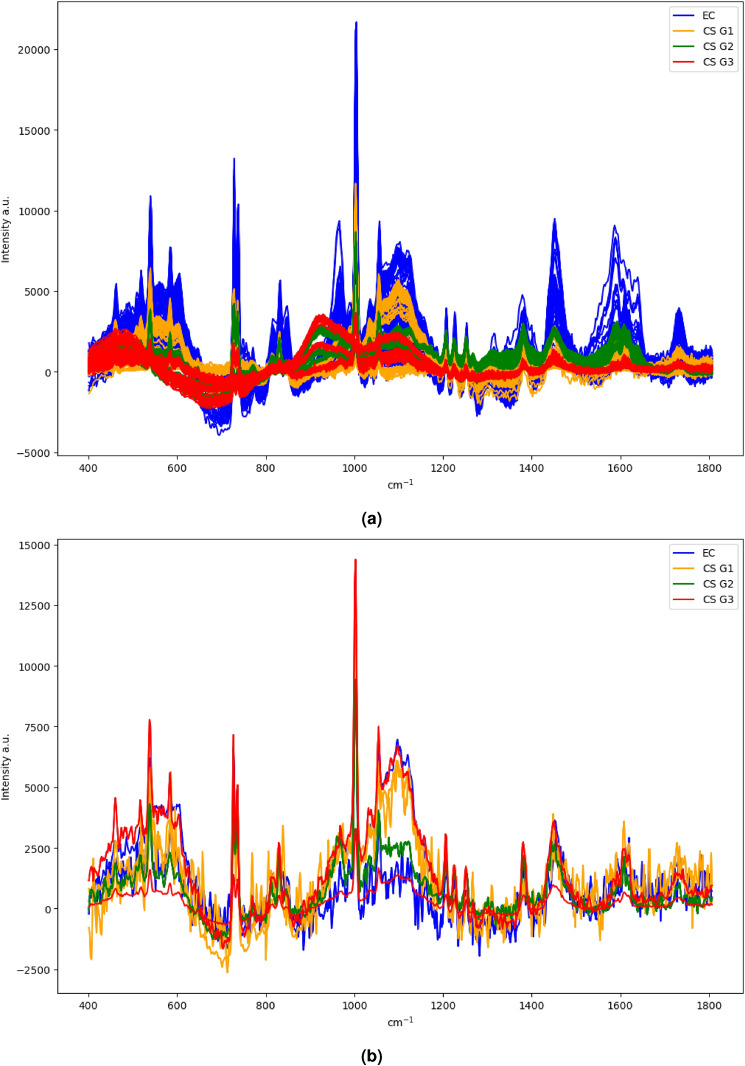
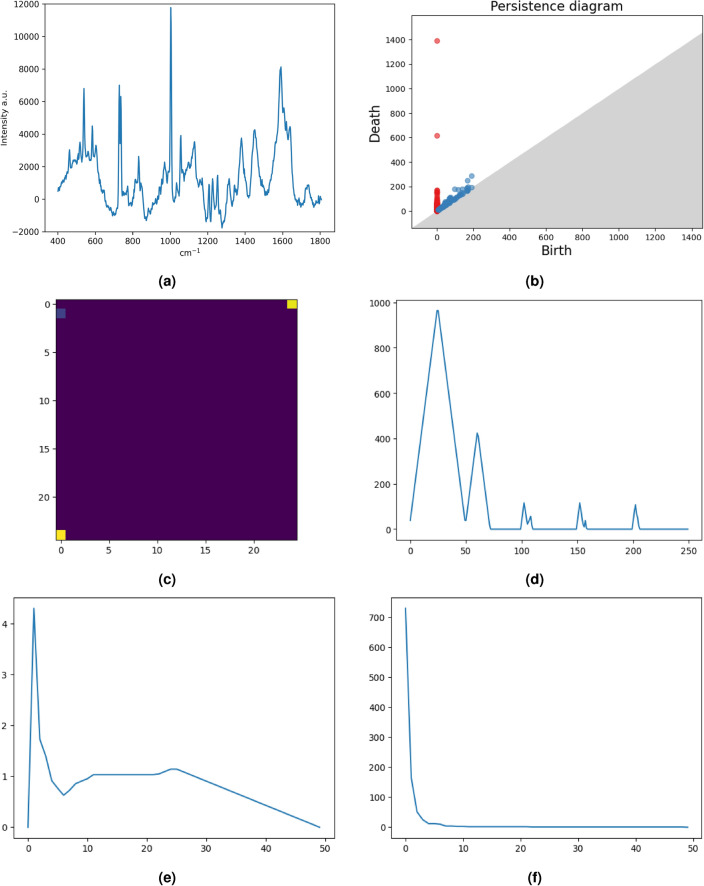
In the last decade, Raman Spectroscopy is establishing itself as a highly promising technique for the classification of tumour tissues as it allows to obtain the biochemical maps of the tissues under investigation, making it possible to observe changes among different tissues in terms of biochemical constituents (proteins, lipid structures, DNA, vitamins, and so on). In this paper, we aim to show that techniques emerging from the cross-fertilization of persistent homology and machine learning can support the classification of Raman spectra extracted from cancerous tissues for tumour grading. In more detail, topological features of Raman spectra and machine learning classifiers are trained in combination as an automatic classification pipeline in order to select the best-performing pair. The case study is the grading of chondrosarcoma in four classes: cross and leave-one-patient-out validations have been used to assess the classification accuracy of the method. The binary classification achieves a validation accuracy of 81% and a test accuracy of 90%. Moreover, the test dataset has been collected at a different time and with different equipment. Such results are achieved by a support vector classifier trained with the Betti Curve representation of the topological features extracted from the Raman spectra, and are excellent compared with the existing literature. The added value of such results is that the model for the prediction of the chondrosarcoma grading could easily be implemented in clinical practice, possibly integrated into the acquisition system.


Conflict of interest statement

The authors declare no competing interests.

Figures

Figure 1
Figure 1
Representative histologic images of the tumours analyzed in this study (hematoxylin and eosin staining). EC (a); CS G1 (b); CS G2 (c); CS G3 (d).
Figure 2
Figure 2
Representative Raman spectra of the tumors analyzed in this study. EC (a); CS G1 (b); CS G2 (c); CS G3 (d).
Figure 3
Figure 3
The entirety of Raman spectra coming from Dataset 1 (a) and from Dataset 2 (b).
Figure 4
Figure 4
Data space at different scale resolutions (i.e. different radii) and the associated k-dimensional voids. The collection of such features forms the persistence diagram. Credits: Shafie Gholizadeh and Wlodek Zadrozny via A Tutorial on Topological Data Analysis in Text Mining.
Figure 5
Figure 5
The pipeline for a topological study of digital data in a machine learning context. A filtration associates a persistence diagram with the digital data. The persistence diagram is then vectorized by means of various vectorization methods. Finally, the vector is fed to a machine learning classifier.
Figure 6
Figure 6
Pipeline application for the Raman spectra of chondrogenic tumours. The Raman spectra (a) and the persistence diagram associated (b). In the second and third rows, four different vectorization methods for the same PD, namely Persistence Image (c), Persistence Landscape (d), Persistence Silhouette (e) and Betti Curve (f).
Figure 7
Figure 7
Confusion matrices for binary classification EC vs. CS of the best classifier coming from “LOPO validation 2 labels (EC vs. CS)” section (a) and the confusion matrix from the best classifier trained on all Dataset 1 (b).
Figure 8
Figure 8
Confusion matrices with 4 labels predicted by the best classifier coming from “LOPO validation 4 labels” section (a) and the confusion matrix from the best classifier trained on all Dataset 1 (b).

References

    1. Short M, et al. Changes in nuclei and peritumoral collagen within nodular basal cell carcinomas via confocal micro-Raman spectroscopy. J. Biomed. Opt. 2006;11:340004–34013. doi: 10.1117/1.2209549. - DOI - PubMed
    1. Long D. The Raman Effect. Wiley; 2002.
    1. Bergholt M, et al. Raman endoscopy for in vivo differentiation between benign and malignant ulcers in the stomach. Analyst. 2010;135:3162–3168. doi: 10.1039/c0an00336k. - DOI - PubMed
    1. Bergholt M, et al. Raman endoscopy for objective diagnosis for early cancer in the gastrointestinal system. J. Gastroint. Dig. Syst. 2013;S1:008.
    1. Kong K, Kendall C, Stone N, Notingher I. Raman spectroscopy for medical diagnostics-from in vitro biofluid assays to in-vivo cancer detection. Adv. Drug Deliv. Rev. 2015;89:121–134. doi: 10.1016/j.addr.2015.03.009. - DOI - PubMed

Publication types