. 2024 Feb;42(2):265-274.
doi: 10.1038/s41587-023-01759-y. Epub 2023 May 4.

Engineered phage with antibacterial CRISPR-Cas selectively reduce E. coli burden in mice

Affiliations

Engineered phage with antibacterial CRISPR-Cas selectively reduce E. coli burden in mice

Yilmaz Emre Gencay et al. Nat Biotechnol. 2024 Feb.

Abstract

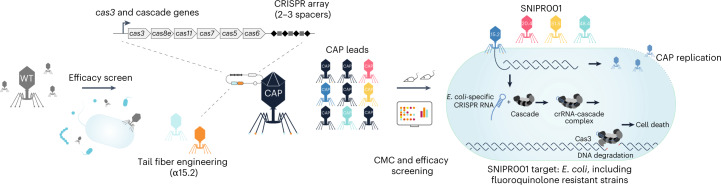
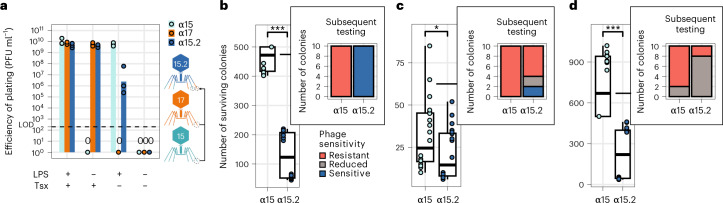
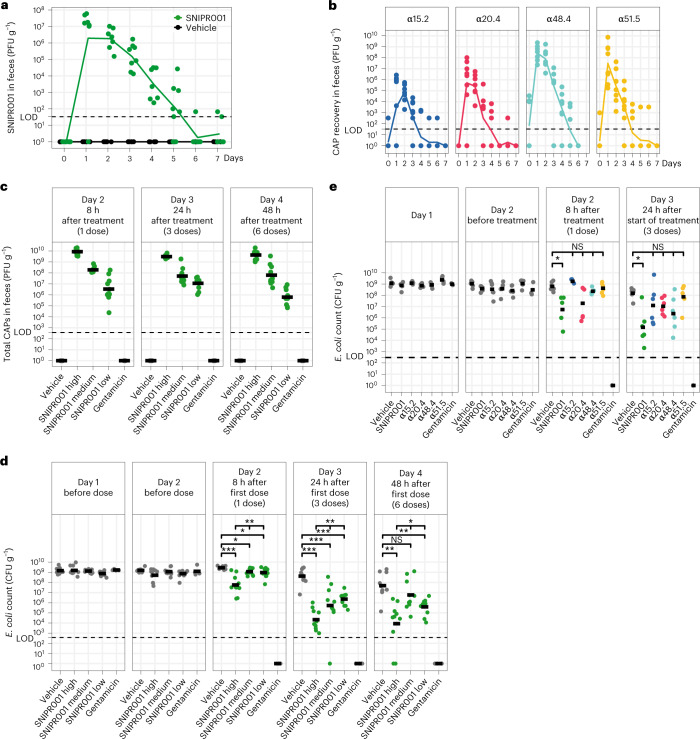
Antibiotic treatments have detrimental effects on the microbiome and lead to antibiotic resistance. To develop a phage therapy against a diverse range of clinically relevant Escherichia coli, we screened a library of 162 wild-type (WT) phages, identifying eight phages with broad coverage of E. coli, complementary binding to bacterial surface receptors, and the capability to stably carry inserted cargo. Selected phages were engineered with tail fibers and CRISPR-Cas machinery to specifically target E. coli. We show that engineered phages target bacteria in biofilms, reduce the emergence of phage-tolerant E. coli and out-compete their ancestral WT phages in coculture experiments. A combination of the four most complementary bacteriophages, called SNIPR001, is well tolerated in both mouse models and minipigs and reduces E. coli load in the mouse gut better than its constituent components separately. SNIPR001 is in clinical development to selectively kill E. coli, which may cause fatal infections in hematological cancer patients.


Conflict of interest statement

All authors affiliated with SNIPR Biome are present or past employees of SNIPR Biome and maybe share- or warrant holders. F.S. and T.B.D. are subcontractors of SNIPR Biome. M.J.S. received research funding from Merck, Biomérieux and SNIPR Biome. M.J.S. is an unpaid consultant for SNIPR Biome and has been consulting for Shionogi and participated on a Data Safety Monitoring Board for AbbVie. Patent applications have been filed based on material described in this article. SNIPR, CRISPR-Guided Vectors and CGV are trademarks of SNIPR Biome ApS. Data not included in the publication is commercially sensitive as SNIPR Biome is in the process of securing patent protection for these aspects, which precludes their inclusion in the paper at this stage. Upon request, SNIPR Biome is willing to share all data with other parties with no competing interest.

Figures

Fig. 1
Fig. 1. An overview of the SNIPR001 creation process.
First, WT phages are screened against a panel of E. coli strains. Then, phages with broad activity against E. coli are tail fiber engineered and/or armed with CRISPR–Cas systems containing sequences specific to E. coli, creating CAPs. These CAPs are then tested for host range, in vivo efficacy and CMC specifications. SNIPR001 comprises four complementary CAPs and is a new precision antibiotic that selectively targets E. coli to prevent bacteremia in hematological cancer patients at risk of neutropenia.
Fig. 2
Fig. 2. Wild type phage screening and development funnel.
a, Heatmap showing the potency of 162 WT phages (horizontal axis) against 82 E. coli strains (vertical axis) based on growth kinetics. iAUC values are shown as a gradient of green. Phage genome size based on the sequencing data is shown in the top bar graph. For a selected group of phages, the cognate bacterial receptor protein was determined and shown in the bottom panel. The phage taxonomical classification based on the sequencing data is annotated in the bottom bar. The top tree shows the relationship between the phages based on their growth kinetics. The eight phages that were selected for engineering (α15, α17, α20, α31, α33, α46, α48 and α51) are highlighted by circles, four of those (α15, α20, α48 and α51) that form the basis of SNIPR001 are colored green. b, Overall development funnel of SNIPR001 starting with the 162 WT phages and, after engineering and selection assays, resulting in final cocktail of four CAPs in SNIPR001 with per CAP details described in Extended Data Table 1a.
Fig. 3
Fig. 3. Tail fiber engineering.
a, EoP results of LPS-dependent WT α15, Tsx-dependent WT α17 and engineered CAP α15.2 that consolidates both WT phages’ receptors. Presented titers (PFU ml−1) were obtained from independent biological triplicates as dots, with averages illustrated as bars. bd, Lawn kill assay results of E. coli are shown as boxplots, whiskers indicate maximum and minimum values, box bounds indicate 25th and 75th percentile, with center line indicating the median; b1460 (b), b1475 (c), b1813 (d) with phages WT α15 and CAP α15.2. Significances *P < 0.05 and ***P < 0.001, P values (two-sided Mann–Whitney U test) were calculated from two independent biological duplicates comprised of ten replicates. Holm’s method adjusted P values are 1.59 × 10−7, 3.36 × 10−2 and 1.6 × 10−7 for b1460, b1475 and b1813, respectively. Distribution of 10 EoP profiles of survivor colonies purified from WT α15 lawn kill assay (bd insets). Resistant, no plaque formation with tested phage; sensitive, EoP similar to that of parental strain; reduced, EoP (>1–2 log10) lower than that of the parental strain.
Fig. 4
Fig. 4. CRISPR-Cas-mediated E. coli elimination, activity in biofilms, and CAP competitive advantage.
a, CRISPR–Cas-driven elimination of an abbreviated panel of 82 E. coli clinical isolates by conjugation of CGV-EcCAS (green) or empty vector (gray). The conjugation efficiency was determined by spotting a dilution series of the conjugation reaction on LB agar supplemented with antibiotics (n = 3 indicated by dots). The LOD was 200 CFU ml−1. b, Reduction of the metabolic activity of biofilms by CGVs that differed only in the promoter driving the expression of the CRISPR–Cas system, which are targeting the bacterial chromosome. Experiments were carried out in triplicate, measuring the relative metabolic activity between expression without a promoter and a given promoter. Average relative activities for PrelB and PbolA were significantly different and illustrated as dots, with averages illustrated as bars (two-sided Student’s t-test, P = 0.0052) 83.7 ± 6.7%, and 45.3 ± 2.5%. cf, RT-qPCR showing increasing levels of cas3 transcripts relative to housekeeping gene gapA transcripts (replicates as dots, averages as bars) in negative correlation with decreasing number of unabsorbed phages over time in a synchronized infection (replicates as crosses, averages as lines). Cas3 activity is measured as ratio of cas3 transcripts relative to gapA transcripts, and number of unabsorbed phages in PFU ml−1. The results shown are the average of two independent biological replicates with technical triplicates. Bars or lines, respectively, indicate average values of these replicates, with error bars indicating standard deviation. g, Fraction of CAP and WT phage during coculture with a host strain susceptible to both phages. CAP α15.2 increases its relative abundance compared to the WT phage from 7% to 86% over two consecutive passages. h, CAP α20.4 outcompeted WT α20 by increasing its relative abundance during coculture with the common target E. coli strain b230 from 10% to 68% over four consecutive passages. g,h, The ratio of CAP and WT phage during coculture with a host strain (E. coli b230) susceptible to α15.2, α15, α20.4 and α20. CAP α15.2 increase its relative abundance compared to the WT phage from 7% to 86% (g) while CAP α 20.4 outcompeted WT α20WT from 10% to 68% (h).
Fig. 5
Fig. 5. In vitro validation of SNIPR001 on clinical E. coli strains.
a, An unrooted phylogenetic tree of the JMI strains displaying a clinical panel of 382 E. coli strains encompassing nine phylogroups and 118 MLSTs. Plaquing data reflects a single plaquing replicate. One strain, E. coli b4038, with a long branch (indicated by a break) has been truncated to 37% of the original length. Phylogenetic distance scale indicated below the phylogenetic tree, as computed by MASH. b, A spot assay was used to analyze the efficacy of SNIPR001 against the clinical panel of 382 E. coli strains (from JMI Laboratories) isolated from bloodstream infections and the internal 429 E. coli strain panel. The spot assay was conducted as two independent experiments, with bars indicating average cumulative panel fraction and dots indicating the results of each duplicate relative to prior means. c, Coverage of SNIPR001 does not depend on antibiotic-resistant phenotypes; consequently, SNIPR001 targets > 90% of E. coli strains that are carbapenem resistant, ESBL-producing or MDR, and 89% of fluoroquinolone-resistant E. coli strains. Numbers indicated in each green or gray bar indicate the number of bacteria susceptible or resistant to SNIPR001, respectively, for each resistance category generated from a screening of 382 strains and subset to the number of strains with a given resistance. d, A midpoint-rooted phylogenetic tree of the 72 fluoroquinolone-resistant E. coli strains isolated from fecal samples of hematological cancer patients. A total of 67 of the 72 strains are susceptible to at least one of the four CAPS in SNIPR001. Plaquing results are generated by the conservative consensus between two runs of plaquing, that is displaying the outcome with lower plaquing efficiency. e, Redundancy distribution showing 82% of the fluoroquinolone-resistant E. coli strains (n = 72) from d are targeted by at least two different CAPs.
Fig. 6
Fig. 6. SNIPR001 in vivo evaluation in mice and minipigs.
a, CAP recovery in minipigs feces after a single p.o. dose of 2 × 1012 PFU of SNIPR001 (n = 8, green) or vehicle (n = 6, gray) over 1 week with daily sampling. Trend lines indicate average recovered phage in PFU per gram feces, dots indicate individual measurement points. LOD of 33 PFU g−1 feces indicated by the dotted line. b, CAP recovery in minipig feces after a single p.o. dose of 2 × 1012 PFU of a single CAP (n = 8 minipigs received either α15.2, α20.4 or α51.5; n = 7 minipigs received α48.4) over 1 week with daily sampling. Trend lines indicate average recovery, while points indicate individual measurements. Recovery was measured in PFU per gram feces. LOD of 33 PFU g−1 feces (dotted line). c, CAP recovery in mouse feces 8 h, 24 h and 48 h after the start of treatment with three times daily administration of varying doses of SNIPR001 (n = 10 for low, medium and high, green), vehicle (n = 10, gray), or gentamicin (n = 4, gray). Recovery is measured in PFU g−1 feces, LOD of 371 PFU g−1 feces (dotted line). d, E. coli b17 recovery in mouse feces indicates increased SNIPR001 effect with increased dose; color legend and group sizes are the same as in c. *P < 0.05, **P < 0.01, ***P < 0.001; statistical analyses were performed using two-sided Kruskal–Wallis tests for comparison of all SNIPR001-treated groups, two-sided Mann–Whitney U test was used for comparison of treated groups with vehicle corrected using Holm’s method separately for each day. The exact P values are shown in Extended Data Table 5. Recovery is measured in CFU per gram feces, with a LOD of 371 CFU g−1 feces. Animals that have begun SNIPR001 treatment are indicated in green, others in gray. e, E. coli b17 recovery in mouse feces 8 h and 24 h after the start of treatment with three times daily administration of CAPs α15.2, α20.4, α48.4 or α51.5 (n = 6 for each CAP) and in combination as SNIPR001 (n = 6) confirming synergy of the CAPs, as well as vehicle (n = 6), and gentamicin (n = 3). Differences in CFU per gram tested by a two-sided Mann–Whitney U test, P values corrected with Holm’s method. Adjusted P values for comparisons of vehicle and SNIPR001 are both 0.022 for days 2 and 3.

Comment in

  • A master phage cocktail.
    Taglialegna A. Taglialegna A. Nat Rev Microbiol. 2023 Jul;21(7):411. doi: 10.1038/s41579-023-00910-5. Nat Rev Microbiol. 2023. PMID: 37173543 No abstract available.
  • Armed phages are heading for clinical trials.
    Lewis JM, Sagona AP. Lewis JM, et al. Nat Microbiol. 2023 Jul;8(7):1191-1192. doi: 10.1038/s41564-023-01415-w. Nat Microbiol. 2023. PMID: 37308593 No abstract available.

References

    1. Pulte D, Jansen L, Brenner H. Changes in long term survival after diagnosis with common hematologic malignancies in the early 21st century. Blood Cancer J. 2020;10:56. - PMC - PubMed
    1. Riley M, et al. Epidemiology and burden of mucosal barrier injury laboratory-confirmed bloodstream infections in bone marrow transplant and hematology-oncology units. Am. J. Infect. Control. 2017;45:S38.
    1. Dandoy CE, et al. Incidence, risk factors, and outcomes of patients who develop mucosal barrier injury–laboratory confirmed bloodstream infections in the first 100 days after allogeneic hematopoietic stem cell transplant. JAMA Netw. Open. 2020;3:e1918668. - PMC - PubMed
    1. Velden WJFM, Herbers AHE, Netea MG, Blijlevens NMA. Mucosal barrier injury, fever and infection in neutropenic patients with cancer: introducing the paradigm febrile mucositis. Br. J. Haematol. 2014;167:441–452. - PubMed
    1. Girmenia C, et al. Incidence, risk factors and outcome of pre-engraftment gram-negative bacteremia after allogeneic and autologous hematopoietic stem cell transplantation: an italian prospective multicenter survey. Clin. Infect. Dis. 2017;65:1884–1896. - PubMed

Substances

LinkOut - more resources