. 2023 Jun;20(6):925-934.
doi: 10.1038/s41592-023-01863-6. Epub 2023 May 4.

Glutamate indicators with improved activation kinetics and localization for imaging synaptic transmission

Affiliations

Glutamate indicators with improved activation kinetics and localization for imaging synaptic transmission

Abhi Aggarwal et al. Nat Methods. 2023 Jun.

Abstract

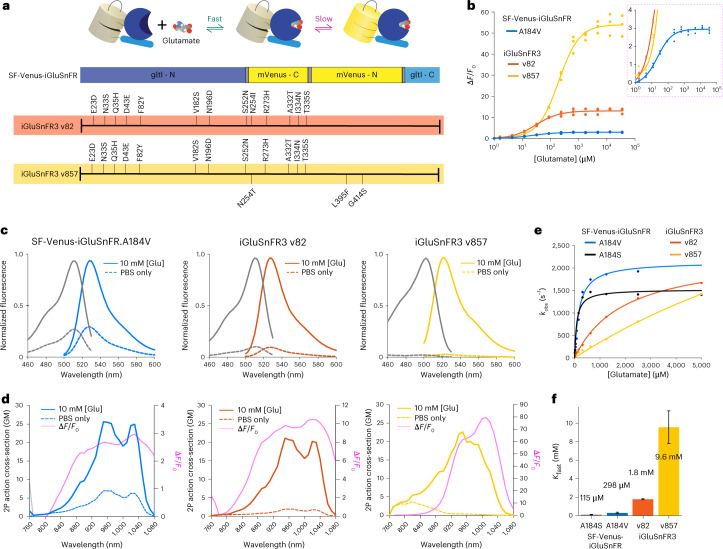
The fluorescent glutamate indicator iGluSnFR enables imaging of neurotransmission with genetic and molecular specificity. However, existing iGluSnFR variants exhibit low in vivo signal-to-noise ratios, saturating activation kinetics and exclusion from postsynaptic densities. Using a multiassay screen in bacteria, soluble protein and cultured neurons, we generated variants with improved signal-to-noise ratios and kinetics. We developed surface display constructs that improve iGluSnFR's nanoscopic localization to postsynapses. The resulting indicator iGluSnFR3 exhibits rapid nonsaturating activation kinetics and reports synaptic glutamate release with decreased saturation and increased specificity versus extrasynaptic signals in cultured neurons. Simultaneous imaging and electrophysiology at individual boutons in mouse visual cortex showed that iGluSnFR3 transients report single action potentials with high specificity. In vibrissal sensory cortex layer 4, we used iGluSnFR3 to characterize distinct patterns of touch-evoked feedforward input from thalamocortical boutons and both feedforward and recurrent input onto L4 cortical neuron dendritic spines.


Conflict of interest statement

The authors declare no competing interests.

Figures

Fig. 1
Fig. 1. Photophysical properties of iGluSnFR3 variants.
a, The top shows that iGluSnFR consists of a circularly permuted fluorescent protein (yellow) inserted between interacting N- and C-terminal domains of the bacterial periplasmic glutamate–aspartate binding protein gltI (blue). The dim unbound indicator rapidly binds glutamate, then undergoes a slower transition to a highly fluorescent state. The bottom shows the locations of amino acid substitutions of iGluSnFR3 variants v82 (red) and v857 (yellow) relative to the parent variant SF-Venus.iGluSnFR.A184V. b, Glutamate titrations of purified iGluSnFR protein. The right panel is a zoom-in view. n = 3 titration series. c, One-photon excitation and emission spectra of soluble SF-Venus-iGluSnFR.A184V, v82 and v857 in the presence (10 mM) and absence of glutamate. d, 2P excitation spectra and ΔF/F0 of the iGluSnFR3 variants in the presence (10 mM) and absence of glutamate. Pink lines are computed ΔF/F0. e, Stopped-flow measurements of initial ON rate (kobs) showing different degrees of kinetic saturation for SF-iGluSnFR and iGluSnFR3 variants. f, Estimated Kfast, the glutamate concentration that half-saturates the indicator’s initial rapid binding equilibrium. The inferred value of Kfast for v857 is outside the tested concentration range, making it uncertain. Error bars denote least squares fit ± s.e.m.
Fig. 2
Fig. 2. Characterization of iGluSnFR3 in cultured neurons.
a, Images of primary cultures expressing surface-displayed SF-Venus-iGluSnFR-A184V (blue), v82 (red) and v857 (yellow) under hSyn promoter before stimulation and at peak brightness after field stimulations of 1 and 20 APs, at 21 °C. Scale bar, 100 μm. b, Mean pixel brightness traces for stimulations of 1, 5, 10, 20 and 160 APs at 80 Hz. c, 10–90% rise time of the three variants for the 1 AP condition. d, Peak ΔF/F0 of the three variants across conditions. e, Time-integrated SNR for the three variants across conditions. Traces and error bars denote mean ± s.e.m., n = 40 culture wells for each variant.
Fig. 3
Fig. 3. Imaging and manipulating synaptic release.
a, The top shows a representative epifluorescence image of v857-expressing neuronal culture. Bottom, zoom of soma (1) and neurites (2) with corresponding correlation images showing release sites. b, Traces for individual sites in the same recording, each normalized to its standard deviation (s.d.), ordered by SNR. Sites ranked 1–20 and 491–500 are shown. The bottom shows a zoom of region highlighted in cyan above. c, Detected site density, event rate and SNR for WT and iGluSnFR3 variants expressed using hSyn.minDisplay. n = 9 FOV (v82 and v857); 8 FOV (WT), three culture wells per variant. Boxplots show mean (black line), 25th–75th percentile (box), 5th–95th percentile (whiskers), remaining points individual. *P < 0.01, two-sided Wilcoxon test versus WT. d, Kymographs of optical minis for v82 (left n = 96 sites) and v857 (right n = 2,862 sites). Scale bars, 100 ms. e, The left shows the optical mini ΔF/F0 as a function of distance from peak for v82 and v857, calculated one frame after onset. The right shows the optical mini ΔF/F0 as a function of time for v82 and v857, calculated one pixel from the center. n = 96 sites, v82; n = 2,862 sites, v857. Shading denotes s.e.m. d1/2 is the distance to half-maximum response. FWHM, full-width at half-maximum. **P < 1 × 10−4, bootstrap test (two-sided). f, Overlaid transmission (grayscale) and fluorescence images of sparsely transfected iGluSnFR+mRuby-synapsin culture. g, Representative mRuby-synapsin image (left) and iGluSnFR response (five APs at 50 Hz, right) for SF-iGluSnFR.A184V (top) and v857 (bottom). White arrows indicate putative crosstalk sites. h, Representative ΔF/F0 of SF-iGluSnFR.A184V and v857 for one-AP field stimulation at bath [Ca2+] of 1.3 and 3.5 mM. i, The one-AP (1AP) responses on cells expressing SF-iGluSnFR.A184V (left) or v857 (right) cotransfected with TeNT (cyan) or control (black). A184V: n = 16 cells, A184V + TeNT: n = 16 cells; v857: n = 16 cells; v857+TeNT: n = 16 cells. V857: P = 4.9 × 10−4; A184V: P = 0.83, two-sided paired Wilcoxon test. j, Representative ΔF/F0 images of SF-iGluSnFR.A184V and v857 in axons for 1AP field stimulation, control (top) and cotransfected with TeNT (bottom). k, 1AP evoked responses at individual boutons expressing SF-iGluSnFR.A184V (left) and v857 (right) with bath [Ca2+] of 1.3 mM (black) and 3.5 mM (red). n = 7 cells per variant. v857, P = 2.0 × 10−3; A184V, P = 0.13. Two-sided paired Wilcoxon test. e,i,k, Line denotes mean; shading denotes s.e.m. Scale bars, 20 μm (a); 8 μm (f); 100 ms (i,k); 2 μm (g,h,j).
Fig. 4
Fig. 4. Membrane targeting sequence effects on synaptic responses and localization.
a, SNR of optical minis in culture for v857, expressed using PDGFR transmembrane domain (pMinDisplay) and each of 15 other display constructs. Black lines denote means. n = 9 FOV over three wells per construct. *, **GPICOBL9, P = 0.0222; GPINGR, P = 0.0003; SGZ, P = 0.0101; two-sided two-sample t-tests versus PDGFR. b, Sequence schematics for PDGFR, GPI and SGZ display constructs. PDGFR is a C-terminal fusion to the PDGFR transmembrane domain in the mammalian expression pMinDisplay vector. GPI contains a C-terminal glycosylphosphatidylinositol anchor. SGZ contains the PDGFR transmembrane domain, followed by a modified form of the cytosolic C-terminal domain of SGZ including a terminal PDZ ligand. c, Representative maximum intensity projection image of a portion of an expanded gel of mouse cortical tissue expressing v857.SGZ, immunostained for GFP (green), Homer1 (red) and Bassoon (blue). Scale bar, 5 μm expanded. d, Images of single representative synapses and aligned averages for the three iGluSnFR variants. For each image, immunostains for GFP (green), Homer1 (red) and Bassoon (blue) are shown on the left, and the GFP channel is shown on the right. Scale bars, 1 μm expanded. e, Cumulative probability plot of the ratio of GFP signal at the synapse center to that within a 3 × 6 µm2 (expanded) postsynaptic region. Means: PDGFR: 1.43 ± 0.05; GPI: 1.57 ± 0.05, P = 0.037; SGZ: 1.78 ± 0.04, n = 292 (PDGFR), 256 (GPI) and 273 (SGZ) synapses. *P < 0.05, **P < 0.01 Kolmogorov–Smirnov test (two-sided).
Fig. 5
Fig. 5. In vivo imaging and electrophysiology in visual cortex.
a, The left shows the experimental schematic for simultaneous 2P axonal imaging and cell-attached recording in vivo. The right shows a z-projection of iGluSnFR3.v857-labeled neuron in mouse V1, with axon traced in yellow. Scale bar, 50 μm. b, 2P imaging of individual boutons and simultaneous cell-attached recordings from representative neurons labeled with SF-iGluSnFR.A184S (top, ‘A184S’) and v857 (bottom). The inset shows v857 response during a rapid spike train. Scale bars, 2 μm and 100 ms (inset). c, Spike-triggered averages for isolated APs measured with v857 (bottom) and A184S (top); mean ± s.e.m. of n = 10 consecutive events from recording in b. d, Amplitude (P = 1.1 × 10−4), full-width half-maximum (FWHM) (P = 1.6 × 10−5), rise time (P = 0.002) and decay τ (P = 1.6 × 10−5) of responses for isolated APs for v857 (n = 16 boutons from five neurons) and A184S (n = 11 boutons from five neurons); Wilcoxon tests (two-sided). e, The left and middle show histograms of amplitudes for single-AP events and in absence of APs for example boutons shown in b. The right shows a comparison of the non-AP event rate for v857 (yellow) and A184S (blue) as a function of detection threshold (mean ± s.e.m., n = 6 boutons for v857 and n = 5 boutons for A184S). f, Simultaneous v857 imaging (yellow) and cell-attached recording for three neighboring boutons recorded at 500 Hz each. Asterisks indicate putative synaptic release failures. Scale bar, 2 μm. g, Amplitude distribution of deconvolved AP responses for boutons shown in f. h, Experimental schematic for in vivo imaging of responses to visual motion stimuli in V1 dendrites. i, The left shows a L2/3 neuron dendrite expressing A184S and corresponding pixelwise tuning map (hue, preferred direction; saturation, OSI and lightness, response magnitude). The right shows the spine responses evoked by drifting gratings with directions indicated above. Numbers correspond to spines indicated at left. j, Same as i but from a v857-expressing neuron in a different mouse. Color scales for tuning map are identical to i. k, Response amplitudes for v857 and A184S (0.6140 (0.4620–0.8162) versus 0.2944 (0.2164–0.3925), P = 1.2 × 10−67, Wilcoxon test (two-sided), n = 261 ROI from five neurons for v857 and n = 375 ROI from five neurons for A184S). Boxplots denote median and interquartile range, outliers beyond 1.5 interquartile plotted separately. Scale bars in i,j, 2 μm.
Fig. 6
Fig. 6. AO glutamate imaging of thalamocortical boutons and dendritic spines in vS1 L4.
a, Schematic of AAV injection in VPM (left) in WT mice to express iGluSnFR on thalamocortical boutons and, separately, injection into vibrissa cortex (right) in Scnn1a-Tg3-Cre mice to express iGluSnFR on dendrites of L4 cortical neurons. b, Schematic of the air-puff stimulation in awake mice during high-speed AO2P imaging. Frame rates were roughly 250 Hz for boutons (ce, ik) and roughly 130 Hz for spines (fh). ce, Comparison of iGluSnFR variants in thalamocortical boutons across stimulation frequencies. c, The left shows an average image of thalamocortical axons in L4 labeled by SF-iGluSnFR.A184V (top) and v857.GPI (bottom). The right shows a normalized pixelwise standard deviation (s.d.) across 1-s averaged epochs from 60 trials. Scale bar, 10 μm. d, Mean responses (60 trials) for boutons shown in c labeled by v857.GPI (top) and A184V (bottom). e, Response amplitudes of boutons labeled with iGluSnFR3 and SF-iGluSnFR variants: v857.GPI (three mice, 389 boutons), v857.PDGFR (three mice, 314 boutons), v82.GPI (two mice, 312 boutons), A184V (three mice, 239 boutons) and Venus-A184V (two mice, 355 boutons). Line indicates root-mean-square (r.m.s.) noise level for v857.GPI. ***P < 0.001; NS, not significant; one-way analysis of variance followed by Bonferroni’s test. fh, Measurement of response lags for v857.GPI-labeled L4 spines to 5 Hz vibrissal stimulation. f, Mean (left) and s.d. (right) images of L4 v857.GPI-labeled spines. Scale bar, 10 μm. g, The left shows a cross-correlation of signals from two active spines highlighted at right. The right shows a pixelwise lag of peak response relative to the recording’s dominant mode. h, Time series from spines identified in g with a representative trial in gray and mean in black. ik, Same as fh for thalamocortical boutons labeled with v857.GPI: mean and s.d. images scale bar, 10 μm (i), correlation and spatial coherence (j) and time series (k). I, Lag of peak response for thalamocortical boutons (123 ROI) and dendritic spines (145 ROI) in L4 vibrissal cortex, violin plot. A time of 0 denotes an electronic trigger to the air-puff valve, the red dashed line indicates the measured onset of vibrissal deflection. m, Response amplitudes of thalamocortical boutons (123 ROI) and dendritic spines (145 ROI), violin plot. (e,l,m) Boxplots denote median and interquartile range, outliers beyond 1.5 interquartiles are plotted separately.
Extended Data Fig. 1
Extended Data Fig. 1. In vitro specificity of soluble proteins SF-Venus-iGluSnFR-A184V (blue, top), iGluSnFR3.v82 (red, middle) and iGluSnFR3.v857 (yellow, bottom).
a, e, i) ∆F/F0 of the three biosensors for additions of L-amino acids (10 mM concentration, pH 7.3, buffered in PBS). Zoom-in shows titrations for glutamate (black) and aspartate (orange). b, f, j) ∆F/F0 for additions of common neurotransmitters (GABA, Acetylcholine, L-DOPA, Dopamine, D-serine; 10 mM concentration, pH 7.3, buffered in PBS). c, g, k) ∆F/F0 for additions of glutamatergic drugs (DNQX [10 mM], D-AP5 [500 µM], DL-TBOA [4 mM], NBQX [1 mM], NMDA [10 mM], CNQX [4 mM], Kainate [4 mM]) in the absence of glutamate and d, h, l) in presence of glutamate (10 mM, pH 7.3).
Extended Data Fig. 2
Extended Data Fig. 2. In vitro pH titration of soluble proteins.
a) SF-Venus-iGluSnFR-A184V (left), b) iGluSnFR3 v82 (middle) and c) iGluSnFR v857 (right). Solid lines: saturating glutamate (10 mM, pH 7.3 buffered in PBS); Dotted lines: absence of glutamate. Sigmoidal fits are overlaid. Black lines show ∆F/F0 as a function of pH. All measurements were made using purified soluble protein; N = 3 titration series of a single protein sample for each measurement. Data obtained from fitting are presented in Supplementary Table 1.
Extended Data Fig. 3
Extended Data Fig. 3. In vitro glutamate titration of soluble proteins.
a) SF-Venus-iGluSnFR.A184V, b) v82 and c) v857 (pH 7.3), with corresponding fits and dissociation constants (KD). N = 3 titration series of a single protein sample for each variant.
Extended Data Fig. 4
Extended Data Fig. 4. Molecular brightness (kcps/molecule) of iGluSnFR variants.
Measurements using fluorescence correlation spectroscopy (FCS) at a) 950 nm and b) 1030 nm at varying power. All measurements were made using purified soluble protein in the glutamate-bound state.
Extended Data Fig. 5
Extended Data Fig. 5. Glutamate titrations.
a) Titrations of WT (SF-Venus-iGluSnFR-A184V), iGluSnFR3.v82 and iGluSnFR3.v857 on the surface of cultured hippocampal neurons. Baseline, 100 mM glutamate, and ∆F/F0 heat maps shown. b) ∆F/F0 affinity curves. ‘APO’ represents brightness in imaging buffer without added glutamate. ∆F/F0 is computed as fractional change in intensity of entire field of view (FOV) relative to corresponding APO image. The points are fit using a sigmoidal curve.
Extended Data Fig. 6
Extended Data Fig. 6. Long-duration recording of optical minis with iGluSnFR3.v857.
Primary culture expressing iGluSnFR3.v857 was recorded with a spinning disk confocal microscope. (top) Inset images show frames from the beginning and end of the recording on the same intensity scale. Yellow circle denotes the site for which the traces below are plotted. Bottom, raw intensity trace for the highlighted site. Red and blue insets show zoom of highlighted regions at beginning and end of the recording, respectively.
Extended Data Fig. 7
Extended Data Fig. 7. Photostability of iGluSnFR3 and SF-Venus-iGluSnFR.A184V under 2P excitation in vivo.
a) Representative images of SF-Venus-iGluSnFR.A184V (blue; top) and iGluSnFR3.v857 (yellow; bottom), both in the PDGFR backbone, expressed in excitatory cortical neurons in mouse visual cortex, over the course of two-photon recordings at matched excitation power. Images are shown with the same brightness scale. b) Brightness, normalized to its initial value, of the two variants. Shading denotes s.e.m. A184V, n = 34 FOV’s from 5 mice; v857, n = 27 FOV’s from 5 mice. Curves are fit with two-phase exponential decay (red line). Right panel is a zoom-in view from 0 sec to 20 sec. c) Two-phase exponential decay parameters (+/−95% CI) of iGluSnFR3 and SF-Venus-iGluSnFR.A184V.
Extended Data Fig. 8
Extended Data Fig. 8. Functional in vivo imaging of layer 4 TC boutons during a pole touching task with iGluSnFR3.v857.GPI.
a) Schematic of viral injection of AAV2/1.hSyn.iGluSnFR3.v857.GPI in VPM to label the TC boutons in layer 4. b) Schematic of the dynamic pole touch tasking during active sensing. The pole moves back and forth at a range of 5 mm along the azimuthal direction with an average speed of 1.25 mm/s. Images are acquired at the frame rate of ~500 Hz. c) Average (top) and s.d. (bottom) of the image of TC axons and boutons labeled by v857.GPI in layer 4 of vibrissa cortex. d) Raster plot of the touch response from individual boutons detected from panel c. e) Averaged touch response across all boutons in panel d. f) Corresponding whisking trace and touch onset. This experiment was performed with a single subject and is a representative session.
Extended Data Fig. 9
Extended Data Fig. 9. Rise time of SF-iGluSnFR.A184V and v857.GPI indicators for data shown in Fig. 6 c-d at stimulation rates of 2, 5 and 10 Hz.
We extract the averaged response signal across multiple stimulations from 13 ROIs (including the ROIs 1 to 3 shown in Fig. 6c) in each dataset. Rise time (onset to peak) is manually detected from the averaged signal for each ROI. Left, rise time of the 13 ROIs in each dataset. Boxplot denotes median [interquartile range], with outliers beyond 1.5 IQR plotted individually. The plot on the right shows the normalized response to 5 Hz stimulation of each ROI (thin) and their average (thick) for SF-iGluSnFR.A184V and v857.GPI.

References

    1. DeFelipe J, Marco P, Busturia I, Merchán-Pérez A. Estimation of the number of synapses in the cerebral cortex: methodological considerations. Cereb. Cortex. 1999;9:722–732. - PubMed
    1. Calì C, et al. The effects of aging on neuropil structure in mouse somatosensory cortex—a 3D electron microscopy analysis of layer 1. PLoS ONE. 2018;13:e0198131. - PMC - PubMed
    1. Rusakov DA, Stewart MG. Synaptic environment and extrasynaptic glutamate signals: the quest continues. Neuropharmacology. 2021;195:108688. - PubMed
    1. Clements JD, Feltz A, Sahara Y, Westbrook GL. Activation kinetics of AMPA receptor channels reveal the number of functional agonist binding sites. J. Neurosci. 1998;18:119–127. - PMC - PubMed
    1. Ramsey AM, et al. Subsynaptic positioning of AMPARs by LRRTM2 controls synaptic strength. Sci. Adv. 2021;7:eabf3126. - PMC - PubMed