. 2023 May;25(5):726-739.
doi: 10.1038/s41556-023-01138-4. Epub 2023 May 4.

SEL1L-HRD1 endoplasmic reticulum-associated degradation controls STING-mediated innate immunity by limiting the size of the activable STING pool

Affiliations

SEL1L-HRD1 endoplasmic reticulum-associated degradation controls STING-mediated innate immunity by limiting the size of the activable STING pool

Yewei Ji et al. Nat Cell Biol. 2023 May.

Abstract

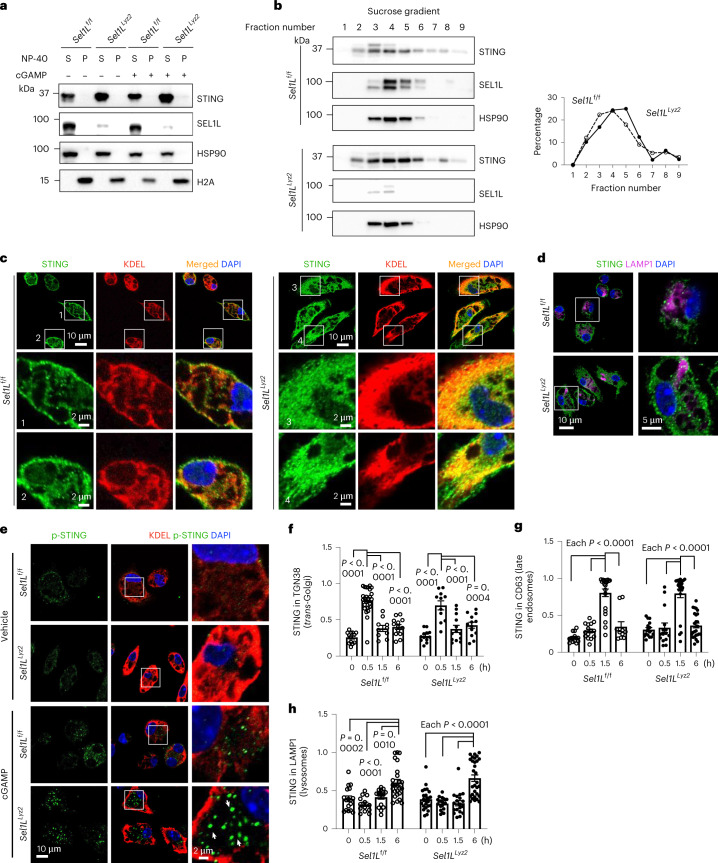
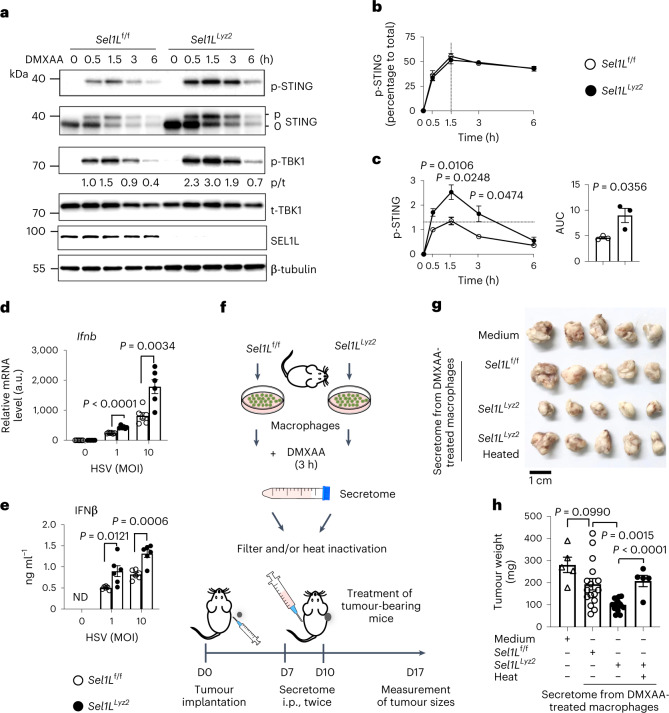
Stimulator of interferon genes (STING) orchestrates the production of proinflammatory cytokines in response to cytosolic double-stranded DNA; however, the pathophysiological significance and molecular mechanism underlying the folding and maturation of nascent STING protein at the endoplasmic reticulum (ER) remain unknown. Here we report that the SEL1L-HRD1 protein complex-the most conserved branch of ER-associated degradation (ERAD)-is a negative regulator of the STING innate immunity by ubiquitinating and targeting nascent STING protein for proteasomal degradation in the basal state. SEL1L or HRD1 deficiency in macrophages specifically amplifies STING signalling and immunity against viral infection and tumour growth. Mechanistically, nascent STING protein is a bona fide substrate of SEL1L-HRD1 in the basal state, uncoupled from ER stress or its sensor inositol-requiring enzyme 1α. Hence, our study not only establishes a key role of SEL1L-HRD1 ERAD in innate immunity by limiting the size of the activable STING pool, but identifies a regulatory mechanism and therapeutic approach to targeting STING.


Conflict of interest statement

The authors declare no competing interests.

Figures

Fig. 1
Fig. 1. Normal growth and intact TLR4 innate immune response in Sel1LLyz2 mice.
a, Immunoblot in primary macrophages, with the relative band intensity (normalized to HSP90) shown below each gel, representative of three independent biological repeats. Each lane shows the results of pooled macrophages from three mice. b, Growth curves for male littermates (n = 7 mice each). NS, not significant. c, Quantitation of flow cytometric analysis for F4/80+CD11b+ macrophages and CD11b+Gr1+ neutrophils in spleens (n = 7 mice each from two independent repeats). Original data are shown in Extended Data Fig. 1c. d, Representative TEM images showing the ultrastructure of peritoneal macrophages. Quantitation of ER area is shown on the left (n = 93 ER areas from 14 Sel1Lf/f macrophages and 74 ER areas from 13 Sel1LLyz2 macrophages, pooled from two mice per genotype). The arrows point to ER. N, nucleus. e, Immunoblot of IRE1α protein levels and phosphorylation (phos-tag gel) in macrophages treated with vehicle, thapsigargin (Tg; 300 nM) or LPS (1,000 ng ml−1) for 4 h. Protein lysate treated with λPPase was included as a control. p, phosphorylated; 0, non-phosphorylated. f, Immunoblot of pro- and cleaved caspase-3 in primary macrophages treated with LPS (1 μg ml−1) for the indicated times. The results in e and f are representative of two independent biological repeats. g, ELISA analysis of TNFα and IL-6 in the culture supernatants of LPS-treated macrophages at different time points (n = 2 each for 0 h (a statistical test was not used for this time point) and n = 4 each for 6 and 12 h). h, ELISA analysis of the serum cytokines TNFα and IL-6 in mice at different time points after LPS injection (n = 3 mice each for 0 h and n = 5 mice each for 3 and 6 h; combined from two independent repeats). i, Survival curves post-LPS injection (n = 7 and 9 for Sel1Lf/f and Sel1LLyz2 mice, respectively). The results are representative of two independent repeats and source data are provided for all repeats. All values represent means ± s.e.m. Statistical significance was determined by unpaired, two-tailed Student’s t-test (bd, g and h) or log-rank (Mantel–Cox) test (i). Source data
Fig. 2
Fig. 2. Loss of SEL1L specifically enhances the STING signalling cascade.
a, qPCR analysis in primary macrophages treated with Pam3 (TLR2) or LPS (TLR4) or transfected with double-stranded RNA (RIG-I) or cGAMP (STING) (n = 4 mice each pooled from two independent repeats). mRNA, messenger RNA. b, ELISA analysis of secreted IFNβ and TNFα in primary macrophages treated with cGAMP for 6 h (n = 3, 3, 7 and 8 mice (left to right), pooled from three independent repeats). c, Immunoblot analysis in primary macrophages transfected with vehicle (Veh) or cGAMP for 3 h, representative of four independent repeats. d, Immunoblot analysis in primary macrophages treated with vehicle or DMXAA for 1.5 h, representative of four independent repeats. e, ELISA analysis of secreted IFNβ and TNFα in primary macrophages transfected with poly(I:C) (RIG-1) for 18 h (n = 3, 3, 4 and 4 mice (left to right); combined from two independent repeats). f, Immunoblot analysis in primary macrophages transfected with vehicle or poly(I:C) for 6 h, representative of two independent repeats. The relative intensity of p-STING (normalized to β-tubulin) or ratio of phosphorylated to total protein (p/t) are shown below the blots (c, d and f). All values represent means ± s.e.m. Statistical significance was determined by unpaired, two-tailed Student’s t-test (a, b and e). Source data
Fig. 3
Fig. 3. Accumulation of STING protein in the absence of SEL1L–HRD1 ERAD in the basal state.
a, Immunoblot analysis in primary macrophages, representative of more than two independent repeats. Quantitation of STING protein levels is shown to the right (n = 10 each); combined from nine independent repeats. b, qPCR analysis of the Sting messenger RNA level normalized to the ribosomal gene L32 (n = 5 mice each; combined from two independent repeats). c, Immunoblot analysis in wild-type (scramble) versus Hrd1−/− RAW 264.7 cells, representative of three independent repeats. Each lane shows the results for a different Hrd1−/− line. gRNA, guide RNA. d, Immunoblot analysis in RAW 264.7 cells treated with vehicle or cGAMP for 6 h, representative of three independent repeats. e, Immunoblot analysis in primary macrophages treated with vehicle, 25 μM MG132 and/or 50 μg ml−1 CHX for 6 h, representative of three independent repeats. f, Immunoblot analysis in Hrd1+/+ and Hrd1−/− MEFs treated with CHX for the indicated times, with quantitation from four independent experiments shown on the right. g, Immunoblot analysis in primary macrophages treated with vehicle or cGAMP for 6 h, representative of two independent repeats. h,i, qPCR analysis of Infb (h) and ELISA analysis of secreted IFNβ (i) in primary macrophages treated with vehicle or cGAMP for 6 h (n = 5 mice each; combined from two independent repeats). j, Immunoblot analysis in primary macrophages treated with or without the autophagy inhibitor bafilomycin A1 (BafA1) for 6 h, DMXAA for 3 h or DMXAA and BafA1 for 3 h, representative of two independent repeats. In a, ce, g and j, the quantitation of total protein levels (normalized to the loading control) or ratio of phosphorylated to total protein (p/t) is shown below the blot. All values represent means ± s.e.m. Statistical significance was determined by unpaired, two-tailed Student’s t-test (a, b, f, h and i). Source data
Fig. 4
Fig. 4. The effect of SEL1L–HRD1 ERAD on STING is uncoupled from UPR and IRE1α.
a, qPCR analysis of ER stress (top) and inflammatory genes (bottom) in wild-type macrophages treated with vehicle (control), cGAMP or thapsigargin for 6 h (n = 6 mice each; combined from two independent repeats). b, Immunoblot analysis in primary macrophages treated as in a. c, Immunoblot analysis in primary macrophages treated with cGAMP and/or thapsigargin for the indicated times. The results in b and c are representative of two independent repeats. d, qPCR analysis of Xbp1u and Xbp1s in primary macrophages treated with vehicle or 4μ8c for 24 h (n = 5 mice each; combined from two independent repeats). e, qPCR analysis in macrophages treated with vehicle, IRE1α inhibitor 4μ8c (24 h) and/or DMXAA (1 h) (n = 4 mice each; combined from two independent repeats). f, Immunoblot in primary macrophages treated as in e, representative of three independent repeats. g,h, Immunoblot analysis of STING expression in wild-type (scramble) versus Ire1a−/− RAW 264.7 cells (g) or wild-type versus Hrd1−/− and Hrd1−/−Ire1a−/− RAW 264.7 cells (h), representative of two independent repeats. In b, c and fh, quantitation of total protein levels (normalized to the loading control) or the ratio of phosphorylated to total protein (p/t) is shown below each blot. All values represent means ± s.e.m. Statistical significance was determined by one-way ANOVA with Newman–Keuls post-test (a) or unpaired, two-tailed Student’s t-test (d and e). Source data
Fig. 5
Fig. 5. STING directly interacts with and is ubiquitinated by SEL1L–HRD1 ERAD in the basal state.
a, Heat map showing the top 30 ER-resident STING-interacting proteins in the basal state from a published STING–APEX2 proximity labelling study. In the presence of hydrogen peroxide (H2O2), APEX2 catalyses biotin-phenol (BP) to produce a biotin-phenoxyl intermediate with which to label proximal proteins (+BP/H2O2). The values shown are log2 of the original mass spectrometry values. Asterisks highlight proteins involved in folding and degradation in the ER. b,c, Immunoblot analysis following immunoprecipitation of endogenous SEL1L (b) and STING (c) in primary macrophages in the basal state (b) or treated with or without DMXAA for 3 h (c), representative of three independent biological repeats. IgG, immunoglobulin G; IP, immunoprecipitation. d,e, Immunoblot analysis following immunoprecipitation with streptavidin beads in MEF (d) and RAW 264.7 cells (e) transfected with SEL1L-TurboID (d) and STING-TurboID (e) followed by cGAMP treatment for the indicated times, representative of three independent biological repeats. Quantitation of total protein levels (normalized to 0 h) is shown below each blot. f, Diagrams of the STING and HRD1 protein domains. CBD, c-di-GMP-binding domain; CTT, carboxy-terminal tail; Pro-rich, proline-rich; TM, transmembrane. g, Mapping of STING and HRD1 interacting domains. Shown are the results of immunoblot analysis following Flag immunoprecipitation in HEK293T cells transfected with various plasmids encoding full-length or truncated STING proteins, as indicated. h, Immunoblot analysis of polyubiquitination following immunoprecipitation of endogenous STING in wild-type and Hrd1−/− RAW 264.7 cells treated with or without MG132 for 5 h. Ub, ubiquitin. i,j, Immunoblot analyses of STING ubiquitination following STING-Flag immunoprecipitation in HEK293T cells transfected with the indicated plasmids. C, cytosolic C-to-A substitution; C2A, HRD1-dead variant; K, cytosolic K-to-R substitution; S/T, cytosolic S- and T-to-A substitution; WT, wild type. The data in gj are representative of three independent biological repeats. Source data
Fig. 6
Fig. 6. SEL1L–HRD1 ERAD controls the size of the activable STING pool in macrophages.
a, Immunoblot analysis in the NP-40 soluble (S) and pellet (P) fractions of primary macrophages treated with or without cGAMP for 3 h. HSP90 and H2A mark the S and P fractions, respectively. b, Sucrose gradient fractionation followed by immunoblot analysis of STING in primary macrophages with quantitation of the percentage of STING mass in each fraction shown on the right. The results in a and b are representative of two independent biological repeats. c,d, Representative confocal images of STING (green) co-stained with DAPI (blue) and either the ER marker KDEL (red; c) or the lysosomal marker LAMP1 (pink; d) in primary macrophages under basal conditions. e, Representative confocal images of p-STING and KDEL in macrophages with or without cGAMP treatment for 6 h. The arrows point to p-STING foci outside of the ER. The results in ce are representative of four independent biological repeats. fh, Quantitation of the fraction of STING in the trans-Golgi network (TGN38; f), late endosomes (CD63; g) and lysosomes (LAMP1; h) in primary macrophages treated with cGAMP for the indicated times. From left to right, n = 13, 25, 10, 13, 12, 11, 13 and 13 cells (f), 14, 15, 22, 10, 15, 15, 22 and 26 cells (g) and 17, 13, 17, 25, 23, 20, 19 and 30 cells (h) pooled from two independent experiments. Mander’s overlap coefficient was used for the measurement of colocalization. Original images are shown in Extended Data Fig. 7b–d. All values represent means ± s.e.m. Statistical significance was determined by one-way ANOVA with the Newman–Keuls post-test (fh). Source data
Fig. 7
Fig. 7. Myeloid-specific SEL1L–HRD1 ERAD limits STING-mediated innate immunity in vitro and in vivo.
a, Immunoblots in primary macrophages treated with DMXAA at 20 μg ml−1 for the indicated times. b,c, Quantitation of the percentages of p-STING in total STING (b) and p-STING signal intensity (c) from a (relative to the wild-type 0.5-h time point). The results are representative of three independent repeats. AUC, area under the curve. d,e, qPCR (d) and ELISA (e) analyses of Ifnb gene (d) and secreted IFNβ (e) in primary macrophages infected with HSV-1 at a multiplicity of infection (MOI) of 1 or 10 for 6 (d) and 12 h (e) (n = 6 mice each combined from two independent repeats). ND, not done. f, Schematic for the cancer model in which tumour-transplanted wild-type mice received two intraperitoneal (i.p.) injections of the secretome of DMXAA-treated macrophages. D, day. g, Representative images of the pancreatic tumours of four groups of tumour-transplanted wild-type mice that received DMXAA-containing medium, secretomes from DMXAA-treated macrophages from Sel1Lf/f and Sel1LLyz2 mice and heat-inactivated Sel1LLyz2 secretomes. h, Quantitation of tumour weights at the end of experiment (D17) (n = 5, 16, 16 and 5 mice (left to right); combined from two independent repeats). All values represent means ± s.e.m. Statistical significance was determined by unpaired, two-tailed Student’s t-test (ce and h). Source data
Extended Data Fig. 1
Extended Data Fig. 1. Generation of Sel1LLyz2 mice and characterization of immune cell composition, inflammation and cell death.
(a) Schematic diagram of the Sel1L floxed allele and generation of Sel1LLyz2 mice. Exon 6 of the Sel1L gene was flanked by two loxP sites. (b) Immunoblot of SEL1L showing cell type-specific deletion of SEL1L in Sel1LLyz2 mice, representative of three independent repeats. PEM, peritoneal exudate macrophages; BMDM, bone marrow-derived macrophages. (c, d) Flow cytometric analysis showing CD4+ T, CD8+ T, B220+ B cells, Gr-1+ CD11b+ neutrophils and F4/80+CD11b+ macrophages in the spleens (c), with quantitation of myeloid cells and lymphocytes shown in Fig. 1b and Extended Data Fig. 1d, respectively. n = 7 mice each, combined from 2 independent repeats. (e) Flow cytometric analysis of Annexin V+ primary macrophages. (f) Immunoblot showing expression of ER proteins in macrophages, with quantitation (normalized to HSP90) shown below the gel. Each lane, pooled macrophages from three mice. Data are representative of three independent biological repeats. (g) Immunoblot showing IκB protein levels post-LPS treatment in macrophages, with quantitation shown below. (h) Flow cytometric analysis of surface H-2Kb/H-2Db (MHC I) and I-A/I-E (MHC II) levels on macrophages. Gating strategies shown on the left (c, e, h). (i, j) ELISA showing secreted IL-2 levels in the culture supernatants of macrophages with either OT1 CD8+ T (i) or DN32.D3 NKT cells (j). N = 3 each, from 2 independent repeats (i, j). Values, mean ± s.e.m. n.s., not significant by unpaired, two-tailed, Student’s t-test (d, i, j). Source data
Extended Data Fig. 2
Extended Data Fig. 2. Myeloid-specific SEL1L is dispensable for inflammatory responses and insulin sensitivity in diet-induced obesity.
(ac) Body (a) and tissue (b-c) weights after 20 weeks on 60% high-fat-diet (HFD). From left to right, n = 4, 5 mice (a,c) and n = 4 mice each (b), combined from 2 independent repeats (a-c). (d) H&E images of WAT and liver of mice on HFD for 20 weeks, representative of 2 independent biological repeats. (e) Q-PCR analysis of M1/M2 macrophage markers in WAT. n = 4 mice each. (f) ELISA analysis of serum TNFα and IL-6 levels in mice on HFD for 20 weeks. n = 3 Sel1Lf/f, 5 Sel1LLyz2 mice for TNFα and n = 3 mice each for IL-6, combined from 2 independent repeats. (g, h) Flow cytometric analysis of various immune cells in WAT following 20-week HFD, with quantitation shown in h. n = 4 Sel1Lf/f, 5 Sel1LLyz2 mice for macrophages, CD8+, B220+ and NKT cells; and n = 6, 4 mice for CD4+ cells. Gating strategies shown on the left. Data are combined from 2 independent repeats. (i) Serum glucose and insulin levels in HFD mice following a 6 hr fast for insulin and 16 hr fast for glucose. n = 6 mice each for glucose, and n = 4 Sel1Lf/f, 5 Sel1LLyz2 mice for insulin, combined from 2 independent repeats. (j) Glucose tolerance test (GTT) of mice on HFD for 20 weeks. n = 6 mice each. (k) Insulin tolerance test (ITT) of mice on HFD for 14 weeks. n = 4 Sel1Lf/f and 6 Sel1LLyz2 mice. Data are representative of two independent repeats, and source data for all repeats are provided (j, k). Values, mean ± s.e.m. P values were determined by unpaired, two-tailed, Student’s t-test (a-c, e, f, h-k); n.s., not significant. Source data
Extended Data Fig. 3
Extended Data Fig. 3. Loss of SEL1L specifically enhances STING signaling and STING protein level.
(a) q-PCR analysis of Infb and Cxcl10 in primary macrophages treated with vehicle or c-di-AMP for 3 hr. n = 5 mice for each, combined from two independent repeats. (b) Immunoblot analysis of indicated proteins in primary macrophages, with quantitation of the average of two samples (normalized to HSP90) shown below the gel, representative of at least two independent repeats. (c) Flow cytometric analysis of surface (upper) and total levels of TLR2, TLR4, PD-L1, H-2Kb/H-2Db (MHC I) and I-A/I-E (MHC II) in macrophages, with quantitation of mean fluorescence intensity shown below. Gating strategies shown on top. n = 4 Sel1Lf/f and 3 Sel1LLyz2 mice each, combined from two independent repeats. (d) Immunoblot analysis of the STING pathway in primary macrophages pretreated with or without the STING inhibitor H151 for 2 hr followed by DMXAA treatment for another 1 hr. Quantitation shown below the gel. p-/0-/t-, phosphorylated-/non-phosphorylated/total proteins. Data are representative of two biologically independent repeats. (e) q-PCR analysis of Infb and Cxcl10 in macrophages treated as in (d). n = 4 mice each, combined from two independent repeats. Values, mean ± s.e.m. P values were determined by unpaired, two-tailed, Student’s t-test (a, c, e); n.s., not significant. Source data
Extended Data Fig. 4
Extended Data Fig. 4. STING protein stabilization in Hrd1-/- macrophages.
(a, b) Immunoblot analysis in WT or Hrd1-/- RAW 264.7 cells treated with cycloheximide (CHX) for indicated time points with quantitation of relative band intensity (normalized to β-actin) shown below the gel (a), and quantitation of STING from 3 independent repeats shown in (b). Values represent mean ± s.e.m. P values were determined by unpaired, two-tailed, Student’s t-test; n.s., not significant. Source data
Extended Data Fig. 5
Extended Data Fig. 5. The effect of SEL1L-HRD1 ERAD on STING signaling is uncoupled from ER stress.
(a) q-PCR analysis of ER stress markers in macrophages treated with vehicle or TUDCA for 24 hr. n = 8 mice each, combined from 3 independent repeats. (b) Immunoblot of the STING pathway in macrophages pretreated with TUDCA for 24 hr followed by DMXAA for another 1 hr. The numbers below the blot indicate relative band intensity of STING, p-STING (normalized to β-tubulin), or ratio of phosphorylated to total protein (p/t), representative of 2 independent repeats. (c) Q-PCR analysis of inflammatory genes in primary macrophages treated as in (b). n = 4 mice each, combined from 2 independent repeats. Values, mean ± s.e.m. P values were determined by unpaired, two-tailed, Student’s t-test (a, c); n.s., not significant. Source data
Extended Data Fig. 6
Extended Data Fig. 6. STING interacts with and is ubiquitinated by SEL1L-HRD1 ERAD.
(a) Diagram for SEL1L- and STING-TurboID proximity labeling experiment. B, biotin. (b) Immunoblot analysis following immunoprecipitation of Flag in lysates of HEK293T cells transfected with STING-Flag. (c) Immunoblot analysis following immunoprecipitation of Flag from lysates of HEK293T cells transfected with STING-Flag and full length (1-616) or truncated HRD1-Myc plasmids. (d) Quantitation of STING levels in macrophages with or without MG132 treatment for 5 hr shown in Fig. 5h, n = 3, combined from three independent repeats. Values represent mean ± s.e.m. P values were determined by unpaired, two-tailed, Student’s t-test; n.s., not significant. (e) Immunoblot analysis in lysates of HEK293T cells transfected with Ub-HA, WT- or C2A ligase-dead mutant HRD1-myc, and different STING mutant-Flag. STING K, 8 cytosolic Lys mutated to Arg; C, 9 cytosolic Cys to Ala; S/T-, 33 cytosolic Ser/Thr to Ala. This was the input for the immunoprecipitation experiment shown in Fig. 5j. (f) Immunoblot analysis following immunoprecipitation of STING-Flag in the lysates of HEK293T cells transfected with STING-Flag, HRD1-myc (WT and RING-dead C2A), and Ub-HA (WT and K-only mutants). Data are representative of at least 2 independent biological repeats (b, c, e, f). Source data
Extended Data Fig. 7
Extended Data Fig. 7. Distribution and trafficking of STING upon stimulation are unaffected by SEL1L-HRD1 ERAD.
(a) Sucrose gradient fractionation followed by immunoblot analysis in primary macrophages treated with cGAMP for 3 hr, with quantitation of percent of STING protein in each fraction on the right, representative of 2 independent repeats. (bd) Representative confocal microscopic images of STING, co-stained with organellar markers such as TGN38 (trans-Golgi, b), CD63 (late endosome, c), LAMP1 (lysosome, d) in primary macrophages treated with or without cGAMP for indicated time points. Quantitation shown in Fig. 6f–h. Source data
Extended Data Fig. 8
Extended Data Fig. 8. SEL1L-HRD1 ERAD limits STING-mediated immunity against HSV-1 infection.
(a) Immunoblot of the STING pathway in primary macrophages treated with HSV-1 (MOI = 1) for 6 hr, with quantitation of the ratio of phosphorylated to total proteins (p/t) shown below the gels. (b-c) q-PCR (b) and ELISA (c) analyses of gene expression and secreted protein levels of IFN-β, respectively, in macrophages infected with HSV-1 (MOI = 5) for 6 hr, with or without the STING inhibitor H151 pretreatment. n = 4 mice each, combined from 2 independent repeats. (d) q-PCR analysis of Ifnb gene in Hrd1+/+ and Hrd1-/- RAW 264.7 cells infected HSV-1 (MOI = 5) for 6 hr. n = 6 each, combined from 2 independent repeats. (e) Immunoblot showing TBK1 activation in Hrd1+/+ and Hrd1-/- RAW 264.7 cells treated with HSV-1 (MOI = 5) for 6 hr, with the quantitation of the ratio of phosphorylated to total proteins (p/t) shown below the gel. Data are representative of two independent biological repeats (a, e). Values represent mean ± s.e.m. P values were determined by unpaired, two-tailed, Student’s t-test (b-d). Source data
Extended Data Fig. 9
Extended Data Fig. 9. SEL1L-HRD1 ERAD limits STING-mediated anti-tumor immunity.
(a, b) Representative images of tumors from tumor cell-transplanted Sel1Lf/f and Sel1LLyz2 mice administered with vehicle or DMXAA (12.5 mg/kg body weight, i.p.) twice. Quantitation of tumor weights at the end of experiment shown in (b). n = 7 mice for each group, combined from 2 independent repeats. (c) ELISA analysis of serum cytokines in Sel1Lf/f and Sel1LLyz2 mice 1.5 hr after DMXAA injection. n = 4 mice each, combined from 2 independent repeats. (d, e) Representative images of tumors of 5 groups of WT mice received medium or secretome from vehicle- or DMXAA-treated Sel1Lf/f and Sel1LLyz2 macrophages. Experiments were performed as described in Fig. 7f. Quantitation of tumor weights at the end of experiment shown in (e). n = 5, 5, 5, 12, 12 mice (left to right), combined from 2 independent repeats. (f, g) Representative images of tumors of 3 groups of tumor cell-transplanted nude mice received DMXAA-medium, secretomes from DMXAA-treated macrophages from Sel1Lf/f or Sel1LLyz2 mice (f). Quantitation of tumor weights at the end of experiment shown in (g). n = 7 mice for each group, combined from 2 independent repeats. Values represent mean ± s.e.m. P values were determined by unpaired, two-tailed, Student’s t-test (b, c, e, g); n.s., no significance. Source data
Extended Data Fig. 10
Extended Data Fig. 10. Proposed model for the regulation of STING-mediated immunity by SEL1L-HRD1 ERAD at the ER.
(a) Newly synthesized STING protein in the ER is subjected to SEL1L-HRD1 ERAD-mediated proteasomal degradation. In the absence of SEL1L-HRD1 ERAD, a larger pool of activable STING is present at the ER under basal state. (b) SEL1L-HRD1 ERAD limits the activation potential of STING signaling and immunity via controlling the abundance of STING protein at the ER under basal state.

Comment in

References

    1. Barber GN. STING: infection, inflammation and cancer. Nat. Rev. Immunol. 2015;15:760–770. doi: 10.1038/nri3921. - DOI - PMC - PubMed
    1. Ishikawa H, Barber GN. STING is an endoplasmic reticulum adaptor that facilitates innate immune signalling. Nature. 2008;455:674–678. doi: 10.1038/nature07317. - DOI - PMC - PubMed
    1. Jeremiah N, et al. Inherited STING-activating mutation underlies a familial inflammatory syndrome with lupus-like manifestations. J. Clin. Invest. 2014;124:5516–5520. doi: 10.1172/JCI79100. - DOI - PMC - PubMed
    1. Sun L, Wu J, Du F, Chen X, Chen ZJ. Cyclic GMP–AMP synthase is a cytosolic DNA sensor that activates the type I interferon pathway. Science. 2013;339:786–791. doi: 10.1126/science.1232458. - DOI - PMC - PubMed
    1. Zhong B, et al. The adaptor protein MITA links virus-sensing receptors to IRF3 transcription factor activation. Immunity. 2008;29:538–550. doi: 10.1016/j.immuni.2008.09.003. - DOI - PubMed

Publication types

MeSH terms