. 2023 May;3(5):567-584.
doi: 10.1038/s43587-023-00401-5. Epub 2023 May 4.

Gut-specific telomerase expression counteracts systemic aging in telomerase-deficient zebrafish

Affiliations

Gut-specific telomerase expression counteracts systemic aging in telomerase-deficient zebrafish

Mounir El Maï et al. Nat Aging. 2023 May.

Abstract

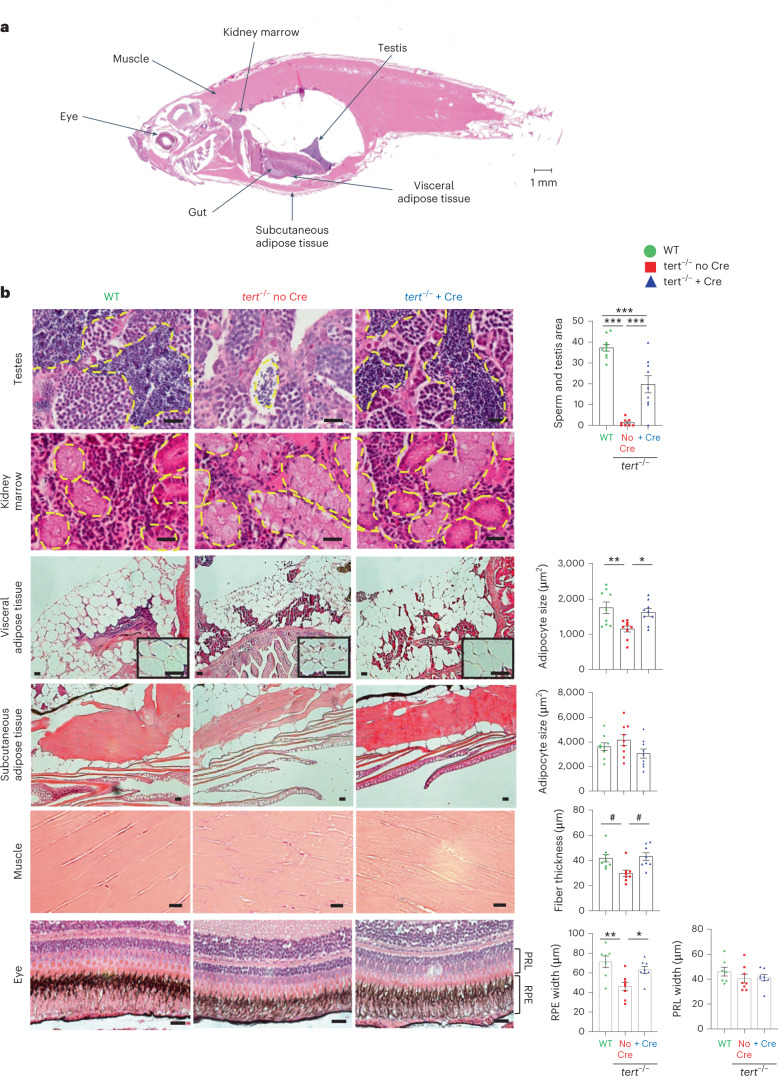
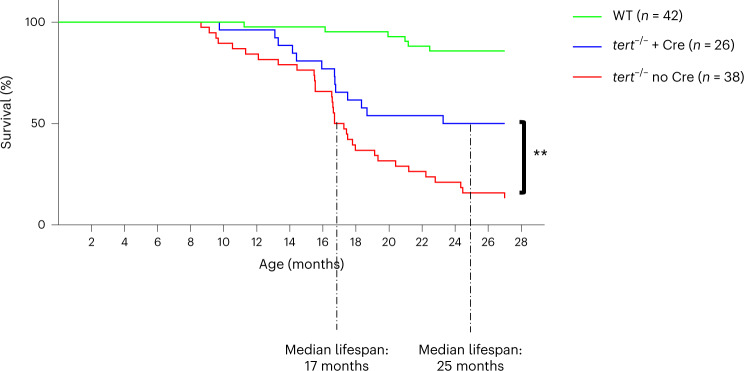
Telomere shortening is a hallmark of aging and is counteracted by telomerase. As in humans, the zebrafish gut is one of the organs with the fastest rate of telomere decline, triggering early tissue dysfunction during normal zebrafish aging and in prematurely aged telomerase mutants. However, whether telomere-dependent aging of an individual organ, the gut, causes systemic aging is unknown. Here we show that tissue-specific telomerase expression in the gut can prevent telomere shortening and rescues premature aging of tert-/-. Induction of telomerase rescues gut senescence and low cell proliferation, while restoring tissue integrity, inflammation and age-dependent microbiota dysbiosis. Averting gut aging causes systemic beneficial impacts, rescuing aging of distant organs such as reproductive and hematopoietic systems. Conclusively, we show that gut-specific telomerase expression extends the lifespan of tert-/- by 40%, while ameliorating natural aging. Our work demonstrates that gut-specific rescue of telomerase expression leading to telomere elongation is sufficient to systemically counteract aging in zebrafish.


Conflict of interest statement

The authors declare no competing interests.

Figures

Fig. 1
Fig. 1. Gut-specific and Cre-mediated tert expression rescues gut aging phenotypes.
a, Schematic representation of the transgene for Cre-inducible and tissue-specific expression of tert mRNA. b, RT–qPCR analysis of tert transgene mRNA and total tert mRNA (endogenous + transgene) expression in 9-month-old gut extracts (nWT = 5 and 6; ntert/noCre = 7 and 8 and ntert/+Cre = 6 and 5 fish, respectively; levels were normalized by rps11 gene expression levels). c, Quantification of mean telomere length by TRF analysis (nWT = 7; ntert/noCre = 7 and ntert/+Cre = 6 fish). d, Representative immunofluorescence images of DNA damage staining (γH2AX; left) and quantification (right; nWT = 6; Ntert/noCre = 6 and ntert/+Cre = 6 fish). e, Quantification of p53 protein levels (normalized by β-actin) analyzed by western blot (nWT = 6; Ntert/noCre = 7 and ntert/+Cre = 6 fish). f, Representative immunofluorescence images of proliferation staining (left, proliferation cell nuclear antigen (PCNA)) and quantification (right, nWT = 6; ntert/noCre = 6 and ntert/+Cre = 6 fish). g, Representative image of SA-β-Gal staining. h,i, RT–qPCR analysis of the senescence-associated genes ink4a/b (p15/16) (h) and cdkn1a (p21) (i) expression (nWT = 6; ntert/noCre = 7 and ntert/+Cre = 6 fish). j,k, Representative hematoxylin and eosin (H&E)-stained sections of the gut (j). The yellow arrows delineate the lamina propria width quantified in k (nWT = 7; ntert/noCre = 8 and ntert/+Cre = 7 fish). l,m, RT–qPCR analysis of the YAP target genes cyr61 (l) and ctgf expression (m) (nWT = 6; ntert/noCre = 8 and ntert/+Cre = 6 fish). n, RT–qPCR analysis of the junction protein-associated gene claudin-2 expression (nWT = 5; ntert/noCre = 7 and ntert/+Cre = 6 fish). o, Representative immunofluorescence images of immune cell staining (left, L-plastin) and quantification (right, nWT = 6 fish; ntert/noCre = 6 fish and ntert/+Cre = 7 fish). p, Representative immunofluorescence images of neutrophil staining (left, myeloperoxidase (MPX)) and quantification (right, nWT = 5 fish; ntert/noCre = 5 fish and ntert/+Cre = 6 fish). All analyses are based on 9-month-old fish gut sections or extracts. Scale bar, 20 µm. The dashed lines delineate the gut villi. All data are presented as the mean ± s.e.m. *P < 0.05, **P < 0.01, ***P < 0.001, using a one-way ANOVA and post hoc Tukey test; *P < 0.05, **P < 0.01, using a Kruskal–Wallis and post hoc Dunn test. Source data
Fig. 2
Fig. 2. Gut-specific tert expression rescues gut transcriptomics and metabolomics profiles.
a, Principal component analysis (PCA)-based on untargeted transcriptomics data of 9-month-old gut samples. A clustering between tert−/− + Cre and WT was observed while the tert−/− no Cre group was clearly distinguishable from tert−/− no Cre fish (n = 3 per group). b,c, Identification of upregulated (b) or downregulated (c) hallmarks in tert−/− no Cre compared to either WT or tert−/− + Cre, based on GSEA. The normalized enrichment scores (NES) depict to what degree the pathway genes are overrepresented in WT or tert−/− + Cre, compared to tert−/− no Cre. Gene sets related to senescence, inflammation and morphogenesis were enriched while the hallmarks of proliferation and oxidative phosphorylation were downregulated in the gut of tert−/− no Cre fish compared to the other two groups. d, RT–qPCR analysis of inflammation-related gene expression (il6, tnfa, tgfb1b and tgfb5) and SASP-related gene expression (il6, tnfa, cxcl12a, tgfb1b, tgfb5 and mmp2) in 9-month-old gut samples (nWT = 8 fish, ntert/noCre = 10 fish and ntert/+Cre = 8 fish for il6; nWT = 8 fish, ntert/noCre = 9 fish and ntert/+Cre = 8 fish for tnfa; nWT = 8 fish, ntert/noCre = 11 fish and ntert/+Cre = 8 fish for cxcl12; nWT = 7 fish, ntert/noCre = 9 fish and ntert/+Cre = 7 fish for tgfb1b; nWT = 7 fish, ntert/noCre = 11 fish and ntert/+Cre = 6 fish for tgfb5; and nWT = 8 fish, ntert/noCre = 10 fish and ntert/+Cre = 7 fish for mmp2). e,f, PCA (e) and partial least squares discriminant analysis (PLS-DA) (f) clustering analysis based on untargeted metabolomics data of 9-month-old gut samples. A clustering between tert−/− + Cre and WT was observed while the tert−/− no Cre group was clearly distinguishable from the other (nWT = 8 fish, ntert/noCre = 8 fish and ntert/+Cre = 9 fish). The score plot is presented with a confidence ellipse of 95%. gi, Metabolomics analysis of energy metabolites (g), inflammatory metabolites (h) and methionine cycle pathway (i) in 9-month-old gut samples (nWT = 8 fish, ntert/noCre = 8 fish and ntert/+Cre = 9 fish). All data are presented as the mean ± s.e.m.; *P < 0.05, **P < 0.01, ***P < 0.001, using a one-way ANOVA and post hoc Tukey test; *P < 0.05; *P < 0.01, ***P < 0.001, using a Kruskal–Wallis and post hoc Dunn test). Source data
Fig. 3
Fig. 3. Gut-specific tert expression rescues gut microbiota dysbiosis.
Telomere elongation in the gut of tert−/− + Cre fish rescued gut microbiota composition and diversity to WT levels compared to tert−/− no Cre fish, which exhibited gut microbiota dysbiosis. a, Quantification of microbiome α diversity (within samples) using the Shannon index (P values were determined using a two-sided Wilcoxon signed-rank test) in the gut of 9-month-old fish. b, Quantification of microbiome β diversity using weighted UniFrac distance (within groups; ***P < 0.001 using a two-sided Tukey test) in the gut of 9-month-old fish. c, PCoA of the β diversity distance (weighted UniFrac) in the gut of 9-month-old fish. d, Relative abundance of top 10 bacterial classes in the microbiome of the three different groups in the gut of 9-month-old fish. e, Relative abundance of top 10 bacterial genera in the microbiome of the three different groups in the gut of 9-month-old fish. For all the figures, nWT = 15 fish, ntert/noCre = 15 fish and ntert/+Cre = 14 fish; α and β diversity data are shown as Tukey boxplots, where the boxes represent the median and interquartile range and the bars represent the minimum and maximum values. Source data
Fig. 4
Fig. 4. Gut-specific tert expression rescues systemic tissue degeneration.
Expression of telomerase in the gut of tert mutant fish rescued tissue degeneration in the testes, visceral adipose tissue, muscle and eye. a, Representative image of a longitudinal section of a zebrafish stained with H&E. The locations of each tissue analyzed in the study are indicated by arrows. b, Representative images of testes, kidney, visceral adipose tissue, subcutaneous adipose tissue, muscle and eye from 9-month-old fish stained with H&E (right). Except for the kidney, histological quantifications were performed for each tissue (left), namely the mature spermatids area (nWT = 10 fish, ntert/noCre = 8 fish and ntert/+Cre = 9 fish), adipocyte area (nWT = 9 fish, ntert/noCre = 9 fish and ntert/+Cre = 9 fish), muscle fiber thickness (n = 8 fish per group), retinal pigmented epithelium (RPE) and photoreceptor layer (PRL) (nWT = 7 fish, ntert/noCre = 8 fish and ntert/+Cre = 8 fish), respectively. Scale bar, 20 µm. All data are presented as the mean ± s.e.m.; *P < 0.05; **P < 0.01, ***P < 0.001, using a one-way ANOVA and post hoc Tukey test; *P < 0.05, using a Kruskal–Wallis test and post hoc Dunn test. Source data
Fig. 5
Fig. 5. Gut-specific tert expression rescues the aging phenotypes of testes.
ae, Delaying gut aging in tert−/− + Cre fish rescues DNA damage, proliferation and senescence in the testes compared to tert−/ no Cre fish. a, Representative immunofluorescence images of DNA damage staining (γH2AX, left) and quantification (right, nWT = 6, ntert/noCre = 5 and ntert/+Cre = 5 fish) in the tissue of testes. b, Quantification of p53 protein levels (normalized by β-actin) in 9-month-old testes extracts analyzed by western blot (nWT = 6, ntert/noCre = 8 and ntert/+Cre = 8 fish). c, Representative immunofluorescence images of proliferation staining (left, PCNA) and quantification (right, n = 6 fish per group) in the tissue of testes. d, Representative image of SA-β-Gal staining of 9-month-old testes cryosections. e,f, RT–qPCR analysis of the senescence-associated genes ink4a/b (p15/16) (e) and cdkn1a (p21) (f) expression in testes samples (nWT = 6 and 5, ntert/noCre = 7 and 6 and ntert/+Cre = 5 and 5 fish, respectively). g, Representative immunofluorescence images of immune cell staining (left, L-plastin) and quantification (right, nWT = 6, ntert/noCre = 6 and ntert/+Cre = 7 fish) in testes tissues. h, Representative immunofluorescence images of neutrophil staining (left, MPX) and quantification (right, nWT = 6, ntert/noCre = 5 and ntert/+Cre = 6 fish) in the tissue of testes. i, Identification of upregulated (left) or downregulated (right) hallmarks in the testes of tert−/− no Cre fish compared to either WT or tert−/− + Cre, based on GSEA. The NES depict to what degree the pathway’s genes are overrepresented in WT or tert−/− + Cre, compared to tert−/− no Cre fish. j, Quantification of male fertility of fish determined by counting the percentage of fertilized eggs (detected by successful embryogenesis events) after individually crossing 9-month-old males with a young (3–6-month-old) WT female (nWT = 19, ntert/noCre = 16 and ntert/+Cre = 13 fish). All analyses were done on sections of 9-month-old fish testes or extracts. Scale bar, 20 µm. The dashed lines delineate the area of mature spermatids. All data are presented as the mean ± s.e.m. *P < 0.05, **P < 0.01, ***P < 0.001, using a one-way ANOVA and post hoc Tukey test; and *P < 0.05, **P  < 0.01 using a Kruskal–Wallis and post hoc Dunn test. The RT–qPCR graphs represent the mean ± s.e.m. Note the mRNA fold increase after normalization by rps11 gene expression levels. Source data
Fig. 6
Fig. 6. Gut-specific tert expression rescues aging of the hematopoietic system (kidney marrow).
af, Delaying gut aging in tert−/− + Cre fish rescues DNA damage, proliferation and senescence in the kidney marrow when compared to tert−/− no Cre fish. a, Representative immunofluorescence images of DNA damage staining (left, γH2AX) and quantification (right, nWT = 5, ntert/noCre = 6 and ntert/+Cre = 5 fish) in 9-month-old kidney marrow tissues. b, Quantification of p53 protein levels in 9-month-old kidney extracts analyzed by western blot (nWT = 6, ntert/noCre = 8 and ntert/+Cre = 6 fish). c, Representative immunofluorescence images of proliferation staining (left, PCNA) and quantification (right, n = 6 fish per group) in 9-month-old kidney marrow tissues. d, Representative images of SA-β-Gal staining of 9-month-old kidney marrow cryosections. e,f, RT–qPCR analysis of senescence-associated genes ink4a/b (p15/16) (nWT = 5, ntert/noCre = 6 and ntert/+Cre = 5 fish) (e) and cdkn1a (p21) (nWT = 6, ntert/noCre = 7 and ntert/+Cre = 4 fish) (f) expression in 9-month-old kidney marrow samples. gi, tert mRNA expression in the gut of tert−/− fish (tert−/− + Cre fish) have beneficial hematopoietic effects by reducing kidney marrow inflammation and increasing immune compartment compared to tert−/− no Cre fish. g, Representative immunofluorescence images of immune cell staining (left, L-plastin) and quantification (right, nWT = 6, ntert/noCre = 6 and ntert/+Cre = 7 fish) in the tissue of 9-month-old testes. h, Representative immunofluorescence images of neutrophil staining (left, MPX) and quantification (right, nWT = 6, ntert/noCre = 5 and ntert/+Cre = 6 fish) in the tissue of 9-month-old kidney marrow. i, Identification of upregulated (left) or downregulated (right) hallmarks in the kidney marrow of tert−/− no Cre compared to either WT or tert−/− + Cre fish based on GSEA. The NES depicts to what degree the pathway genes are overrepresented in WT or tert−/− + Cre, compared to tert−/− no Cre fish. Scale bar, 20 µm. The dashed lines delineate the kidney tubules. All data are presented as the mean ± s.e.m. (*P < 0.05; **P < 0.01, ***P < 0.001, using a one-way ANOVA and post hoc Tukey test). The western blot graphs represent the mean ± s.e.m. of p53 normalized by β-actin band intensities. All RT–qPCR graphs represent the mean ± s.e.m. mRNA fold increase after normalization by rps11 gene expression levels. Source data
Fig. 7
Fig. 7. Gut-specific tert expression extends the lifespan of tert−/− zebrafish.
Gut-specific telomerase activity extends the lifespan, increasing median life from 17 months in tert−/− no Cre fish to 24 months in tert−/− + Cre fish. The survival curve of WT (n = 42 fish), tert−/− no Cre (n = 38 fish) and tert−/− + Cre (n = 26 fish) zebrafish (**P < 0.01 using the log-rank test) is shown. Source data
Fig. 8
Fig. 8. Gut-specific tert expression extends the healthspan of naturally aged zebrafish.
Expression of tert transgene in the gut of WT fish delays local aging phenotypes such as proliferation, senescence and tissue degeneration. This leads to beneficial systemic impact improving early aging phenotypes such as proliferation capacity. a, Representative immunofluorescence images of proliferation staining (left, PCNA) and quantification (right) in the gut, testes and kidney marrow of 27-month-old WT zebrafish expressing (WT + Cre; n = 7 fish for the gut and kidney marrow and n = 6 fish for the testes) or not expressing (WT no Cre; n = 8 fish for the gut and kidney marrow and n = 6 fish for the testes) tert transgene in the gut. b, Representative images of SA-β-Gal staining of gut, testes and kidney marrow sections of 24-month-old WT zebrafish expressing (WT + Cre) or not expressing (WT no Cre) the tert transgene in the gut (left). RT–qPCR analysis of senescence-associated genes ink4a/b (p15/16) and cdkn1a (p21) in the gut, testes and kidney marrow of either 9- (n = 6 fish) or 27-month-old WT zebrafish expressing (WT + Cre; n = 8 fish) or not expressing (WT no Cre; n = 8 fish) tert mRNA in the gut (right). c, Representative H&E-stained sections of the gut, testes and kidney marrow of 27-month-old WT zebrafish expressing (WT + Cre) or not expressing (WT no Cre) the tert transgene in the gut (left) and respective quantifications of the width of the gut lamina propria (right; n = 7 fish for WT no Cre and n = 6 fish for WT + Cre) and mature spermatid area (right; n = 7 fish for WT no Cre and WT + Cre). The yellow arrows indicate the width of the lamina propria quantified on the left. The dashed lines delineate the mature area of the spermatids. d, Survival curve of WT no Cre (n = 42 fish; similar to the WT curve in Fig. 7) and WT + Cre (n = 36 fish) zebrafish. All data are presented as the mean ± s.e.m. *P < 0.05, **P < 0.01, ***P < 0.001, using a two-tailed unpaired t-test for a,c or a one-way ANOVA and post hoc Tukey tests for b; **P < 0.01, a using two-tailed Mann–Whitney U-test). All RT–qPCR graphs represent the mean ± s.e.m. mRNA fold increase after normalization by rps11 gene expression levels. Scale bar, 20 µm. Source data
Extended Data Fig. 1
Extended Data Fig. 1. The tert transgene is specifically expressed in the gut resulting in telomerase activity and telomere elongation in the gut of tert−/− zebrafish.
a, b. RT-qPCR analysis of tert transgene mRNA (A.) and total tert mRNA (B.) expression in gut (Ntert−/− No Cre=7 and 8 and Ntert−/− +Cre=6 and 5 fish respectively), testes (Ntert−/− No Cre=6 and 7 and Ntert−/− +Cre=5 and 6 fish respectively) and kidney marrow (Ntert−/− No Cre=9 and 8 and Ntert−/− +Cre=7 and 4 fish respectively) extracts derived from 9-month-old fish. c–e. Telomere length analyses of genomic DNA extracted from 9-month-old gut samples (NWT=7, Ntert−/− No Cre=7 and Ntert−/− +Cre=6 fish). Representative images of TRF analysis (blue bars represents mean telomere length) (C.), mean TRF densitometry curves (D.), and quantification of median TRF of the longest (90th percentile; left panel) and the shortest (10th percentile; right panel) telomeres (E.). f. Quantification of telomerase activity in gut of 12-month-old zebrafish using quantitative Telomerase Repeated Amplification Protocol (qTRAP) assay (N=3 fish per condition). Hela cell extracts were used as positive control for telomerase activity. g–j. Telomere length analyses of genomic DNA extracted from 9-month-old testes samples (N = 7 fish per condition). Representative images of TRF analysis (blue bars represents mean telomere length). Dashed lines delineate cropped parts of the same Southern blot image (G.), mean TRF densitometry curves (H.), quantification of median TRF of the longest (90th percentile; left panel) and the shortest (10th percentile; right panel) telomeres (I.) and quantification of mean telomere length (J.). k. Quantification of telomerase activity in testes of 12-month-old zebrafish by qTRAP (N = 3 fish per condition except NWT = 6). l–o. Telomere length analyses of genomic DNA extracted from 9-month-old kidney marrow samples (N = 7 fish per condition). Representative images of TRF analysis (blue bars represents mean telomere length)(L.), mean TRF densitometry curves (M.), quantification of median TRF of the longest (90th percentile; left panel) and the shortest (10th percentile; right panel) telomeres (N.) and quantification of mean telomere length (O.). p. Quantification of telomerase activity in kidney marrow of 12-month-old zebrafish using qTRAP assay (N = 3 fish per condition except NWT = 6). Data are represented as mean +/−SEM (***p-value<0.001, using one-way ANOVA and post-hoc Tukey tests). Boxes of Tukey boxplots represent the median and interquartile range. Source data
Extended Data Fig. 2
Extended Data Fig. 2. 9-month-old fish do not exhibit differences in apoptosis between groups.
At 9-months of age, no differences in apoptosis were detected in gut, testes and kidney marrow comparing tert−/− No Cre, tert−/− +Cre and WT fish. a–c. Representative immunofluorescence images of apoptotic cell staining (TUNEL assay; left panel) and quantification (right panel) in gut (A.; NWT = 5, Ntert−/− No Cre = 6 and Ntert−/− +Cre = 7 fish), testes (B.; NWT = 6, Ntert−/− No Cre = 7 and Ntert−/− +Cre = 7 fish) and kidney marrow (C.; NWT = 6, Ntert−/− No Cre = 7 and Ntert−/− +Cre = 6 fish) tissues of 9-month-old zebrafish. Scale bar: 20µm. Dashed lines delineate gut villi (A.), mature spermatid area (B.), or kidney tubules (C.). All data are represented as mean +/- SEM (no significance was detected comparing all conditions and using one-way ANOVA and post-hoc Tukey tests). Source data
Extended Data Fig. 3
Extended Data Fig. 3. Proliferation in individual intervilli negatively correlates with local inflammation.
Intervillus-based correlation plot between cell proliferation and gut lamina propria width in 9-month-old fish. Plots illustrate the correlation between the number of PCNA positive cells within each intervillus and lamina propria width below each respective intervillus (analyzed based on the immunofluorescence staining experiment of Fig. 1f). a. Each point represents a single intervillus analyzed from either WT, tert−/− No Cre or tert−/− +Cre. b. Each point represents a single zebrafish analyzed from either WT, tert−/− No Cre or tert−/− +Cre (N = 6 fish per condition). Source data
Extended Data Fig. 4
Extended Data Fig. 4. The fabp2 promoter regulates gut specific transgene expression.
Representative images of DsRed immunofluorescence staining of cryosection from gut, testes and kidney marrow cryosections from zebrafish containing no transgene, No Cre fabp2: loxp-dsred-loxp-tert-t2a-cfp transgene or Cre-induced fabp2: loxp-dsred-loxp-tert-t2a-cfp transgene.
Extended Data Fig. 5
Extended Data Fig. 5. Gut-specific telomerase activity rescues gut metabolomic profile.
a. Heatmap clustering analysis based on untargeted metabolomic data of 9-month-old gut samples. A clustering between tert−/− +Cre and WT while tert−/− No Cre group was clearly distinguishable from others. b. Venn diagram representing downregulated (left panel) or upregulated (right panel) gut metabolites comparing the three conditions. Most metabolites detected in the gut of 9 months-old fish are concomitantly down or up-regulated in tert−/− +Cre and WT groups compared to tert−/− No Cre fish. c, d. Anaerobic glycolysis and pentose shunt metabolic profiles are rescued to WT levels in the gut of tert−/− +Cre compared tert−/− No Cre fish. Metabolomic analysis of the anaerobic glycolysis (C.) and pentose shunt pathways (D.) in gut of 9-month-old fish. All data are represented as mean +/− SEM (NWT = 8 fish, Ntert−/− No Cre = 8 fish and Ntert−/− +Cre = 9 fish; * p-value<0.05; ** p-value<0.01, *** p-value<0.001, using one-way ANOVA and post-hoc Tukey tests). Red squares: detected metabolites; blue squares: undetected metabolites. Source data
Extended Data Fig. 6
Extended Data Fig. 6. Gut-specific telomerase activity rescues citric acid cycle and steroid metabolism alterations in the gut of tert−/− fish.
a, b. Metabolomic analysis of the citric acid cycle (A.) and steroid metabolism (B.) in gut of 9-month-old fish. Citric cycle and steroid metabolic profiles in the gut of tert−/− +Cre is similar to WT when compared tert−/− No Cre fish. All data are represented as mean +/- SEM (NWT = 8 fish, Ntert−/− No Cre = 8 fish and Ntert−/− +Cre = 9 fish; * p-value<0.05; ** p-value<0.01, using one-way ANOVA and post-hoc Tukey tests; ## p-value<0.01, using Kruskal-Wallis and post-hoc Dunn’s tests). Red squares: detected metabolites; blue squares: undetected metabolites. Source data
Extended Data Fig. 7
Extended Data Fig. 7. Gut-specific tert expression rescues alterations of gut microbiota composition.
ac. tert mRNA expression in gut of tert−/− fish (tert−/− +Cre) recapitulates bacteria abundance at the class and species levels to WT profile compared to tert−/− No Cre in which pathogenic bacteria are enriched. Relative abundance analysis of bacteria at the level of class (A.); genus (B.) and species (C.) NWT = 15 fish, Ntert−/− No Cre = 15 fish and Ntert−/− +Cre = 14 fish; p values were determined using two-sided Multiple hypothesis-test for sparsely sampled features and false discovery rate (FDR). Source data

References

    1. Kenyon C, Chang J, Gensch E, Rudner A, Tabtiang R. A C. elegans mutant that lives twice as long as wild type. Nature. 1993;366:461–464. - PubMed
    1. López-Otín C, Blasco MA, Partridge L, Serrano M, Kroemer G. The hallmarks of aging. Cell. 2013;153:1194–1217. - PMC - PubMed
    1. Kenyon CJ. The genetics of ageing. Nature. 2010;464:504–512. - PubMed
    1. Funk MC, Zhou J, Boutros M. Ageing, metabolism and the intestine. EMBO Rep. 2020;21:e50047. - PMC - PubMed
    1. Kirkland JL, Tchkonia T. Senolytic drugs: from discovery to translation. J. Intern. Med. 2020;288:518–536. - PMC - PubMed

Publication types