. 2023 May;55(5):880-890.
doi: 10.1038/s41588-023-01386-y. Epub 2023 May 4.

Parallel sequencing of extrachromosomal circular DNAs and transcriptomes in single cancer cells

Affiliations

Parallel sequencing of extrachromosomal circular DNAs and transcriptomes in single cancer cells

Rocío Chamorro González et al. Nat Genet. 2023 May.

Abstract

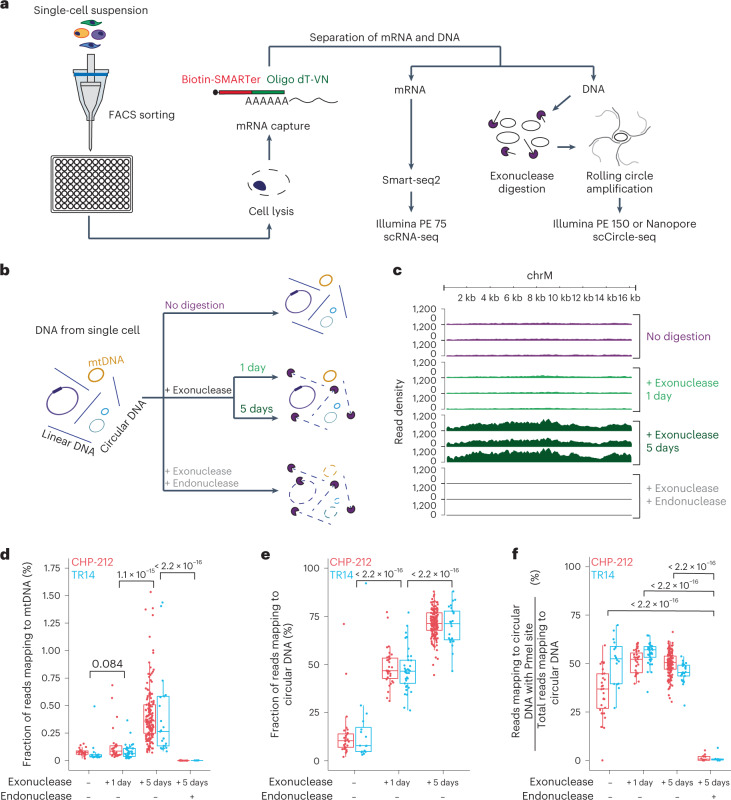
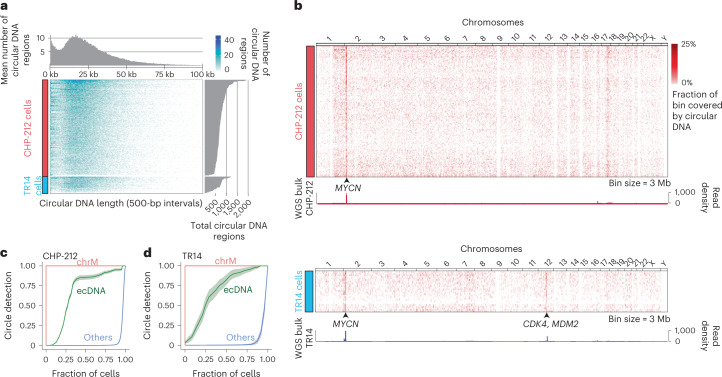
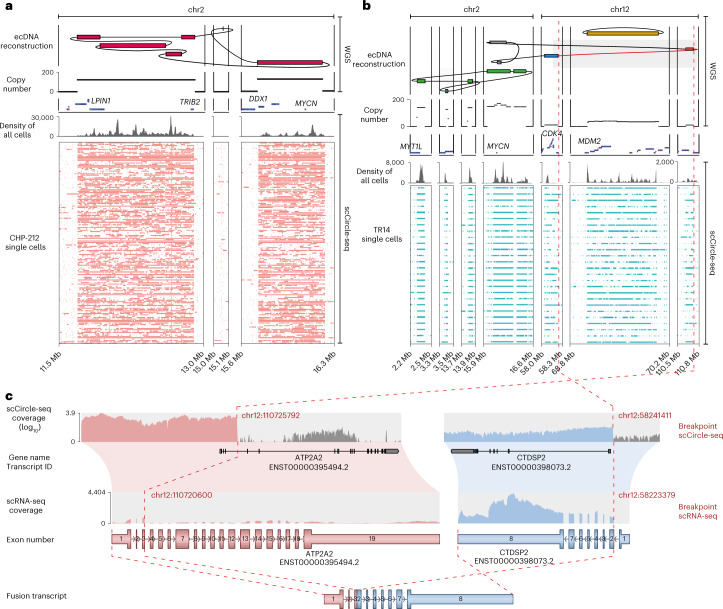
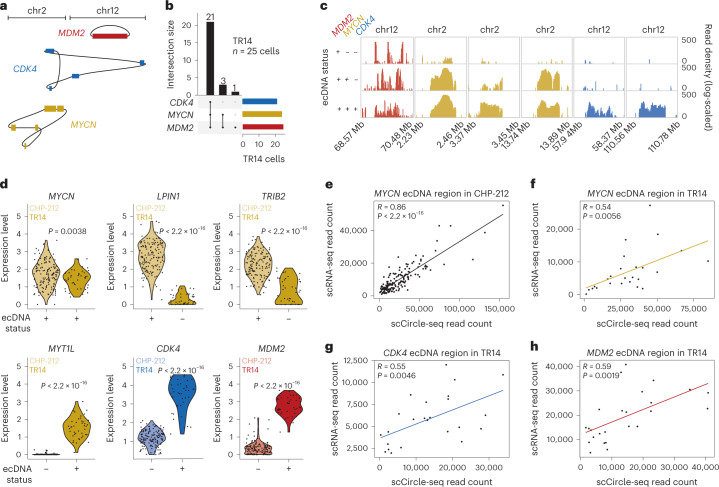
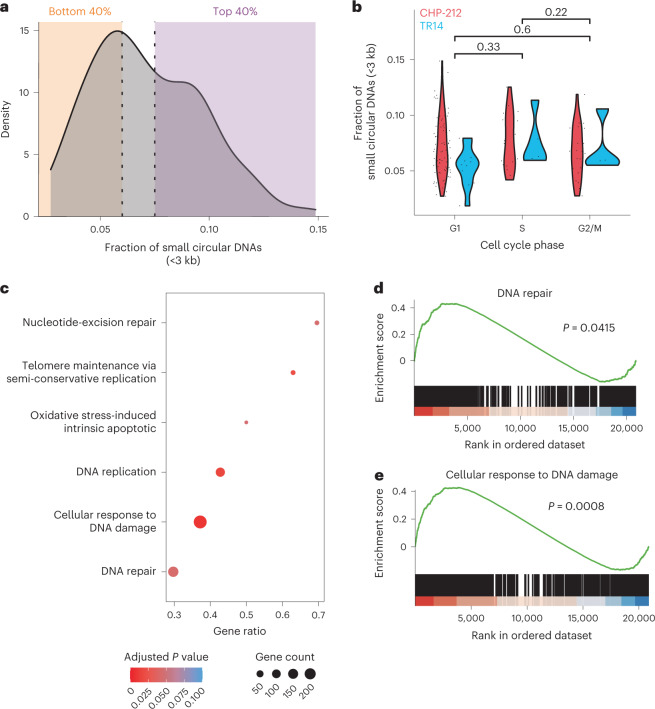
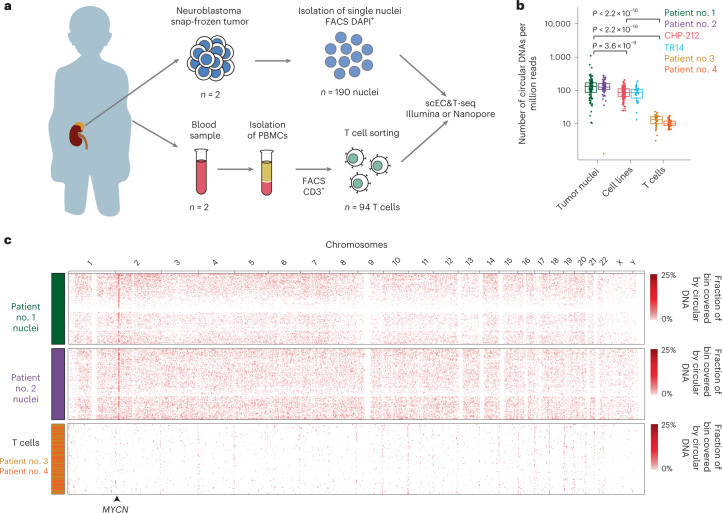
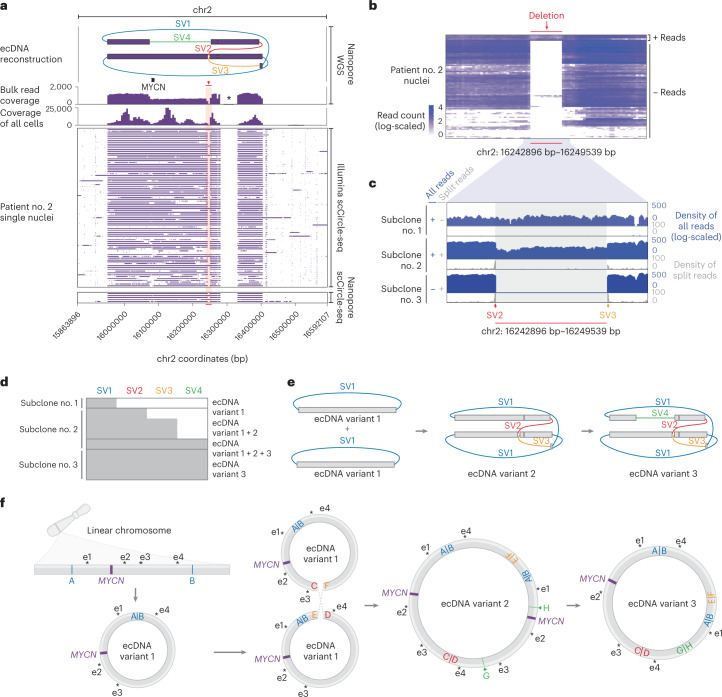
Extrachromosomal DNAs (ecDNAs) are common in cancer, but many questions about their origin, structural dynamics and impact on intratumor heterogeneity are still unresolved. Here we describe single-cell extrachromosomal circular DNA and transcriptome sequencing (scEC&T-seq), a method for parallel sequencing of circular DNAs and full-length mRNA from single cells. By applying scEC&T-seq to cancer cells, we describe intercellular differences in ecDNA content while investigating their structural heterogeneity and transcriptional impact. Oncogene-containing ecDNAs were clonally present in cancer cells and drove intercellular oncogene expression differences. In contrast, other small circular DNAs were exclusive to individual cells, indicating differences in their selection and propagation. Intercellular differences in ecDNA structure pointed to circular recombination as a mechanism of ecDNA evolution. These results demonstrate scEC&T-seq as an approach to systematically characterize both small and large circular DNA in cancer cells, which will facilitate the analysis of these DNA elements in cancer and beyond.


Conflict of interest statement

R.P.K. and A.G.H. are founders of Econic Biosciences Ltd.

Figures

Fig. 1
Fig. 1. scEC&T-seq enables enrichment and detection of circular DNA in single cells.
a, Schematic of the scEC&T-seq method. b, Schematic representation of the experimental conditions and expected outcomes. c, Genome tracks comparing read densities on mtDNA (chrM) in three exemplary CHP-212 cells for each experimental condition tested. Top to bottom, No digestion (purple), 1-day exonuclease digestion (light green), 5-day exonuclease digestion (dark green) and endonuclease digestion with PmeI before 5-day exonuclease digestion (gray). d, Fraction of sequencing reads mapping to mtDNA in each experimental condition in CHP-212 (red) and TR14 (blue) cells. e, Fraction of sequencing reads mapping to circular DNA regions identified by scEC&T-seq in each experimental condition in CHP-212 and TR14 cells. f, Fraction of sequencing reads mapping to circular DNA regions with the endonuclease PmeI targeting the sequence identified by scEC&T-seq in each experimental condition in CHP-212 and TR14 cells. df, Sample size is identical across conditions: no digestion (n = 16 TR14 cells, n = 28 CHP-212 cells); 1-day exonuclease digestion (n = 37 TR14 cells, n = 31 CHP-212 cells); 5-day exonuclease digestion (n = 25 TR14 cells, n = 150 CHP-212 cells); and endonuclease digestion with PmeI before 5-day exonuclease digestion (n = 6 TR14 cells, n = 12 CHP-212 cells). All statistical analyses correspond to a two-sided Welch’s t-test. P values are shown. In all boxplots, the boxes represent the 25th and 75th percentiles with the center bar as the median value and the whiskers representing the furthest outlier ≤1.5× the interquartile range (IQR) from the box. Source data
Fig. 2
Fig. 2. Oncogene-containing ecDNAs are recurrently identified in neuroblastoma single cells.
a, Heatmap displaying the number and length of individual circular DNA regions (<100 kb) identified by scEC&T-seq in CHP-212 and TR14 neuroblastoma single cells (n = 150 CHP-212 cells, n = 25 TR14 cells; bin size = 500 bp) with density distribution for circular DNA sizes (top) and overall circular DNA counts (right). b, Heatmap of genome-wide circular DNA density in CHP-212 and TR14 neuroblastoma single cells (top: n = 150 CHP-212 cells, bin size = 3 Mb; bottom: n = 25 TR14 cells, bin size = 3 Mb), and genome tracks displaying genome-wide read density from WGS in bulk cell populations. The location of the MYCN gene in chromosome 2 is shown. c, d, Recurrence analysis in CHP-212 (n = 150) (c) and TR14 (n = 25) (d) cells displayed as the fraction of cells containing a detected circular DNA from each circular DNA type. ecDNA was defined as circular DNAs overlapping with copy number-amplified regions identified in bulk sequencing (green) and mtDNA or chrM (red). ‘Others’ are defined as all other small circular DNAs (blue). Data are presented as the mean ± s.e.m.
Fig. 3
Fig. 3. scEC&T-seq captures the complex structure of multifragmented ecDNAs in single neuroblastoma cells.
a, b, Long- and short-read-based ecDNA reconstructions derived from WGS data in bulk cell populations and read coverage over the ecDNA fragments across single cells in CHP-212 (n = 150) (a) and TR14 (n = 25) cells (b) as detected by scEC&T-seq. Top to bottom, ecDNA amplicon reconstruction, copy number profile, gene annotations, read density over the ecDNA region in merged single cells and coverage over the ecDNA region in single cells (rows). c, Exemplary fusion transcript detected by scEC&T-seq resulting from the rearrangement of chromosomal segments in the CDK4 ecDNA in TR14. Top to bottom, scCircle-seq read coverage over the breakpoint region in merged TR14 single cells (log-scaled), transcript annotations, scRNA-seq read coverage over the fused transcripts in merged TR14 single cells, native transcript representations and fusion transcript representation. The interconnected genomic segments in CDK4 ecDNA that give rise to the fusion gene are indicated by a red dashed line.
Fig. 4
Fig. 4. Intercellular differences in ecDNA content drive gene expression differences.
a, Schematic representation of the three independent ecDNAs identified in TR14: MYCN ecDNA (yellow); CDK4 ecDNA (blue); and MDM2 ecDNA (red). b, UpSet plot displaying the co-occurrence of the three ecDNAs identified in TR14 (MDM2, CDK4, MYCN) in single cells (n = 25 TR14 cells). c, Genome tracks with read densities (log-scaled) over reconstructed ecDNA regions in three exemplary TR14 cells showing different ecDNAs detected. d, Violin plots of mRNA expression levels in TR14 and CHP-212 single cells (two-sided Welch’s t-test; P = 0.0038 (MYCN), P < 2.2 × 10−16 (LPIN1, TRIB2, CDK4, MDM2, MYT1L)); n = 171 CHP-212 cells, n = 42 TR14 cells. e, f, Pairwise comparison between ecDNA and mRNA read counts from scEC&T-seq over the reconstructed MYCN ecDNA region in CHP-212 single cells (two-sided Pearson correlation, P < 2.2 × 10−16, R = 0.86, n = 150 cells) (e) and in TR14 single cells (two-sided Pearson correlation, P = 0.0056, R = 0.54, n = 25 cells) (f). g, h, Pairwise comparison between ecDNA and mRNA read counts from scEC&T-seq over the reconstructed CDK4 (g) and MDM2 (h) ecDNAs in TR14 single cells (two-sided Pearson correlation, P = 0.0046, R = 0.55 for CDK4 and P = 0.0019, R = 0.59 for MDM2, n = 25 TR14 cells). Source data
Fig. 5
Fig. 5. High relative content of small circular DNAs is associated with DNA damage response pathway activation.
a, Density plot of relative small circular DNA (<3 kb) content in CHP-212 single cells (n = 129). For differential expression analyses, cells were divided in two categories: ‘low’ (orange area, bottom 40%) and ‘high’ (purple area, top 40%). b, Violin plot comparing the relative number of small circular DNAs (<3 kb) at different cell cycle phases in CHP-212 (red, n = 129) and TR14 (blue, n = 20) single cells. A two-sided Welch’s t-test was used among the indicated conditions. P values are shown. c, Cellular processes significantly enriched in CHP-212 cells with high relative very small circular DNA content. Adjusted P values and gene counts are shown. d, Gene set enrichment analysis (GSEA) plot of genes involved in DNA repair (adjusted P = 0.0415). e, GSEA plot of genes involved in the cellular response to the DNA damage stimulus (adjusted P = 0.0008). P values were adjusted using the Bejamini–Hochberg method.
Fig. 6
Fig. 6. scEC&T-seq detects circular DNAs in primary neuroblastomas at the single-cell level.
a, Schematic diagram describing tumor and blood sample processing. b, Number of individual circular DNA regions normalized by library size detected in primary tumor nuclei (n = 93 nuclei patient no. 1, n = 86 nuclei patient no. 2), neuroblastoma cell line single cells (n = 25 TR14 cells, n = 150 CHP-212 cells) and nonmalignant single T cells (n = 38 patient no. 3, n = 41 patient no. 4). P values were calculated using a two-sided Welch’s t-test and are shown. The boxes in the boxplots represent the 25th and 75th percentiles with the center bar as the median value and the whiskers representing the furthest outlier ≤1.5× the IQR from the box. c, Heatmap of the genome-wide circular DNA density in neuroblastoma primary tumors and normal T cells (n = 93 patient no. 1, green; n = 86 patient no. 2, purple; n = 38 patient no. 3, yellow; n = 41 patient no. 4, orange; bin sizes = 3 Mb). The location of the MYCN gene in chr2 is shown.
Fig. 7
Fig. 7. scEC&T-seq profiles intercellular structural ecDNA heterogeneity in neuroblastomas.
a, Long read-based ecDNA reconstructions derived from WGS data in bulk populations and read coverage over the ecDNA fragments across single nuclei in patient no. 2 (n = 86 nuclei) as detected by long-read or short-read scEC&T-seq. Top to bottom, ecDNA amplicon reconstruction (the SVs on ecDNAs are colored; SV nos. 1–4), gene annotation, read density over the ecDNA region in bulk long-read Nanopore WGS data, read density over the ecDNA region in merged single nuclei and coverage over the ecDNA region in single nuclei (rows) as detected by long-read or short-read scEC&T-seq. The 6-kb deletion is highlighted in red. The single asterisk indicates the unmappable region of the reference genome (hg19). b, Heatmap of the total number of reads (log-scaled) in a 500-bp window over the identified 6-kb deletion on ecDNA across single nuclei in patient no. 2 (n = 86 nuclei). c, Exemplary genome tracks of the three identified clone variants in patient no. 2 based on the absence or presence of the 6-kb deletion on the ecDNA element. The log-scaled total read density is shown in blue and the circle edge-supporting read density is shown in gray. d, Detection of SV nos. 1–4 supporting the multifragmented ecDNA element in eight exemplary single cells representing the three identified clone variant groups (≥1 read supporting the SV, gray; 0 reads supporting the SV, white). e, Schematic representation of ecDNA variants 1–3 detected in d. f, Schematic interpretation of the evolution of the ecDNA structure in patient no. 2 based on the identified ecDNA variants in the scEC&T-seq data. The position of the MYCN oncogene and its local enhancer elements (e1–e5), indicated by the single asterisks, in each ecDNA variant is shown.

References

    1. Stuart T, Satija R. Integrative single-cell analysis. Nat. Rev. Genet. 2019;20:257–272. - PubMed
    1. Turner KM, et al. Extrachromosomal oncogene amplification drives tumour evolution and genetic heterogeneity. Nature. 2017;543:122–125. - PMC - PubMed
    1. Koche RP, et al. Extrachromosomal circular DNA drives oncogenic genome remodeling in neuroblastoma. Nat. Genet. 2020;52:29–34. - PMC - PubMed
    1. Shibata Y, et al. Extrachromosomal microDNAs and chromosomal microdeletions in normal tissues. Science. 2012;336:82–86. - PMC - PubMed
    1. Møller HD, et al. Circular DNA elements of chromosomal origin are common in healthy human somatic tissue. Nat. Commun. 2018;9:1069. - PMC - PubMed

Publication types