

High-resolution transcriptomic and epigenetic profiling identifies novel regulators of COPD
- PMID: 37143403
- PMCID: PMC10267701
- DOI: 10.15252/embj.2022111272
High-resolution transcriptomic and epigenetic profiling identifies novel regulators of COPD
Abstract
Patients with chronic obstructive pulmonary disease (COPD) are still waiting for curative treatments. Considering its environmental cause, we hypothesized that COPD will be associated with altered epigenetic signaling in lung cells. We generated genome-wide DNA methylation maps at single CpG resolution of primary human lung fibroblasts (HLFs) across COPD stages. We show that the epigenetic landscape is changed early in COPD, with DNA methylation changes occurring predominantly in regulatory regions. RNA sequencing of matched fibroblasts demonstrated dysregulation of genes involved in proliferation, DNA repair, and extracellular matrix organization. Data integration identified 110 candidate regulators of disease phenotypes that were linked to fibroblast repair processes using phenotypic screens. Our study provides high-resolution multi-omic maps of HLFs across COPD stages. We reveal novel transcriptomic and epigenetic signatures associated with COPD onset and progression and identify new candidate regulators involved in the pathogenesis of chronic lung diseases. The presence of various epigenetic factors among the candidates demonstrates that epigenetic regulation in COPD is an exciting research field that holds promise for novel therapeutic avenues for patients.
Keywords: COPD; DNA methylation; RNA sequencing; WGBS; human lung fibroblasts.
© 2023 The Authors. Published under the terms of the CC BY NC ND 4.0 license.
Conflict of interest statement
During their employment at BioMed X Institute, RZJ, MLP, VM, US, RT, MR, SP, OS, and BM received research funding by Boehringer Ingelheim Pharma GmbH & Co KG. HS, BJ, MSchu, CK, KQ and DWy are employees of Boehringer Ingelheim Pharma GmbH & Co KG and receive compensation as such. TM received a research grant, non‐financial support and has patent applications with Roche Diagnostics GmbH outside of the described work. CPH has stock ownership in GSK; received research funding from Siemens, Pfizer, MeVis, and Boehringer Ingelheim; consultation fees from Schering‐Plough, Pfizer, Basilea, Boehringer Ingelheim, Novartis, Roche, Astellas, Gilead, MSD, Lilly Intermune, and Fresenius, and speaker fees from Gilead, Essex, Schering‐Plough, AstraZeneca, Lilly, Roche, MSD, Pfizer, Bracco, MEDA Pharma, Intermune, Chiesi, Siemens, Covidien, Boehringer Ingelheim, Grifols, Novartis, Basilea, and Bayer, outside the submitted work. HW received consultation fees from Intuitive and Roche.
Figures

- A
Lung function data of COPD (II‐IV) and no COPD (ex‐smoker controls) donors used in this study. The lung function between the two groups is significantly different.
- B
Schematic diagram illustrating the experimental approach used for epigenetic (T‐WGBS) and transcriptomic (RNA‐seq) profiling of purified primary parenchymal lung fibroblasts.
- C–I
T‐WGBS data of primary fibroblasts from no COPD and COPD (II–IV) patients were analyzed at single CpGs level (C) and on DMRs (D–I).
- C
Genome wide CpG methylation statistics. Bar plot showing the fraction of high (> 80%), moderate (20–80%), and low (< 20%) methylated CpGs in no COPD and COPD (II–IV) samples.
- D
Number of hyper‐ or hypomethylated DMRs in COPD (II‐IV).
- E
Detailed view of a representative hypo‐ (top) and hypermethylated (bottom) DMR (gray box). CpG methylation levels of each individual donor (dots) and the group average (lines) methylation profile of three no COPD (blue) and five COPD (II–IV) (dark green) donors are displayed. RefSeq annotated genes and CpG islands are indicated.
- F
Heatmap of 6,279 DMRs identified in COPD (II‐IV). Statistically significant DMRs (at significance level = 0.1; see methods for DMR calling details) with at least three CpGs and a mean difference in methylation between no COPD and COPD (II–IV) of ≥ 10% were selected. Color shades indicate low (light) or high (dark) DMR methylation.
- G
PCA of COPD (II–IV) (dark green), no COPD (blue), and mild COPD (I) (light green, samples not used for initial DMR calling) on identified 6,279 DMRs.
- H
K‐means clustering of all DMRs identified between no COPD and COPD (II–IV) across all samples, including COPD (I). Three clusters were identified. Cluster 1 shows early hypomethylation in COPD (I), clusters 2 and 3, gradual hyper‐ and hypomethylation, respectively. Donors are sorted according to their FEV1 value as indicated at the bottom.
- I
Representative methylation profiles at selected DMRs from each cluster. Group median CpG methylation is shown for no COPD (blue), COPD (I) (light green), and COPD (II–IV) (dark green). RefSeq annotated genes and CpG islands are indicated.

- A
Characteristics of the lung tissue donors used in this study for fibroblast isolation. Lung function between COPD and smoker control group (no COPD) is significantly different (*P‐value < 0.05; non‐parametric unpaired Kruskal–Wallis test).
- B
Examples of hematoxylin and eosin (H&E) staining of tissue samples from the study cohort: no COPD, COPD (I), COPD (II), COPD (III) and COPD (IV). Scale bars: 0.1 mm.
- C, D
Validation of the purity of isolated fibroblast by FACS (C) and immunofluorescence (D).
- C
Left, contour plot of lung live‐single cell suspensions from COPD (green) and no COPD (blue) donors gated as indicated above. Right, contour plot of trypsinized fibroblasts from COPD (green) and no COPD (blue) donors. EpCAM‐PE was used as an epithelial marker and CD45‐Bv605 as an immune marker.
- D
Immunofluorescence staining of fibroblasts isolated from the lungs of COPD (top) and no COPD (bottom) donors and stained with antibodies against vimentin (VIM, mesenchymal marker) and alpha smooth‐muscle actin (αSMA, myofibroblast marker). DAPI was used to counterstain the nuclei. Scale bars: 0.1 mm.
- E
Read coverage at single CpG sites in each sample.
- F, G
Histograms showing the number of CpGs per DMR (F) and the DMR size distribution (G). Median values are indicated and highlighted by a vertical line.
- H
Scatter plot showing correlation of average methylation differences in COPD between DMRs identified in this study and published 450 k methylation array data of parenchymal fibroblasts (Clifford et al, 2018). Each dot represents one DMR covered by at least three CpG probes of the array. The blue diagonal represents the linear regression. Shaded areas are confidence intervals of the correlation coefficient at 95%.
- I
Hierarchical clustering of all samples based on 6,279 DMRs identified between no COPD and COPD (II–IV).
- J
Functional annotation of genes located next to hypomethylated DMRs using GREAT. Left, hits were sorted according to the binominal P‐value and the top 15 hits are shown. The adjusted P‐value is indicated by the color code and the number of DMR‐associated genes is indicated by the node size. Right, the percentage of DMRs associated to processes shown on the left belonging to clusters 1 (orange) and 3 (purple) (clusters defined in Fig 1H).
- K
Scatter plots showing correlation of average methylation obtained with T‐WGBS and Mass Array from commercial COPD and smoker fibroblasts. Each dot represents one region with varying methylation levels. The blue diagonal represents the linear regression. Shaded areas are confidence intervals of the correlation coefficient at 95%. Correlation coefficients and P‐values were calculated by the Pearson correlation method.
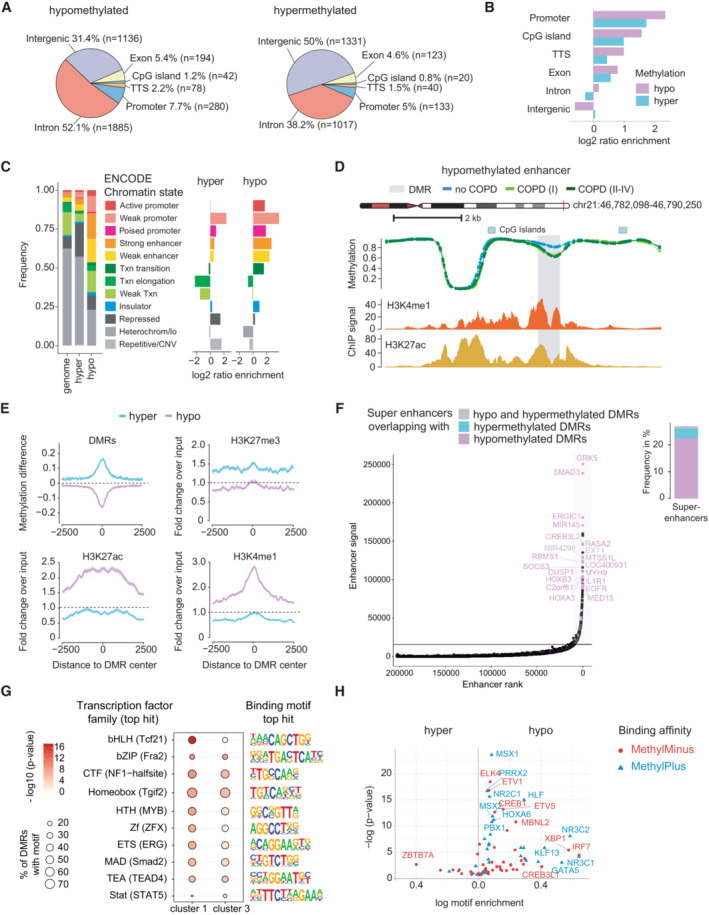
- A, B
Genomic location of identified DMRs. (A) Distribution of genomic features overlapping with hypo‐ (left) and hypermethylated (right) DMRs. (B) Enrichment of genomic features at hypo‐ (purple) and hypermethylated (cyan) DMRs compared to a sampled background of 10,000 regions exhibiting no significant change in methylation.
- C
Distribution of human lung fibroblast specific chromatin states (ENCODE accession: ENCFF001TDQ) at hypo‐ and hypermethylated DMRs. Fraction of DMRs overlapping with specific chromatin states is shown on the left panel. The genome background was sampled using 10,000 regions with matching GC content exhibiting no significant change in methylation. Chromatin state enrichment relative to the genome background is illustrated in the right panel.
- D
Genome browser view of an examplary DMR at a putative enhancer region. Group median CpG methylation is shown for no COPD (blue), COPD (I) (light green), and COPD (II–IV) (dark green). At the bottom the level of enhancer marks is depicted as fold‐change over control: H3K4me1 (ENCODE accession: ENCFF102BGI) and H3K27ac (ENCODE accession: ENCFF386FDQ).
- E
Alterations of DNA methylation and selected histone marks around DMRs. Solid lines represent the mean profile and shaded lines the standard error of the mean across all summarized regions. Dashed lines indicate the expected signal value at sites, which are not changed, i.e. 0 for methylation difference in COPD (II–IV) to no COPD and 1 for the fold change to input in ChIP‐seq experiments.
- F
Ranking of enhancer elements, defined by the co‐occurrence of H3K4me1 and H3K27ac signals in human lung fibroblasts. The horizontal line defines the signal and corresponding rank threshold used to identify super enhancers (SE). Selected SE overlapping with DMRs are annotated and the nearest gene to the SE is indicated. The fraction of SEs overlapping with hypo‐ (purple), hypermethylated (cyan) or both (gray) is illustrated in the bar plot on the right panel.
- G
Transcription factor motifs most enriched at DMRs overlapping with strong enhancers (ENCODE chromatin states) from cluster 1 and 3 (see Fig 1H).
- H
Enrichment of methylation‐sensitive transcription factor motifs at hypo‐ (right) and hypermethylated (left) DMRs. Methylation‐sensitive motifs were derived from the study of Yin et al (2017). Transcription factors, whose binding affinity was impaired upon methylation of their corresponding DNA motif are shown in red (MethylMinus) and transcription factors, whose binding affinity was increased, in blue (MethylPlus). TTS, transcription termination site.

- A
Number of DMRs associated with super‐enhancers.
- B, C
Genome browser views of two super‐enhancer regions overlapping with identified DMRs (shaded in gray). Group median CpG methylation is shown for no COPD (blue), COPD (I) (light green), and COPD (II–IV) (dark green). At the bottom, the level of enhancer marks: H3K4me1 (ENCODE accession: ENCFF102BGI; red track) and H3K27ac (ENCODE accession: ENCFF386FDQ; orange track) is depicted as fold change over control.

Volcano plot of differentially expressed genes (DEGs) (red dots; FDR < 0.05 and |log2(fold change)| > 0.5) in COPD (II–IV, n = 3) compared to no COPD controls (n = 5). Protein‐coding (blue) and lincRNA (orange) with the highest expression change or lowest P‐values are labeled.
Unsupervised hierarchical clustering of all samples, including COPD (I) based on DEGs (n = 620) identified between no COPD and COPD (II–IV) samples.
Self‐organizing maps (SOM) clustering based on the scaled median expression level per group of the 620 DEG identified between COPD (II–IV) and no COPD samples. DEGs were grouped into six distinct clusters showing different kinetics in COPD progression: Clusters 1 and 6 show late changes. Clusters 2 and 5 display changes gradually progressing with disease severity. Clusters 3 and 4 correspond to early changes observed already in COPD (I). Left panel shows the row scaled (z‐scores) expression levels per group as heatmap; right panel illustrates the distribution of the scaled expression levels in each group across all cluster as boxplots. The box represents the interquartile range (IQR). The line inside the box represents the median of the dataset. The whiskers extend from the edges of the box to the first and third quartiles, but no further than 1.5 times of the IQR. Any data points outside this range are plotted individually as dots. The dashed line connects the medians of the groups in each cluster. The number of each genes within the corresponding cluster is indicated on the right.
Selected examples of DEG across disease stages from clusters 2–5 defined in (C).
DEGs associated with altered biological processes (gray bubbles) in COPD. DEG nodes are colored according to their corresponding gene expression kinetic in COPD (clusters defined in C).

- A
Normalized RNA‐seq read counts of four exemplary differentially expressed lincRNAs.
- B, C
Functional annotation of upregulated (B) and downregulated (C) DEGs. Top 5 enriched GO biological process terms are shown on top of each panel. Bottom panels show a more detailed overview of the biological processes enriched for upregulated (B) and downregulated (C) DEGs. Biological processes are connected, if DEGs associated with both processes are in common.
- D
Gene set enrichment analysis (GSEA) of down/up‐regulated genes in COPD. Gene sets of significantly up‐ (red line) or down‐regulated (blue) genes in human lung fibroblasts of COPD patients were compared to transcriptional changes in whole tissue RNA extractions (Kim et al, 2015). Genes were sorted and ranked by the expression fold change (log2(COPD/no COPD)) in the Kim et al data set. P‐values were derived from permutation analysis in the GSEA.
- E
Unsupervised principal component analysis (PCA) of all samples based on the 500 most variable expressed genes.

DMRs located in the proximity of annotated protein‐coding and lincRNA genes. DMRs within ± 4 kb from gene body were assigned to their corresponding gene. TSS, transcription start site; TTS, transcription termination site.
Gene features of gene‐associated DMRs. Promoter is defined as the region of −1 kb to +100 bp around the TSS.
DMRs located in the proximity of the TSS of DEGs. DMRs within ± 4 kb from TSS of DEG were assigned to their corresponding gene.
Spearman correlation between gene expression and DMR methylation. DMRs within ± 4 kb from TSS were considered. Gene‐DMR pairs were split into DEGs (red) and not significantly changed genes (no DEG, blue).
K‐means clustering of DMRs and associated DEGs. The heatmaps show the z‐scores of either rlog normalized expression counts (gene expression) or beta values (DNA methylation). Line diagram on the right side depicts the cluster centroids of each sample for gene expression (salmon) and DNA methylation data (turquoise).
Scatter plots showing examples of correlations between gene expression and methylation of promoter associated DMRs. Each dot represents an individual donor. Dots are color coded according to disease state. Gene expression is illustrated as normalized counts. Methylation is illustrated as average beta value of the corresponding DMR.

Representative methylation profiles and DMRs (shaded in gray). Group median CpG methylation is shown for no COPD (blue), COPD (I) (light green), and COPD (II–IV) (dark green). RefSeq annotated genes and CpG islands are indicated.
Location of hyper‐ and hypomethylated DMRs relative to the TSS of DEGs in downregulated (left) and upregulated (right) genes.
Fraction of genes associated with at least one DMR in the proximity (± 4 kb) of the TSS are indicated in blue. Genes were split into not significantly changed genes (left bar, FALSE) and DEGs (right bar, TRUE). DMRs are significantly enriched at DEGs.
Biological processes enriched at DMR associated DEGs. DEGs nodes (colored bubbles) are connected with their associated processes. DEGs and integration clusters are indicated by squares and circles, respectively.
Examples of genes showing correlation between gene expression and methylation. Scatter plots showing positive (left, AQP3) and negative (right, LPXN) correlation between gene expression and methylation of promoter‐associated DMR. Each dot represents an individual donor. Dots are color coded according to disease state. Gene expression is illustrated as normalized counts and methylation is illustrated as average beta value of the corresponding DMR. Linear regression analysis (black line) and 95% confidence interval are shown (gray area).

Schematic representation of the siRNA‐based phenotypic assays performed in primary normal human lung fibroblasts (NHLFs, two donors) and diseased/COPD human lung fibroblasts (DHLFs, three donors).
Examples of primary pictures obtained in the screens showing the performance of the siRNA controls as well as positive hits upon KD. Scale bars: 0.05 mm.
Heatmap showing the effect of the KD of each candidate gene on the three measured readouts (αSMA, col1 and proliferation) in primary normal (NHLF) or COPD (DHLF) human lung fibroblasts, red: readout higher than NTC, blue: readout lower than NTC. |SSMD values| ≥ 2 are shown in lighter shade and |SSMD values| ≥ 3 in stronger shade.
Scatterplots showing the correlation of the screen data from two different NHLFs donors (left) and two different DHLFs (right) for the αSMA readout.
Comparison of the KD effect of each candidate relative to NTCs in NHLFs and DHLFs. Each dot represents a unique candidate tested, blue and red dots represent significant hits (|SSMD values| ≥ 2 are shown in lighter shade and |SSMD values| ≥ 3 in stronger shade). Assay controls are labeled in black and examples of strong hits regulating fibroblast to myofibroblast transition and cell proliferation processes are labeled in blue.
Dot plot showing examples of positive hits with significant differences between NHLFs (2 donors, 2 biological replicates each, shown in green) and DHLFs (3 donors, 2 biological replicates each, shown in orange) in αSMA readout. Screen readout was normalized to the corresponding NTC. TGFβR1 and ACTA2 represent positive screen controls. The results of all replicates are shown.

Distribution of candidates selected for functional validation among different categories (related to Fig 5C). The selected candidates were divided into seven categories: (i) epigenetic players dysregulated on the transcriptional level, (ii) DMR motif includes transcription factors with binding sites overrepresented in DMRs, (iii) upstream regulators identified by the Ingenuity Pathway Analysis, (iv) DMR‐DEG correlation represents differentially expressed genes correlated with epigenetic changes in their promoter, (v) top downregulated DEGs, (vi) top upregulated DEGs, and (vii) lncRNA for the top dysregulated long non‐coding RNAs. In addition, three assay controls (ACTA2, TGFβR1 and BRD4) were included.
Scatterplots showing the correlation of the data obtained from two different NHLF (left) and two DHLF (right) donors in the phenotypic screens using col1 and proliferation/nuclei count as readouts.
Examples of epigenetic hits from the siRNA screen for each indicated readout. Each dot represents a unique candidate tested, blue and red dots represent significant hits (|SSMD values| ≥ 2 are shown in lighter shade and |SSMD values| ≥ 3 in stronger shade). Assay controls are labeled in black and epigenetic factors identified as strong positive hits (|SSMD values| ≥ 3) in fibroblast to myofibroblast transition and cell proliferation processes are labeled in blue or red depending on the effect on each readout upon KD.
Dot plots showing examples of positive hits with significant differences between NHLFs (2 donors, 2 biological replicates each, shown in green) and DHLFs (3 donors, 2 biological replicates each, shown in orange) in col1 and proliferation/nuclei count readout. Screen readout was normalized to the corresponding non‐targeting siRNA control (NTC). TGFβR1 and ACTA2 represent screen controls. The results of all replicates are shown.
Relative changes in gene expression (2−ΔΔCt) for LPXN, AQP3, GLI4, TGFβR1 and ACTA2 upon gene knockdown using the indicated siRNAs in human lung primary fibroblasts. Gene expression was measured by RT–qPCR using non‐target control (NTC) samples as reference and RLP0 (LPXN, AQP3, GLI4) or RNA‐polymerase II (TGFβR1, ACTA2) as housekeeping gene. Each dot represents the mean of two technical replicates from at least 3 independent experiments. Bars show median and error bars denote 95% CI of at least three biological replicates (n > 3).
References
Publication types
MeSH terms
LinkOut - more resources
Full Text Sources
Medical
