. 2023 Apr 18:14:1155552.
doi: 10.3389/fimmu.2023.1155552. eCollection 2023.

Haemagglutination inhibition and virus microneutralisation serology assays: use of harmonised protocols and biological standards in seasonal influenza serology testing and their impact on inter-laboratory variation and assay correlation: A FLUCOP collaborative study

Affiliations

Haemagglutination inhibition and virus microneutralisation serology assays: use of harmonised protocols and biological standards in seasonal influenza serology testing and their impact on inter-laboratory variation and assay correlation: A FLUCOP collaborative study

Joanna Waldock et al. Front Immunol. .

Abstract

Introduction: The haemagglutination inhibition assay (HAI) and the virus microneutralisation assay (MN) are long-established methods for quantifying antibodies against influenza viruses. Despite their widespread use, both assays require standardisation to improve inter-laboratory agreement in testing. The FLUCOP consortium aims to develop a toolbox of standardised serology assays for seasonal influenza. Building upon previous collaborative studies to harmonise the HAI, in this study the FLUCOP consortium carried out a head-to-head comparison of harmonised HAI and MN protocols to better understand the relationship between HAI and MN titres, and the impact of assay harmonisation and standardisation on inter-laboratory variability and agreement between these methods.

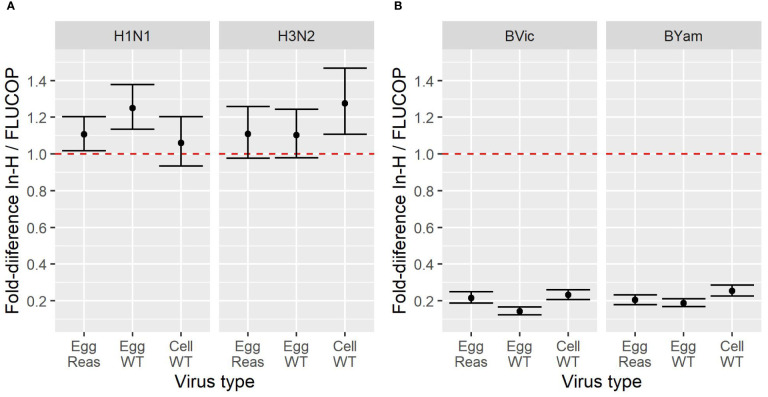
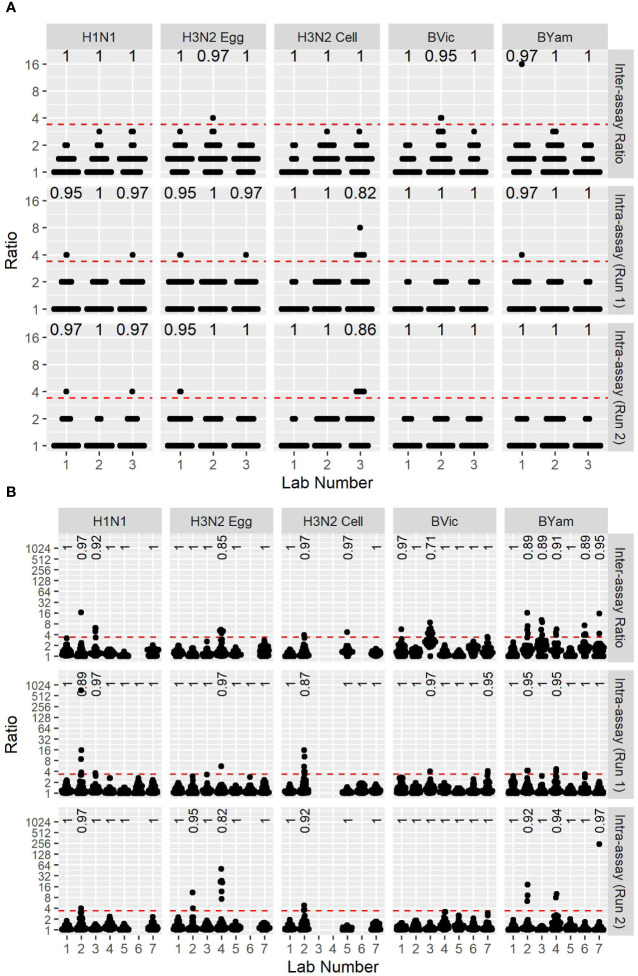
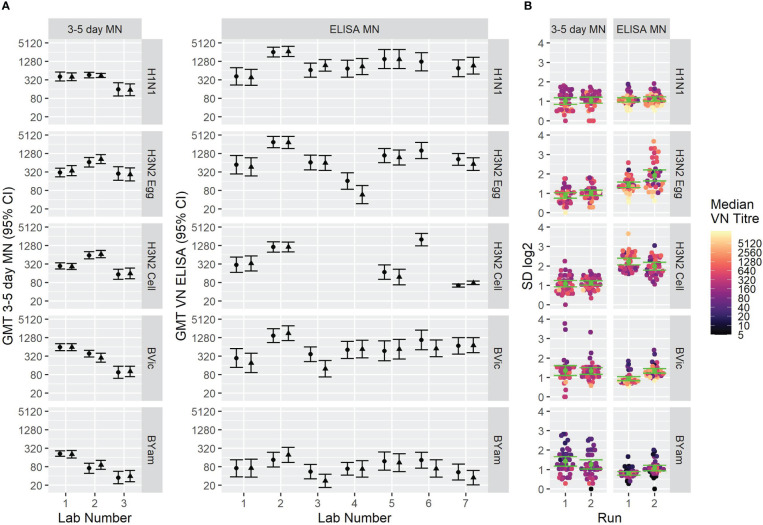
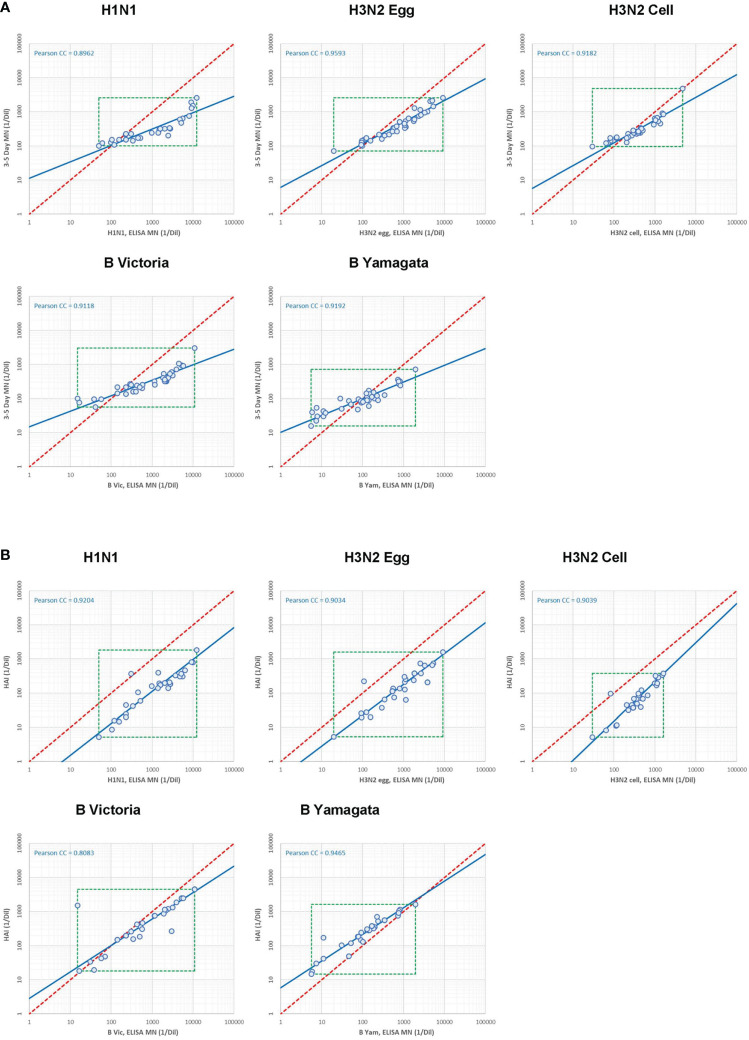
Methods: In this paper, we present two large international collaborative studies testing harmonised HAI and MN protocols across 10 participating laboratories. In the first, we expanded on previously published work, carrying out HAI testing using egg and cell isolated and propagated wild-type (WT) viruses in addition to high-growth reassortants typically used influenza vaccines strains using HAI. In the second we tested two MN protocols: an overnight ELISA-based format and a 3-5 day format, using reassortant viruses and a WT H3N2 cell isolated virus. As serum panels tested in both studies included many overlapping samples, we were able to look at the correlation of HAI and MN titres across different methods and for different influenza subtypes.

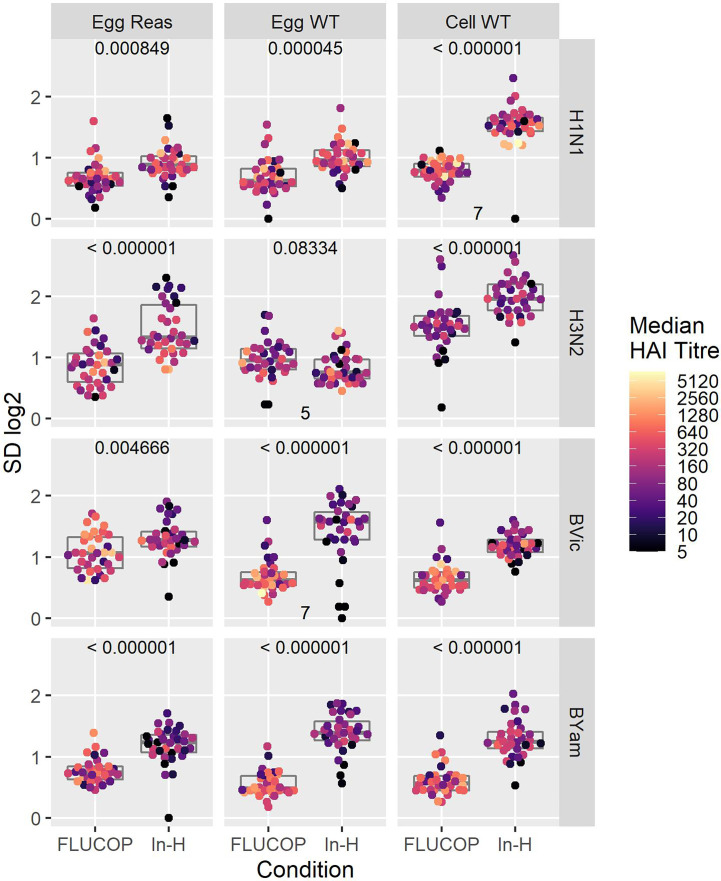
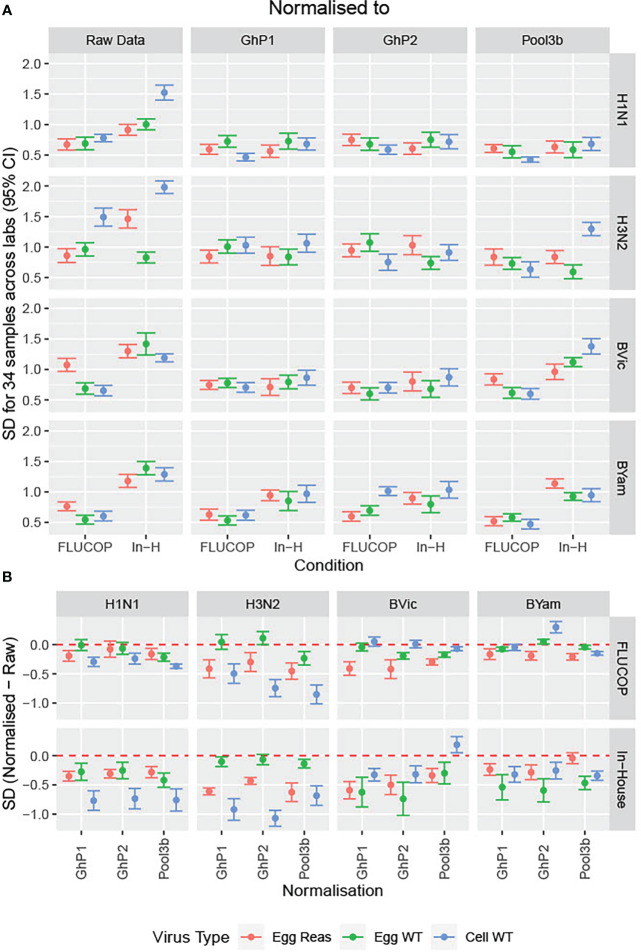
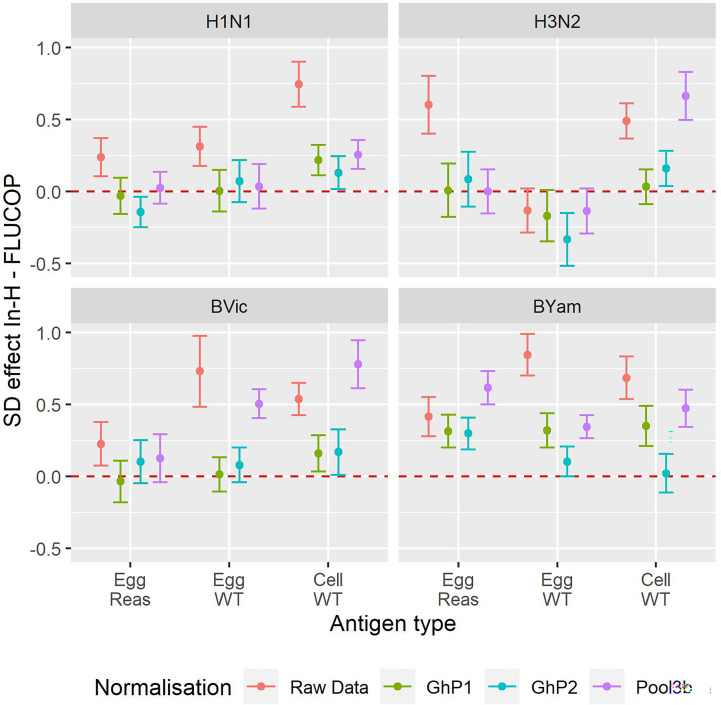
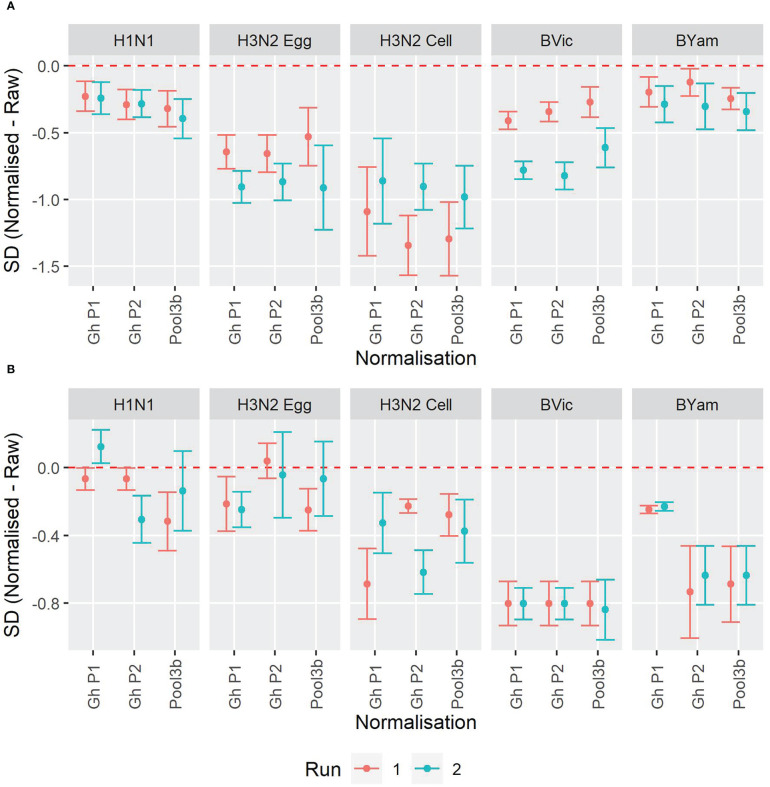
Results: We showed that the overnight ELISA and 3-5 day MN formats are not comparable, with titre ratios varying across the dynamic range of the assay. However, the ELISA MN and HAI are comparable, and a conversion factor could possibly be calculated. In both studies, the impact of normalising using a study standard was investigated, and we showed that for almost every strain and assay format tested, normalisation significantly reduced inter-laboratory variation, supporting the continued development of antibody standards for seasonal influenza viruses. Normalisation had no impact on the correlation between overnight ELISA and 3-5 day MN formats.

Keywords: haemagglutination inhibition assay (HAI); influenza viruses; serology; standardisation; virus microneutralisation assay (MN).


Conflict of interest statement

LZ and CC are employed by Sanofi Pasteur. TO and DF are employees of the GSK group of companies. GP is employed by Seqirus. EM is Chief Scientific Officer of VisMederi srl and VisMederi Research srl. The remaining authors declare that the research was conducted in the absence of any commercial or financial relationships that could be construed as a potential conflict of interest.

Figures

Figure 1
Figure 1
Effect of antigen type on GMT for in-house and FLUCOP HAI testing for [1A] A viruses and [1B] B viruses. A shared human serum panel was tested in 10 laboratories with three antigenically similar viruses from each seasonal influenza subtype/lineage –egg propagated reassortant viruses (Egg Reas), egg isolated and propagated WT viruses (Egg WT) and cell isolated and propagated WT viruses (Cell WT). Viruses were tested by HAI using in-house testing (In-H) with in-house antigens or using a FLUCOP consensus protocol and common source viruses (FLUCOP). The difference is represented as the fold difference in GMT of in-house/FLUCOP testing. The red dashed line indicates a fold change of 1 i.e. where in-house and FLUCOP testing gave the same GMT. Fold differences higher than 1 indicate titres are higher using in-house testing, and fold differences of less than 1 indicate titres are lower using in-house testing. Overall GMTs across the serum panel for each condition and laboratory are shown in figure S1 .
Figure 2
Figure 2
Effect of harmonisation on interlaboratory variation. A shared serum panel was tested by 8 laboratories using egg propagated reassortant antigens (Egg Reas), egg isolated and propagated WT antigens (Egg WT) and cell isolated and propagated antigens (Cell WT) for each seasonal influenza A subtype and B lineage. Standard deviations (SD) are plotted for each sample, with median HAI/sample shaded by titre. P values (comparison of SDs when testing with the FLUCOP protocol and common source antigens (FLUCOP) or with in-house protocols and in-house antigens (In-H)) using paired T tests are shown at the top of each panel. Where fewer than 8 laboratories returned data the number of sets included in the analysis is indicated at the bottom of the panel.
Figure 3
Figure 3
Impact of normalisation on inter-laboratory variation in HAI titres. [3A] The SD was calculated across the serum panel tested. SD is shown for each influenza subtype/lineage tested as egg grown reassortant virus (red), egg grown WT virus (green) and cell grown WT virus (Blue). SD is shown before normalisation (Raw Data) and after normalisation with three pools of human sera acting as study standards: GhP1, GhP2 and Pool3b (see Table 3 for components of each pool). [3B] The differences in SD between normalised and raw data are plotted as differences between normalised and raw; values of less than 0 indicate lower SD for normalised titres than absolute titres.
Figure 4
Figure 4
Effect of antigen type, protocol type and normalisation on inter-laboratory variation. Reduction in per sample SD of the log2 titre for In-House versus FLUCOP for all available data from maximally 8 laboratories. Red = Raw Data, Brown = Ghent Pool1, Cyan = Ghent Pool2, Purple = Pool3b. H1N1 Cell WT 7 labs, H3N2 Egg WT 5 labs, BVic Egg WT 7 labs. The red dashed line represents 0 i.e where SD is the same for in-house and FLUCOP testing. Values greater than 0 indicate a higher SD for in-house testing than FLUCOP testing. Overall GMTs for each antigen type, condition and normaliser are shown in Figure S2 .
Figure 5
Figure 5
Between-run and within-run variation of two MN assay formats. [5A] FLUCOP 3-5 day format MN assay max-min ratios of GMTs between two independent runs (top, Inter-assay ratio) as a measure of inter-assay (or between-run) variability, and max-min ratios of two duplicate samples in run 1 (middle – Intra-assay (Run1)) and run 2 (bottom – Intra-assay (Run2)) as a measure of intra-assay (or within-run) variability. [5B] WHO ELISA MN assay max-min ratios of GMTs between two independent runs (top, Inter-assay ratio) as a measure of inter-assay (or between-run) variability, and max-min ratios of two duplicate samples in run 1 (middle) and run 2 (bottom) as a measure of intra-assay (or within-run) variability. Red dashed line represents the ratio cut-off of 3.5. Numbers at the top of each panel indicate the fraction of datapoints < 3.5.
Figure 6
Figure 6
GMTs and inter-laboratory variation for two different MN assay formats. [6A] GMTs of 34 samples tested using (left) the FLUCOP 3-5 day MN and (right) the WHO ELISA-based MN. [6B] SD of 34 samples tested using (left) the FLUCOP 3-5 day MN and (right) the WHO ELISA MN.
Figure 7
Figure 7
Impact of normalisation on inter-laboratory agreement for WHO ELISA and FLUCOP 3-5 day MN assays. [7A] WHO ELISA readout: Change in SD when normalisation is applied. [7B] FLUCOP 3-5 day MN: Change in SD when normalisation is applied. Points represent the mean of the per sample pairwise difference of Normalised – Raw with corresponding 95% CI. The red dashed line at 0 indicates no difference.
Figure 8
Figure 8
Correlation between serology assays. [8A] Correlation between WHO ELISA based (short form, or SF) and FLUCOP 3-5 day (long form or LF) MN assay titres. [8B] Correlation between WHO ELISA-based (short form or SF) MN and HAI assay titres.

References

    1. WHO . Influenza (Seasonal) (2018). Available at: https://www.who.int/news-room/fact-sheets/detail/influenza-(seasonal).
    1. Waldock J, Zheng L, Remarque EJ, Civet A, Hu B, Jalloh SL, et al. . Assay harmonization and use of biological standards to improve the reproducibility of the hemagglutination inhibition assay: A flucop collaborative study. mSphere (2021) 6(4):e0056721. doi: 10.1128/mSphere.00567-21 - DOI - PMC - PubMed
    1. Corti D, Voss J, Gamblin SJ, Codoni G, Macagno A, Jarrossay D, et al. . A neutralizing antibody selected from plasma cells that binds to group 1 and group 2 influenza a hemagglutinins. Sci (New York NY) (2011) 333(6044):850–6. doi: 10.1126/science.1205669 - DOI - PubMed
    1. Ekiert DC, Bhabha G, Elsliger MA, Friesen RH, Jongeneelen M, Throsby M, et al. . Antibody recognition of a highly conserved influenza virus epitope. Sci (New York NY) (2009) 324(5924):246–51. doi: 10.1126/science.1171491 - DOI - PMC - PubMed
    1. Lin Y, Gu Y, Wharton SA, Whittaker L, Gregory V, Li X, et al. . Optimisation of a micro-neutralisation assay and its application in antigenic characterisation of influenza viruses. Influenza other Respir Viruses (2015) 9(6):331–40. doi: 10.1111/irv.12333 - DOI - PMC - PubMed

Publication types