. 2023 Apr 18;5(3):fcad128.
doi: 10.1093/braincomms/fcad128. eCollection 2023.

Parasagittal dural space hypertrophy and amyloid-β deposition in Alzheimer's disease

Affiliations

Parasagittal dural space hypertrophy and amyloid-β deposition in Alzheimer's disease

Alexander K Song et al. Brain Commun. .

Abstract

One of the pathological hallmarks of Alzheimer's and related diseases is the increased accumulation of protein amyloid-β in the brain parenchyma. As such, recent studies have focused on characterizing protein and related clearance pathways involving perivascular flow of neurofluids, but human studies of these pathways are limited owing to limited methods for evaluating neurofluid circulation non-invasively in vivo. Here, we utilize non-invasive MRI methods to explore surrogate measures of CSF production, bulk flow and egress in the context of independent PET measures of amyloid-β accumulation in older adults. Participants (N = 23) were scanned at 3.0 T with 3D T2-weighted turbo spin echo, 2D perfusion-weighted pseudo-continuous arterial spin labelling and phase-contrast angiography to quantify parasagittal dural space volume, choroid plexus perfusion and net CSF flow through the aqueduct of Sylvius, respectively. All participants also underwent dynamic PET imaging with amyloid-β tracer 11C-Pittsburgh Compound B to quantify global cerebral amyloid-β accumulation. Spearman's correlation analyses revealed a significant relationship between global amyloid-β accumulation and parasagittal dural space volume (rho = 0.529, P = 0.010), specifically in the frontal (rho = 0.527, P = 0.010) and parietal (rho = 0.616, P = 0.002) subsegments. No relationships were observed between amyloid-β and choroid plexus perfusion nor net CSF flow. Findings suggest that parasagittal dural space hypertrophy, and its possible role in CSF-mediated clearance, may be closely related to global amyloid-β accumulation. These findings are discussed in the context of our growing understanding of the physiological mechanisms of amyloid-β aggregation and clearance via neurofluids.

Keywords: amyloid-β; cerebrospinal fluid; choroid plexus; glymphatics; parasagittal dural space.


Conflict of interest statement

The authors report no competing interests.

Figures

Graphical abstract
Graphical abstract
Figure 1
Figure 1
Components of neurofluid circulation. Orthogonal view of a 3D T2-weighted VISTA image highlighting the different components of neurofluid circulation including the (A) ChP in the axial slice, (B) aqueduct of Sylvius in the sagittal slice and (C) PSD space in the coronal slice.
Figure 2
Figure 2
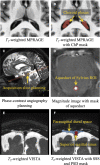
Overview of MR images and processing results. (A and B) Example axial view of a T1-weighted MPRAGE image and the resulting ChP (red) mask generated from the F-CNN for automatic segmentation of the ChP. (C and D) Example image of the phase-contrast acquisition planning on a sagittal view of T2-weighted VISTA image and an axial view of the magnitude image from acquisition to delineate the cerebral aqueduct (red) for use in the calculation of net CSF flow. (E and F) Coronal view of a T2-weighted VISTA image and the output mask (blue, PSD space; red, superior sagittal sinus) from the semi-supervised machine learning method using an F-CNN for automatic segmentation of the parasagittal space.
Figure 3
Figure 3
Measures of Aβ and neurofluid circulation in participants with higher and lower Aβ burden. Participant 1 is a 73-year-old male with the highest Aβ levels as determined by 11C-PIB binding (A; global BPND = 0.935). Corresponding axial slice of ChP (yellow arrows) cerebral blood flow (B; ChP perfusion = 26.41 ml/100 g/min) and coronal slice of PSD (blue) and superior sagittal sinus (SSS; red) segmentation (C; volume = 15.17 cm3) are displayed. Participant 2 is a 56-year-old female with the lowest Aβ levels as determined by 11C-PIB binding (D; global BPND = 0.005). Corresponding axial slice of the ChP (yellow arrows) cerebral blood flow (E; ChP perfusion = 30.79 ml/100 g/min) and coronal slice of PSD (blue) and SSS (red) segmentation (F; volume = 7.81 cm3) are displayed.
Figure 4
Figure 4
Comparison of static and dynamic analyses of 11C-PIB. (A) The scatterplot of SUVr50–70 and corresponding SRTM2 (BPND + 1) values derived from 11C-PIB PET imaging in 22 participants is displayed. Spearman’s rank-order correlation analysis demonstrates a significantly positive correlation (rho = 0.967, P < 0.001) between the two measures of Aβ accumulation. (B) The Bland–Altman plot of the average against the difference of SUVr50–70 and SRTM2 values reveals that SUVr50–70 values are consistently higher than corresponding SRTM2 BPND + 1 values. Orthogonal views of parametric 11C-PIB maps in an example participant are displayed for the (C) static SUVr50–70 and (D) dynamic SRTM2 analysis methods.
Figure 5
Figure 5
Scatterplots of global Aβ burden and measures of neurofluid circulation. (A) Axial view of ChP is shown in ChP is indicated to with yellow arrows. (B) Net CSF flow is calculated as the integral of the CSF flow time course shown. (C) The segmentation of the PSD is outlined in blue and the superior sagittal sinus in red. Corresponding scatterplots for global Aβ burden against (D) ChP perfusion, (E) net CSF flow and (F) PSD volume are also displayed. Spearman’s rank-order correlation analyses reveal no significant relationship between global Aβ burden and ChP perfusion (D; rho = 0.079, P = 0.748) or net CSF flow (E; rho = −0.105, P = 0.668). The relationship between global Aβ burden and PSD volume was found to be significant (F; rho = 0.529, P < 0.001).
Figure 6
Figure 6
Relationships between global Aβ burden and subsegmental PSD space volume. A 3D rendering of the PSD space and its subregions is depicted with associated scatterplots for the prefrontal (blue), frontal (magenta), parietal (green) and occipital (yellow) subregions of the PSD. Each scatterplot includes a best-fit line and 95% confidence intervals (shaded grey). Spearman’s rank-order correlation analyses revealed that increases in PSD volume of the frontal and parietal subregions of the PSD were significantly associated with increasing 11C-PIB BPND (rho = 0.527, P = 0.010; rho = 0.616, P = 0.002, respectively). These results survived multiple comparison correction.

References

    1. Jagust WJ, Landau SM; Alzheimer’s Disease Neuroimaging Initiative . Temporal dynamics of β-amyloid accumulation in aging and Alzheimer disease. Neurology. 2021;96(9):e1347–e1357. - PMC - PubMed
    1. Ikonomovic MD, Klunk WE, Abrahamson EE, et al. . Post-mortem correlates of in vivo PiB-PET amyloid imaging in a typical case of Alzheimer’s disease. Brain. 2008;131(6):1630–1645. - PMC - PubMed
    1. Mawuenyega KG, Sigurdson W, Ovod V, et al. . Decreased clearance of CNS β-amyloid in Alzheimer’s disease. Science. 2010;330(6012):1774–1774. - PMC - PubMed
    1. Klunk WE, Engler H, Nordberg A, et al. . Imaging brain amyloid in Alzheimer’s disease with Pittsburgh Compound-B. Ann Neurol. 2004;55(3):306–319. - PubMed
    1. Jack CR, Lowe VJ, Senjem ML, et al. . 11C PiB and structural MRI provide complementary information in imaging of Alzheimer’s disease and amnestic mild cognitive impairment. Brain. 2008;131(3):665–680. - PMC - PubMed

LinkOut - more resources