. 2023 Apr 25;2(5):pgad127.
doi: 10.1093/pnasnexus/pgad127. eCollection 2023 May.

Global age-structured spatial modeling for emerging infectious diseases like COVID-19

Affiliations

Global age-structured spatial modeling for emerging infectious diseases like COVID-19

Yixiong Xiao et al. PNAS Nexus. .

Abstract

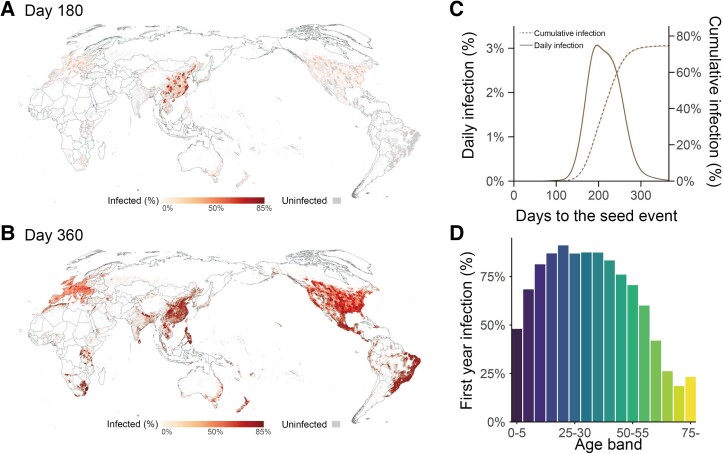
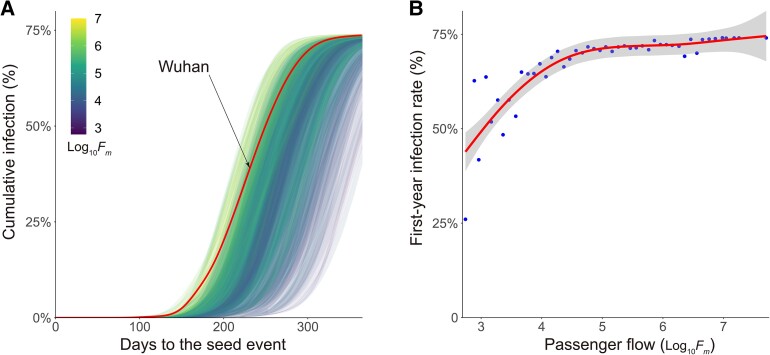
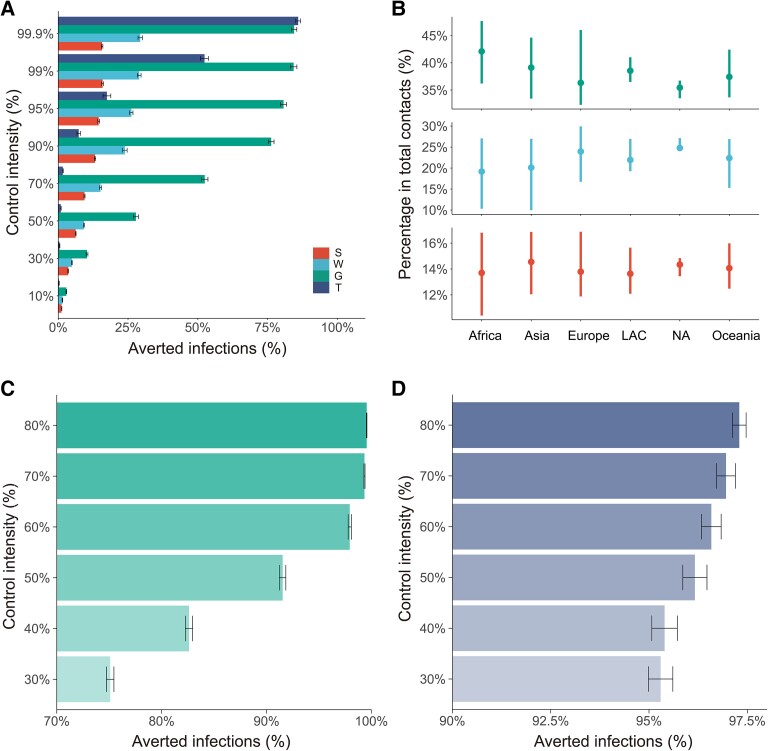
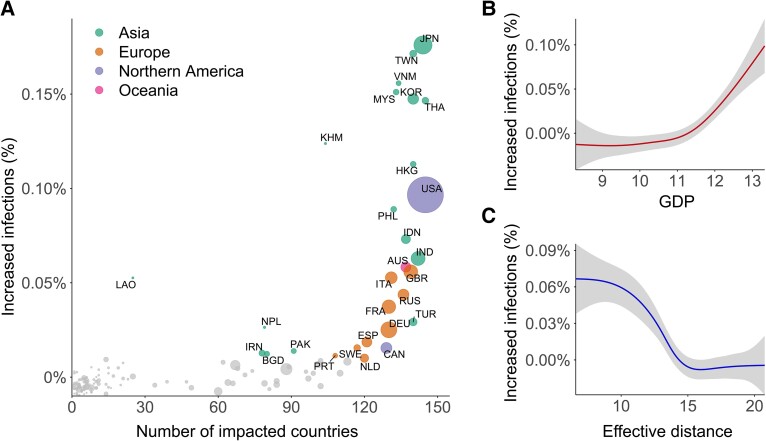
Modeling the global dynamics of emerging infectious diseases (EIDs) like COVID-19 can provide important guidance in the preparation and mitigation of pandemic threats. While age-structured transmission models are widely used to simulate the evolution of EIDs, most of these studies focus on the analysis of specific countries and fail to characterize the spatial spread of EIDs across the world. Here, we developed a global pandemic simulator that integrates age-structured disease transmission models across 3,157 cities and explored its usage under several scenarios. We found that without mitigations, EIDs like COVID-19 are highly likely to cause profound global impacts. For pandemics seeded in most cities, the impacts are equally severe by the end of the first year. The result highlights the urgent need for strengthening global infectious disease monitoring capacity to provide early warnings of future outbreaks. Additionally, we found that the global mitigation efforts could be easily hampered if developed countries or countries near the seed origin take no control. The result indicates that successful pandemic mitigations require collective efforts across countries. The role of developed countries is vitally important as their passive responses may significantly impact other countries.

Keywords: COVID-19; emerging infectious disease; global airline network.


Figures

Fig. 1.
Fig. 1.
Global pandemic dynamics of the baseline scenario. A, B) Snapshots of the global spread pattern of a single baseline simulation with R0=2.4. Global administrative units are represented by dots with different colors. C) Daily and cumulative infection curves in the baseline scenario. The solid line represents the daily infection curve; the dashed line represents the cumulative infection curve. D) Age-specific infection rate by the end of the first year in the baseline scenario.
Fig. 2.
Fig. 2.
A) The curves of pandemics randomly seeded in 300 cities across the world. Colors indicate the relative size of the seed city's total passenger flow (Log10Fm). B) The relationship between first-year infection rates and the passenger flow of the seed cities (Log10Fm). Line denotes the best estimate using GAMs. The gray area denotes the 95% CIs.
Fig. 3.
Fig. 3.
Global effects of NPIs. A) Averted first-year infections of each NPI with different control intensities. S, W, and G indicate the reduction of social contacts in schools, workplaces, and general communities, respectively; T indicates travel restrictions. B) Percentage of contacts in schools (red), workplaces (blue), and general communities (green) summarized in global regions. Dots indicate the mean value in each region; bars indicate the 95% CIs. LAC represents Latin America and the Caribbean region, and NA represents the Northern American region. C) Effects of combined NPIs with school closure (100% school contact reduction), 90% travel restrictions, and different intensities of contact reductions in workplaces and general communities. The y-axis denotes contact reductions in workplaces and general communities. D) Effects of combined NPIs with 70% contact reductions in school, workplace, and general communities and different intensities of travel restrictions. The y-axis denotes percentages of travel restrictions.
Fig. 4.
Fig. 4.
The impact of passive strategies. A) Scatterplot of the number of significantly impacted countries (x-axis) and increased infections in the rest of the countries (y-axis) in the first year if the NC country takes no control. Dot size indicates the relative size of each country's gross domestic product (GDP) in 2019. Dot color indicates countries in different geographic regions. Gray dots indicate that the global impacts of corresponding countries are not significant at 95% CIs. B) The relationship between increased infections and the GDP of NC country. C) The relationship between increased infections and the effective distance of the NC country to the seed origin. In B) and C), the gray area indicates 95% CIs.

References

    1. Flaxman S, et al. . 2020. Estimating the effects of non-pharmaceutical interventions on COVID-19 in Europe. Nature 584:257–261. - PubMed
    1. Prem K, et al. . 2020. The effect of control strategies to reduce social mixing on outcomes of the COVID-19 epidemic in Wuhan, China: a modelling study. Lancet Public Heal. 5:e261–e270. - PMC - PubMed
    1. Davies NG, et al. . 2020. Effects of non-pharmaceutical interventions on COVID-19 cases, deaths, and demand for hospital services in the UK: a modelling study. Lancet Public Heal. 5:e375–e385. - PMC - PubMed
    1. Mossong J, et al. . 2008. Social contacts and mixing patterns relevant to the spread of infectious diseases. PLoS Med. 5:e74. - PMC - PubMed
    1. Prem K, Cook AR, Jit M. 2017. Projecting social contact matrices in 152 countries using contact surveys and demographic data. PLoS Comput Biol. 13:e1005697. - PMC - PubMed