. 2023 Apr 18:11:1173794.
doi: 10.3389/fcell.2023.1173794. eCollection 2023.

Distinct human skeletal muscle-derived CD90 progenitor subsets for myo-fibro-adipogenic disease modeling and treatment in multiplexed conditions

Affiliations

Distinct human skeletal muscle-derived CD90 progenitor subsets for myo-fibro-adipogenic disease modeling and treatment in multiplexed conditions

Angela Li et al. Front Cell Dev Biol. .

Abstract

Chronic muscle injuries, such as massive rotator cuff tears, are associated with progressive muscle wasting, fibrotic scarring, and intramuscular fat accumulation. While progenitor cell subsets are usually studied in culture conditions that drive either myogenic, fibrogenic, or adipogenic differentiation, it is still unknown how combined myo-fibro-adipogenic signals, which are expected to occur in vivo, modulate progenitor differentiation. We therefore evaluated the differentiation potential of retrospectively generated subsets of primary human muscle mesenchymal progenitors in multiplexed conditions in the presence or absence of 423F drug, a modulator of gp130 signaling. We identified a novel CD90+CD56- non-adipogenic progenitor subset that maintained a lack of adipogenic potential in single and multiplexed myo-fibro-adipogenic culture conditions. CD90-CD56- demarcated fibro-adipogenic progenitors (FAP) and CD56+CD90+ progenitors were typified as myogenic. These human muscle subsets exhibited varying degrees of intrinsically regulated differentiation in single and mixed induction cultures. Modulation of gp130 signaling via 423F drug mediated muscle progenitor differentiation in a dose-, induction-, and cell subset-dependent manner and markedly decreased fibro-adipogenesis of CD90-CD56- FAP. Conversely, 423F promoted myogenesis of CD56+CD90+ myogenic subset, indicated by increased myotube diameter and number of nuclei per myotube. 423F treatment eliminated FAP-derived mature adipocytes from mixed adipocytes-FAP cultures but did not modify the growth of non-differentiated FAP in these cultures. Collectively, these data demonstrate that capability of myogenic, fibrogenic, or adipogenic differentiation is largely dependent on the intrinsic features of cultured subsets, and that the degree of lineage differentiation varies when signals are multiplexed. Moreover, our tests performed in primary human muscle cultures reveal and confirm the potential triple-therapeutic effects of 423F drug which simultaneously attenuates degenerative fibrosis, fat accumulation and promotes myo-regeneration.

Keywords: CD90; gp130 signaling; human muscle mesenchymal subsets; in vitro drug screening; myo-fibro-adipogenesis; skeletal muscle differentiation.


Conflict of interest statement

Author DE is a co-founder and significant shareholder of Carthronix Inc. The remaining authors declare that the research was conducted in the absence of any commercial or financial relationships that could be construed as a potential conflict of interest.

Figures

FIGURE 1
FIGURE 1
PDGFRβ+PDGFRα+CD90+ cells contribute to fibro-adipogenic lesion formation in diseased human muscle. (A–C) H&E staining of healthy (A) and diseased [(B), moderate and (C), severe] human muscle sections. Healthy myofibers (M) are replaced by adipose tissue (A) and fibrotic scars (F) that surround large blood vessels (BV) in muscle perimysium. Regenerating myofibers [(B), RM] are substituted by smaller and amorphous atrophied myofibers [(C), AM] with disease progression. (D–F) Picrosirius red staining for type I and type III collagen in healthy (D) early stage (E) and severe (F) disease stage. Small adipose tissue lesions are detected adjacent to collagenous blood vessels at early stage (E) and occupy larger areas close to fibrotic scars [(F), red] at severe stage. (G–P) Representative images of healthy (G–J) and diseased (K–P) human muscle sections, immunolabeled for detection of PDGFRβ, PDGFRα and CD90 as indicated. Blue nuclear staining for DAPI. In healthy muscles the indicated markers are expressed by perivascular of arteries and veins (G, I, J) and interstitial cells [(G, H), arrows]. PDGFRβ+PDGFRα+CD90+ cells occupy large fibrotic scars in interstitial spaces (K) and around large blood vessels (I) and form small lesions near arteries and veins in diseased muscles (M–P). Blood vessel luminal endothelial cells were identified by the expression of von Willebrand factor and are seen surrounded by PDGFRα+CD90+ perivascular and scar residing cells (M). Scale bars represent 100 μm.
FIGURE 2
FIGURE 2
Identification and isolation of primary cell subsets from human muscles. (A) Representative flow cytometry analyses of CD73, CD56 and CD90 expression by primary human muscle cells cultured in EGM-2 medium at passage 0 (n = 8 donors). (B) Representative flow cytometry analysis of expression of characteristic cell surface markers: CD90, PDGFR-β, and CD146 (perivascular cells); CD9 (adipogenic progenitors), CD15 (myoblasts) and CD34 (endothelial, hematopoietic progenitors and adventitial cells) by either expanded human muscle cell sorted subsets (CD90+ and CD90) or lineage restricted, perivascular-like cells (LRPC) that were derived from hES. Cells were analyzed between passages 1 and 5. (C) Representative images of cultured human muscle subsets and hES-LRPC. (D) Representative dot plots of tested conditions for human muscle myoblast enrichment and sorting strategy of myoblasts based on the expression of CD56 and CD90. Nearly all muscle cells were myoblasts when expanded in Matrigel coated dishes and EGM-2 medium at passage 0 (right panel). (E) Flow cytometry analysis of co-expression of perivascular markers, CD90, PDGFRβ and CD146 as well as the myoblast marker CD15 by sorted CD56+CD90+ human muscle-derived myoblasts between passages 1–3. (F) Frequency of CD56+, CD90+ and CD90 subsets, harvested from uncoated culture dishes (cell suspension and pre-plating) or Matrigel coated dishes between passages 0 and 1. Data are mean ± SD, n = at least 3 donors per cell subset. Data analyzed via one-way ANOVA. *p < 0.001 between frequency of cell subset that was cultured on Matrigel, and the matched cell subset in cell suspension and pre-plating culture conditions. Scale bar represents 100 μm.
FIGURE 3
FIGURE 3
423F elicits greater inhibition of human muscle FAP fibro-adipogenic differentiation than that of CD56, CD90, and LRPC in control and fibrogenic cultures. Picrosirius red spectrophotometric quantification of collagen production (A, D, G) and red pixel quantification of Oil red O-stained adipocytes (B, E, H) at the indicated conditions (UT = untreated, F = fibrogenic, A = adipogenic, M = myogenic) in the presence or absence of 1 uM and 10 µM 423F. Data (mean ± SEM) was pooled from multiple experiments with triplicates for all cultures (n = at least 3 per cell subset). Representative images of Oil Red O-stained adipogenic cells in control (C) and fibrogenic cultures (F) for each cell subset. Data was analyzed via paired one-way ANOVA for comparisons between the same cell subset and unpaired one-way ANOVA for comparisons between different cell subsets, followed by Tukey’s post hoc multiple comparisons. # denotes significance between FAP and all other subsets in the matched culture conditions. #p < 0.0001, ****p < 0.0001, ***p < 0.001, **p < 0.01, *p < 0.05. Scale bar represents 100 μm.
FIGURE 4
FIGURE 4
423F elicits greater inhibition of human muscle FAP fibro-adipogenic differentiation than that of CD56, CD90, and LRPC in adipogenic and myogenic cultures. (A–B) Myogenic differentiation is detected only in CD56 subset as seen in representative images of DAPI and Myosin heavy Chain I (MyHC I)-stained syncytial cells from CD56 in untreated culture (A) and myogenic serum-induced culture (B). Representative images of Oil Red O-stained adipogenic cells in adipogenic (C) and myogenic cultures (F) for each cell subset. Picrosirius red spectrophotometric quantification of collagen production (D, G) and red pixel quantification of Oil red O-stained adipocytes (E, H) at the indicated conditions in the presence or absence of 1 uM and 10 µM 423F. Data (mean ± SEM) was pooled from multiple experiments with triplicates for all cultures (n = at least 3 per cell subset). Data was analyzed via paired one-way ANOVA and Tukey’s post hoc multiple comparisons. ***p < 0.001, **p < 0.01, *p < 0.05. Scale bar represents 100 μm.
FIGURE 5
FIGURE 5
423F elicits greater inhibition of human muscle FAP fibro-adipogenic differentiation than that of CD56, CD90, and LRPC in adipo-fibrogenic and adipo-myogenic cultures. Picrosirius red spectrophotometric quantification of collagen production (A, D, G) and red pixel quantification of Oil red O-stained adipocytes (B, E, H) at the indicated conditions (AF = adipo-fibrogenic, AM = adipo-myogenic, FM = fibro-myogenic, AFM = adipo-fibro-myogenic) in the presence or absence of 1 and 10 µM 423F. Data (mean ± SEM) was pooled from multiple experiments with triplicates for all cultures (n = at least 3 per cell subset). Representative images of Oil Red O-stained adipogenic cells in adipo-fibrogenic (C) and adipo-myogenic (F) cultures for each cell subset. Data was analyzed via paired one-way ANOVA for comparisons between the same cell subset and unpaired one-way ANOVA for comparisons between different cell subsets, followed by Tukey’s post hoc multiple comparisons. # denotes significance between FAP and all other cell subsets in the AF condition, as well as significance between comparisons of all cell subsets in the AFM condition. & denotes significance between FAP and all other subsets in AM and FM conditions. #p < 0.0001, &p < 0.05, ****p < 0.0001, ***p < 0.001, **p < 0.01, *p < 0.05. Scale bar represents 100 μm.
FIGURE 6
FIGURE 6
423F elicits greater inhibition of human muscle FAP fibro-adipogenic differentiation than that of CD56, CD90 and LRPC in fibro-myogenic and adipo-fibro-myogenic cultures. Representative images of Oil Red O-stained adipogenic cells in fibro-myogenic (A) and adipo-fibro-myogenic cultures (B) for each cell subset. Picrosirius red spectrophotometric quantification of collagen production (B, E) and red pixel quantification of Oil red O-stained adipocytes (C, F) at the indicated conditions in the presence or absence of 1 and 10 µM 423F. Data (mean ± SEM) was pooled from multiple experiments with triplicates for all cultures (n = at least 3 per cell subset). Data was analyzed via paired one-way ANOVA and Tukey’s post hoc multiple comparisons, ***p < 0.001, **p < 0.01, *p < 0.05. (G) Color scale denotes the degree of subset differentiation. Scale bar represents 100 μm.
FIGURE 7
FIGURE 7
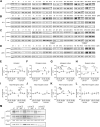
423F-mediated modulation of STAT3 expression and activity in cultures of human muscle cell subsets. (A–D) Representative images of western blot analyses of pSTAT3 and STAT3 from FAP (A), CD90 (B), CD56 (C), and LRPC (D) whole-cell lysates harvested after 24-h in the indicated culture conditions. (E–L) Levels of pSTAT3 were related to total-STAT3 levels for each cell subset at the indicated conditions. Data (mean ± SEM) was pooled from multiple experiments and presented as fold change (FC) between indicated conditions not treated with 423F and indicated conditions treated with 1 μM and 10 µM 423F (n = at least 3 per cell subset, except for LRPC that were derived from a single cell source). Data was analyzed via paired one-way ANOVA for comparisons between the same cell subset and unpaired one-way ANOVA for comparisons between different cell subsets, followed by Tukey’s post hoc multiple comparisons. ***p < 0.001, **p < 0.01, *p < 0.05. (M) Representative images of western blots of pSTAT3 and STAT3 of control, 423F, and 423F and anti-gp130-treated FAP in untreated (UT), fibrogenic (F), and adipogenic (A) cultures.
FIGURE 8
FIGURE 8
Different effects of 423F treatment on differentiated muscle progenitor derivatives. (A, B) Analysis of MyHC I+ myotube maturation based on myotube diameter and number of nuclei per myotube as seen in representative images of untreated and 423F treated cultures of CD56+CD90+ progenitors (A) and matched measurements (B). Graphs represent mean ± SEM. n = at least 3 donors. Data analyzed via one-way ANOVA. *p < 0.001 between 423F treated cultures and untreated control cultures, #p < 0.0000001 between 1 µM treated cultures and 10 µM treated cultures. (C, D) Survival of human muscle-derived mature adipocytes (Oil red O+DAPI+ cells) and FAP (gray DAPI+ cells) in mixed cultures in the absence or presence of increasing concentrations of 423F. Blue nuclear staining for DAPI and Oil red O staining for adipocytic lipid droplets (C). Percentage of red pixels (adipocytes) and gray pixels (FAP) out of total area of images of 423F treated cultures (D). Data was analyzed via paired one-way ANOVA for comparisons between 423F concentrations between the same cell and unpaired Student’s t test for comparisons between adipocytes and stromal cells, followed by Tukey’s post hoc multiple comparisons. ****p < 0.0001, ***p < 0.001, **p < 0.01, *p < 0.05. Scale bars represent 100 μm.

Similar articles

Cited by

References

    1. Antebi Y. E., Reich-Zeliger S., Hart Y., Mayo A., Eizenberg I., Rimer J., et al. (2013). Mapping differentiation under mixed culture conditions reveals a tunable continuum of T cell fates. PLoS Biol. 11, e1001616. 10.1371/journal.pbio.1001616 - DOI - PMC - PubMed
    1. Bogdanov J., Lan R., Chu T., Bolia I., Weber A., Petrigliano F. A. (2021). Fatty degeneration of the rotator cuff: Pathogenesis, clinical implications, and future treatment. JSES Rev. Rep. Tech. 1, 301–308. 10.1016/j.xrrt.2021.05.006 - DOI - PMC - PubMed
    1. Broer T., Khodabukus A., Bursac N. (2020). Can we mimic skeletal muscles for novel drug discovery? Expert Opin. Drug Discov. 15, 643–645. 10.1080/17460441.2020.1736031 - DOI - PMC - PubMed
    1. Camps J., Breuls N., Sifrim A., Giarratana N., Corvelyn M., Danti L., et al. (2020). Interstitial cell remodeling promotes aberrant adipogenesis in dystrophic muscles. Cell Rep. 31, 107597. 10.1016/j.celrep.2020.107597 - DOI - PubMed
    1. Caplan A. I. (1991). Mesenchymal stem cells. J. Orthop. Res. 9, 641–650. 10.1002/jor.1100090504 - DOI - PubMed