. 2023 Mar 28:17:1073516.
doi: 10.3389/fnins.2023.1073516. eCollection 2023.

Reduced acetylated α-tubulin in SPAST hereditary spastic paraplegia patient PBMCs

Affiliations

Reduced acetylated α-tubulin in SPAST hereditary spastic paraplegia patient PBMCs

Gautam Wali et al. Front Neurosci. .

Abstract

HSP-SPAST is the most common form of hereditary spastic paraplegia (HSP), a neurodegenerative disease causing lower limb spasticity. Previous studies using HSP-SPAST patient-derived induced pluripotent stem cell cortical neurons have shown that patient neurons have reduced levels of acetylated α-tubulin, a form of stabilized microtubules, leading to a chain of downstream effects eventuating in increased vulnerability to axonal degeneration. Noscapine treatment rescued these downstream effects by restoring the levels of acetylated α-tubulin in patient neurons. Here we show that HSP-SPAST patient non-neuronal cells, peripheral blood mononuclear cells (PBMCs), also have the disease-associated effect of reduced levels of acetylated α-tubulin. Evaluation of multiple PBMC subtypes showed that patient T cell lymphocytes had reduced levels of acetylated α-tubulin. T cells make up to 80% of all PBMCs and likely contributed to the effect of reduced acetylated α-tubulin levels seen in overall PBMCs. We further showed that mouse administered orally with increasing concentrations of noscapine exhibited a dose-dependent increase of noscapine levels and acetylated α-tubulin in the brain. A similar effect of noscapine treatment is anticipated in HSP-SPAST patients. To measure acetylated α-tubulin levels, we used a homogeneous time resolved fluorescence technology-based assay. This assay was sensitive to noscapine-induced changes in acetylated α-tubulin levels in multiple sample types. The assay is high throughput and uses nano-molar protein concentrations, making it an ideal assay for evaluation of noscapine-induced changes in acetylated α-tubulin levels. This study shows that HSP-SPAST patient PBMCs exhibit disease-associated effects. This finding can help expedite the drug discovery and testing process.

Keywords: biomarkers; hereditary spastic paraplegia; microtubule; neurodegenerative disease; noscapine.


Conflict of interest statement

The authors declare that the research was conducted in the absence of any commercial or financial relationships that could be construed as a potential conflict of interest.

Figures
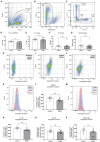
Figure 1
Figure 1
Acetylated α-tubulin levels in SPAST HSP patient and control PBMCs. Flow cytometry was used to measure acetylated α-tubulin in overall PBMCs and PBMC cell sub-types. (A) The forward-scatter and side-scatter (FSC/SSC) gated plots represent the total mononuclear cells. (B) Live PBMCs were identified using a cell viability dye. Viable cells have a relatively lower fluorescence level of the viability dye and vice versa for non-viable cells. Gating was applied to identify the proportion of viable cells. (C) CD2, CD19, and CD14 cell surface antibodies were used to identify PBMC cell sub-types T cells, B cells and monocytes. The scatter plot shows CD14 monocytes and CD19 B cells separated using the surface antibodies. The proportion of live PBMCs (D) and the proportion of T cells (E), B cells (F) and monocytes (G) is shown for all HSP-SPAST patients and healthy controls. (H–J) Levels of acetylated α-tubulin in PBMCs were measured in patient and control PBMC samples. Scatter plot of an acetylated α-tubulin negative control sample (H) and representative control (I) and patient (J) samples are shown. (K) Histogram plot showing acetylated α-tubulin levels in representative patient and control PBMC samples. (L) Patient and control group level comparison based on acetylated α-tubulin geometric mean fluorescence intensity in all PBMCs. (M) Histogram plot showing acetylated α-tubulin levels in representative patient and control T cells. Patient and control group level comparison of T cells (N), B cells (O) and monocytes (P) based acetylated α-tubulin geometric mean fluorescence intensity. Mean ± SEM.
Figure 2
Figure 2
Plasma and brain noscapine levels in noscapine treated mouse. Mouse was orally administered with increasing concentrations of noscapine: 100, 200, and 400 mg/kg. Noscapine was measured in mouse plasma (A) and brain homogenate (B) at 60 min post-dose using Liquid Chromatography Tandem Mass Spectrometry (LC-MS/MS). N = 4 mouse per group. One way ANOVA confirmed a significant noscapine treatment effect in the mouse plasma (p < 0.01) and brain (p < 0.01). Tukey’s post-hoc multiple comparisons showed group differences (*p < 0.05 and **p < 0.01). Mean ± SEM.
Figure 3
Figure 3
Acetylated α-tubulin levels in noscapine treated mouse. Acetylated α-tubulin was measured in the brain of the mouse dosed with noscapine. Mouse was orally administered with increasing concentrations of noscapine: 100, 200, and 400 mg/kg. One way ANOVA confirmed a significant noscapine treatment effect on acetylated α-tubulin in the mouse brain (p < 0.01). Tukey’s post-hoc multiple comparisons showed group differences (*p < 0.05, **p < 0.01, ***p < 0.001). N = 3 or 4 mouse per group. a.u. = arbitrary unit. Mean ± SEM.
Figure 4
Figure 4
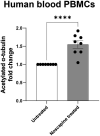
Acetylated α-tubulin levels in noscapine treated human PBMCs. Acetylated α-tubulin was measured in human PBMCs treated with noscapine (in vitro) at 10 μM for 1 h. Student’s t-test confirmed a significant noscapine treatment effect on acetylated α-tubulin levels (****p < 0.0001). N = 8 PBMC samples per untreated and noscapine treated groups. Mean ± SEM.

References

    1. Abrahamsen G., Fan Y., Matigian N., Wali G., Bellette B., Sutharsan R., et al. . (2013). A patient-derived stem cell model of hereditary spastic paraplegia with SPAST mutations. Dis. Model. Mech. 6, 489–502. doi: 10.1242/dmm.010884, PMID: - DOI - PMC - PubMed
    1. Aneja R., Dhiman N., Idnani J., Awasthi A., Arora S. K., Chandra R., et al. . (2007). Preclinical pharmacokinetics and bioavailability of noscapine, a tubulin-binding anticancer agent. Cancer Chemother. Pharmacol. 60, 831–839. doi: 10.1007/s00280-007-0430-y, PMID: - DOI - PubMed
    1. Benkert P., Meier S., Schaedelin S., Manouchehrinia A., Yaldizli Ö., Maceski A., et al. . (2022). Serum neurofilament light chain for individual prognostication of disease activity in people with multiple sclerosis: a retrospective modelling and validation study. Lancet Neurol 21, 246–257. doi: 10.1016/S1474-4422(22)00009-6, PMID: - DOI - PubMed
    1. Bonser L. R., Koh K. D., Johansson K., Choksi S. P., Cheng D., Liu L., et al. . (2021). Flow-Cytometric analysis and purification of airway epithelial-cell subsets. Am. J. Respir. Cell Mol. Biol. 64, 308–317. doi: 10.1165/rcmb.2020-0149MA, PMID: - DOI - PMC - PubMed
    1. Dahlström B., Mellstrand T., Löfdahl C. G., Johansson M. (1982). Pharmakokinetic properties of noscapine. Eur. J. Clin. Pharmacol. 22, 535–539. doi: 10.1007/BF00609627, PMID: - DOI - PubMed

LinkOut - more resources