. 2023 Jul 7;51(12):6389-6410.
doi: 10.1093/nar/gkad339.

Redefining normal breast cell populations using long noncoding RNAs

Affiliations

Redefining normal breast cell populations using long noncoding RNAs

Mainá Bitar et al. Nucleic Acids Res. .

Abstract

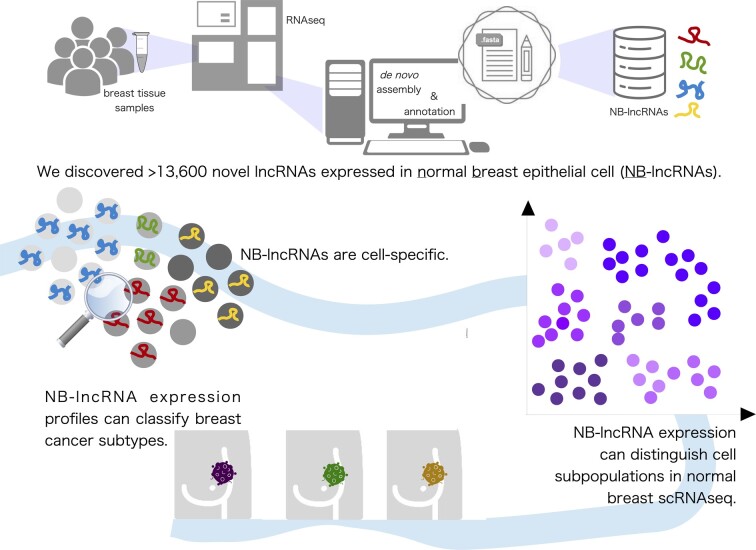
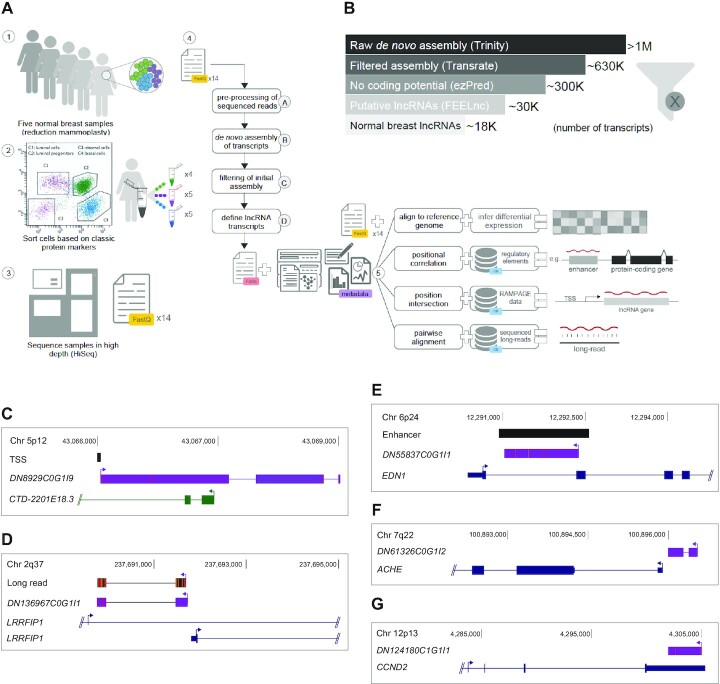
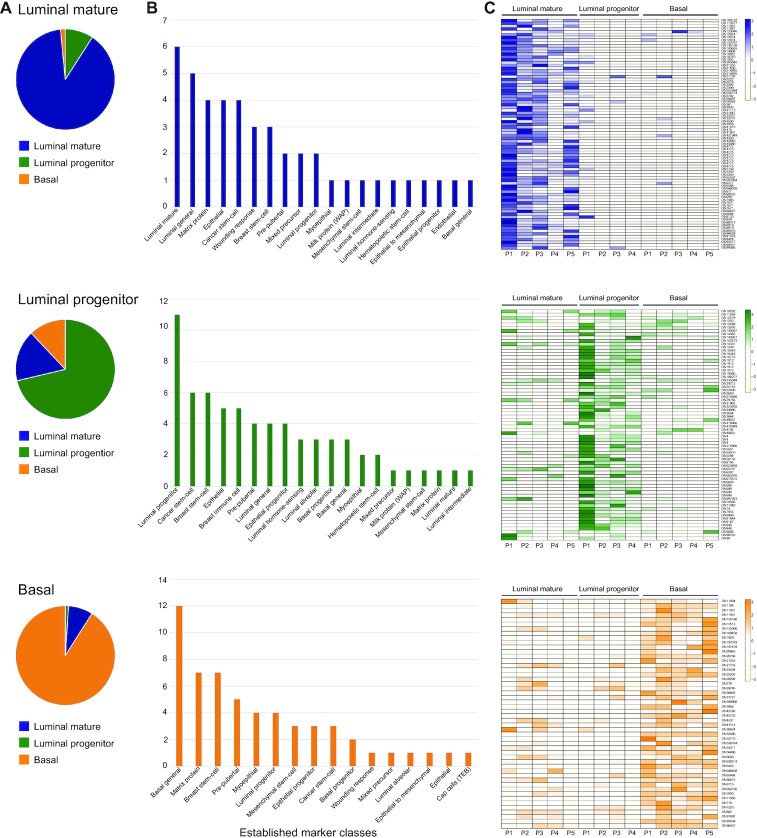
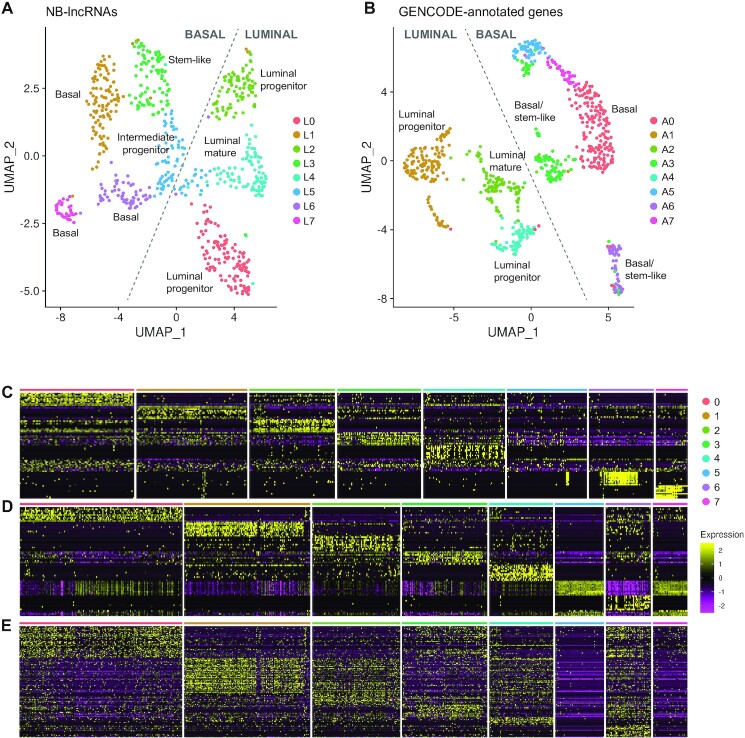
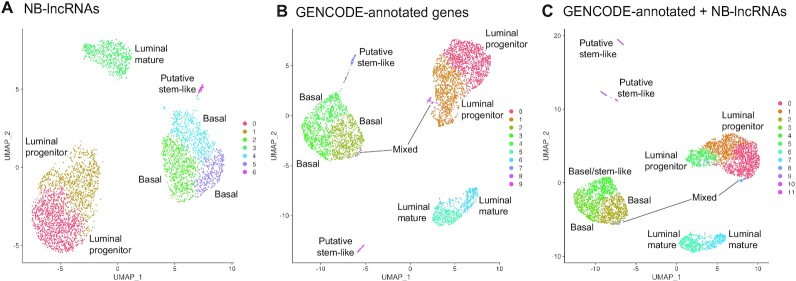
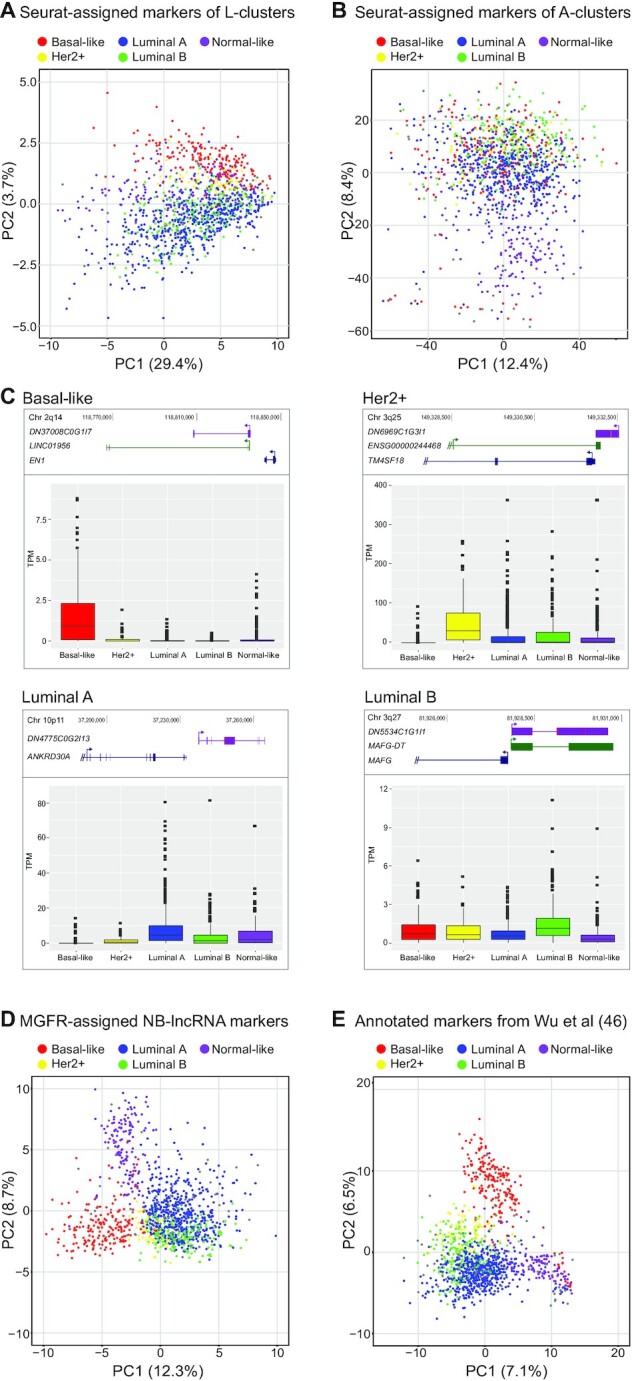
Single-cell RNAseq has allowed unprecedented insight into gene expression across different cell populations in normal tissue and disease states. However, almost all studies rely on annotated gene sets to capture gene expression levels and sequencing reads that do not align to known genes are discarded. Here, we discover thousands of long noncoding RNAs (lncRNAs) expressed in human mammary epithelial cells and analyze their expression in individual cells of the normal breast. We show that lncRNA expression alone can discriminate between luminal and basal cell types and define subpopulations of both compartments. Clustering cells based on lncRNA expression identified additional basal subpopulations, compared to clustering based on annotated gene expression, suggesting that lncRNAs can provide an additional layer of information to better distinguish breast cell subpopulations. In contrast, these breast-specific lncRNAs poorly distinguish brain cell populations, highlighting the need to annotate tissue-specific lncRNAs prior to expression analyses. We also identified a panel of 100 breast lncRNAs that could discern breast cancer subtypes better than protein-coding markers. Overall, our results suggest that lncRNAs are an unexplored resource for new biomarker and therapeutic target discovery in the normal breast and breast cancer subtypes.


Figures

Graphical Abstract
Graphical Abstract
We discovered >13,600 novel lncRNAs expressed in breast epithelial cells and showed that expression of the lncRNAs alone can distinguish normal breast cell populations. We developed a cluster specificity index and showed that lncRNA expression was more cluster-specific and could better define breast cell subpopulations.
Figure 1.
Figure 1.
Identification of NB-lncRNAs from human breast epithelium. (A) Schematic of the bulk RNAseq and de novo assembly experimental design. Strand-specific RNAseq libraries were prepared from total RNA extracted from FACS sorted breast epithelial cells. A multistep computational pipeline was designed for transcriptome assembly and compared with state-of-the-art tools, showing higher performance. Each main stem (A–D) is described in greater detail in Supplementary Figure S1a. (B) Number of assembled transcripts passing each filtering step, from raw transcriptome assembly to identification of NB-lncRNAs. (C–G) UCSC genome browser (hg38) diagram showing NB-lncRNAs (purple) and GENCODE-annotated protein-coding (blue) or noncoding genes (green). Rampage-detected transcription start sites (TSS) and enhancer elements are shown as black boxes.
Figure 2.
Figure 2.
Cell population-specific NB-lncRNAs target protein-coding markers of the same cell type. (A) FEELnc-assigned partners of NB-lncRNAs specifically expressed in each of the three main epithelial cell populations [i.e. luminal mature (top, blue), luminal progenitor (middle, green) and basal (bottom, orange)] were compared with previously reported markers of cell types, showing significant overrepresentation of the corresponding type. Enrichment was confirmed based on the p-value obtained for Fisher's exact tests. (B) Similar analyses were performed using an in-house dataset of known markers of several normal breast cell types, also showing a higher proportion of the population-specific NB-lncRNA partners are characteristic of the corresponding cell type. (C) Heatmaps of gene expression confirm the NB-lncRNAs as population-specific.
Figure 3.
Figure 3.
NB-lncRNAs and GENCODE-annotated genes can distinguish breast epithelial cell types. (A) Uniform manifold approximation projection (UMAP) of normal breast cells, clustered based on NB-lncRNAs expression, quantified on Fluidigm scRNAseq data (L-clusters). Cells are color-coded for clusters, which are numbered according to cell counts. (B) UMAP of normal breast cells, clustered based on GENCODE-annotated gene expression, quantified on Fluidigm scRNAseq data (A-clusters). (C) Heatmap showing the top ten Seurat-assigned markers for each L-cluster. (D) Heatmap showing the top ten Seurat-assigned markers for each A-cluster. (E) Heatmap showing Seurat-assigned markers for A-clusters previously reported in the literature.
Figure 4.
Figure 4.
Seurat-assigned markers identified candidate NB-lncRNA biomarkers. (A) Expression patterns of three identified NB-lncRNA luminal markers in L-clusters. (B) Expression patterns of three identified NB-lncRNA basal markers in L-clusters. (C, D) Upper panels: UCSC genome browser (hg38) diagrams showing NB-lncRNAs (purple), GENCODE-annotated protein-coding (blue) or noncoding genes (green). Lower panels: Expression patterns of NB-lncRNAs in L-clusters (left) and correlated protein-coding genes in A-clusters (right), showing examples of co-expression between coding and noncoding genes at single-cell level.
Figure 5.
Figure 5.
NB-lncRNAs have compartmentalized expression levels, which are higher at cell-level. (A) Proportion of NB-lncRNAs (purple) or GENCODE-annotated noncoding (green) or protein-coding (blue) genes with restricted (darker) versus widespread (lighter) expression patterns. (B) Boxplot of the number of cells in which NB-lncRNAs (purple) or GENCODE-annotated noncoding (green) or protein-coding (blue) genes are expressed, from the total 741 cells. On average, NB-lncRNAs are expressed in ∼15 cells, GENCODE-annotated noncoding genes in ∼30 cells and GENCODE-annotated protein-coding genes in ∼140 cells. (C) Boxplots of the median expression of NB-lncRNAs (purple) or GENCODE-annotated noncoding (green) or protein-coding (blue) genes per cell (in TPMs), showing NB-lncRNAs have higher cell-level expression. (D) UMAP showing normal breast cell clusters obtained based on NB-lncRNA gene expression (L-clusters), with their corresponding cluster specificity index (CSI). (E) UMAP showing normal breast cell clusters obtained based on GENCODE-annotated gene expression (A-clusters), with their corresponding CSI. (F) Dotplots showing the difference in CSI for corresponding clusters in ‘D and ‘E. Dots were colored according to the represented L-cluster or A-cluster, bold horizontal lines mark the average CSI for each gene set and the p-value (0.016; Fisher's exact test) shows the difference was significant. (G) Increase in normalized global SI levels, obtained as the normalized average of the CSIs of all clusters, as resolution is increased.
Figure 6.
Figure 6.
NB-lncRNAs cannot identify human brain cell types. (A) Global tissue-specificity of annotated protein-coding genes (top), annotated lncRNAs (middle) and NB-lncRNAs (bottom) across 27 human tissues. The tissue-specificity was summarized by calculating the tau index of every transcript in each set and counting the number of occurrences where each tissue had the highest tau overall. (B) UMAP of normal breast cells, clustered based on GENCODE-annotated gene expression, quantified on Fluidigm scRNAseq data. Cells are color-coded for clusters, which are numbered according to cell counts. (C) UMAP of normal breast cells, clustered based on NB-lncRNAs expression, quantified on Fluidigm scRNAseq data. Clusters were labeled based on the information provided in (35) and known protein-coding markers of the represented brain cell types.
Figure 7.
Figure 7.
NB-lncRNAs define a stem-like cell subpopulation in the normal breast epithelium. (A) Heatmap of the average expression of genes with experimentally confirmed stem-cell properties across the L-clusters. Genes were selected for their reported capacity of repopulating mammary fat pads, originating both basal and luminal compartments. Expression was measured at cell level and averaged across cells allocated to the same L-cluster. (B) The SCENT method was used to calculate the signaling entropy level (SR value) of each cell. Cells in the same L-cluster were plotted together, with the average for each cluster represented by dots. The dashed red line was placed at the highest average (cluster L3). (C) Monocle plots with cells distributed along a differentiation trajectory, with branch points representing cell lineages. Cells were colored either by Seurat-assigned L-clusters (upper) or by SR value (lower). (D) Slingshot trajectories showing the placement of lineages on top of the UMAP of L-clusters obtained with Seurat. Cluster L3 was defined as the root state, based on its higher stemness.
Figure 8.
Figure 8.
NB-lncRNAs discern normal breast cell subpopulations on 10x Genomics scRNAseq. (A) UMAP of normal breast cells, clustered based on NB-lncRNAs expression, quantified on 10x Genomics scRNAseq data. Cells are color-coded for clusters, which are numbered according to cell counts. (B) UMAP of normal breast cells, clustered based on GENCODE-annotated gene expression, quantified on 10x Genomics scRNAseq data. Cluster labels are based on the presence of known markers of cell subpopulations in the list of Seurat-assigned markers. (C) UMAP of normal breast cells, clustered based on the expression of GENCODE-annotated genes and NB-lncRNAs, quantified on 10x Genomics scRNAseq data.
Figure 9.
Figure 9.
NB-lncRNA expression can differentiate between breast cancer subtypes in TCGA. (A) The expression of Seurat-assigned NB-lncRNA markers of L-clusters separates the main subtypes of TCGA breast cancer tumors in a two-dimension PCA plot. (B) To a lesser degree, the expression of Seurat-assigned GENCODE-annotated markers of A-clusters separates different subtypes of TCGA breast cancer tumors in a two-dimension PCA plot. (C) NB-lncRNAs are markers of specific breast cancer subtypes. Four selected NB-lncRNAs are shown with their genomic context (upper; UCSC genome browser diagram) and expression levels (lower; boxplots of TPMs in TCGA samples of each subtype). (D) In-house NB-lncRNA markers of TCGA breast cancer subtypes can separate all subtypes of breast cancer in a two-dimensional PCA plot. (E) For comparison, known breast cancer protein-coding markers separate subtypes with comparable performance.

Similar articles

Cited by

References

    1. Fu N.Y., Nolan E., Lindeman G.J., Visvader J.E.. Stem cells and the differentiation hierarchy in mammary gland development. Physiol. Rev. 2020; 100:489–523. - PubMed
    1. Rios A.C., Fu N.Y., Lindeman G.J., Visvader J.E.. In situ identification of bipotent stem cells in the mammary gland. Nature. 2014; 506:322–327. - PubMed
    1. Lloyd-Lewis B., Harris O.B., Watson C.J., Davis F.M.. Mammary stem cells: premise, properties, and perspectives. Trends Cell Biol. 2017; 27:556–567. - PubMed
    1. Bach K., Pensa S., Grzelak M., Hadfield J., Adams D.J., Marioni J.C., Khaled W.T.. Differentiation dynamics of mammary epithelial cells revealed by single-cell RNA sequencing. Nat. Commun. 2017; 8:2128. - PMC - PubMed
    1. Bhat-Nakshatri P., Gao H., Sheng L., McGuire P.C., Xuei X., Wan J., Liu Y., Althouse S.K., Colter A., Sandusky G.et al. .. A single-cell atlas of the healthy breast tissues reveals clinically relevant clusters of breast epithelial cells. Cell Rep. Med. 2021; 2:100219. - PMC - PubMed

Publication types

Substances