. 2023 May 5:12:e85714.
doi: 10.7554/eLife.85714.

Osteoblast-intrinsic defect in glucose metabolism impairs bone formation in type II diabetic male mice

Affiliations

Osteoblast-intrinsic defect in glucose metabolism impairs bone formation in type II diabetic male mice

Fangfang Song et al. Elife. .

Abstract

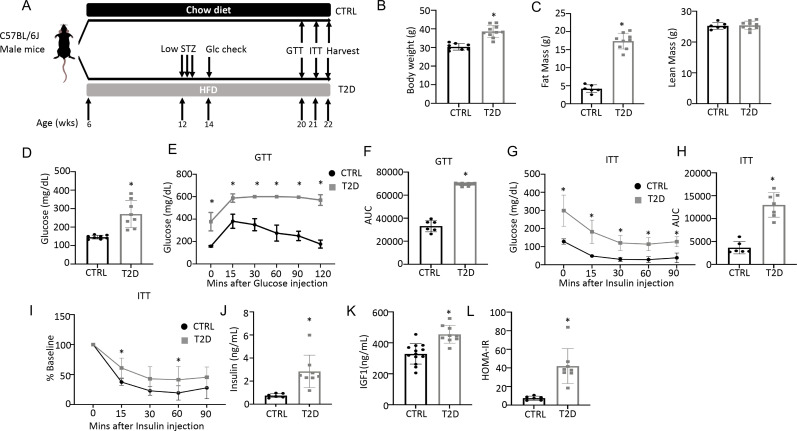
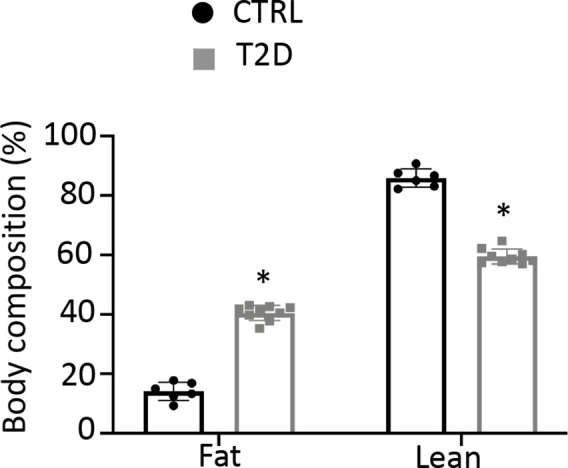
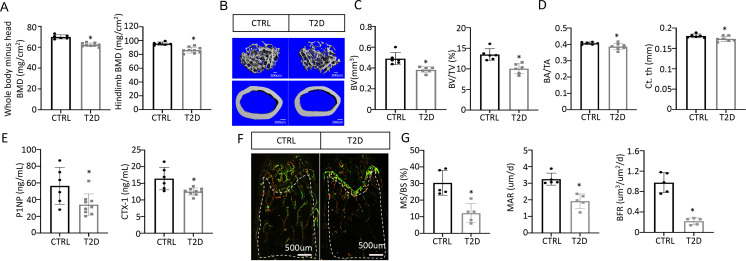
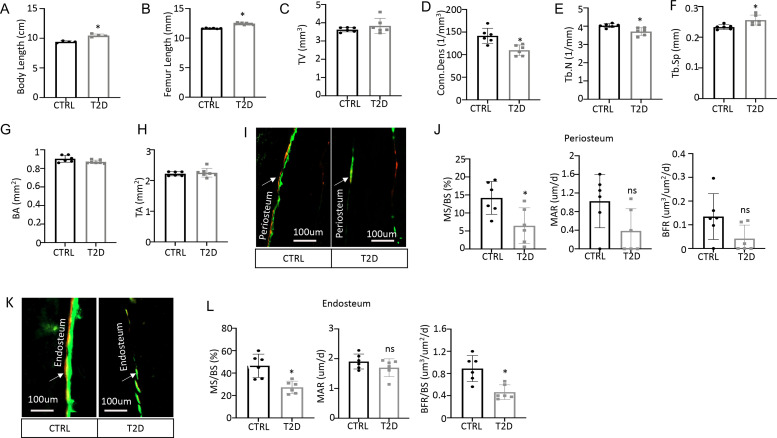
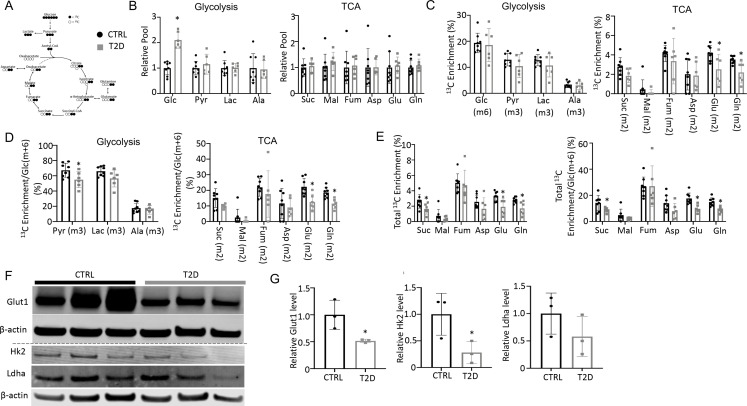
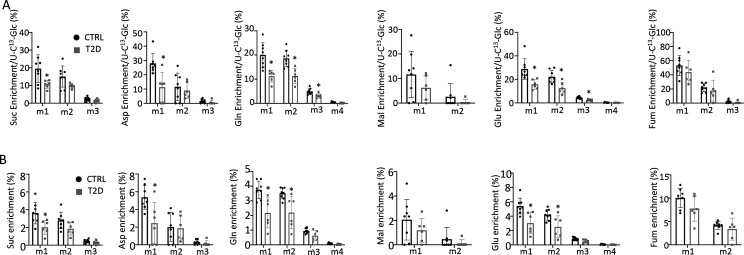
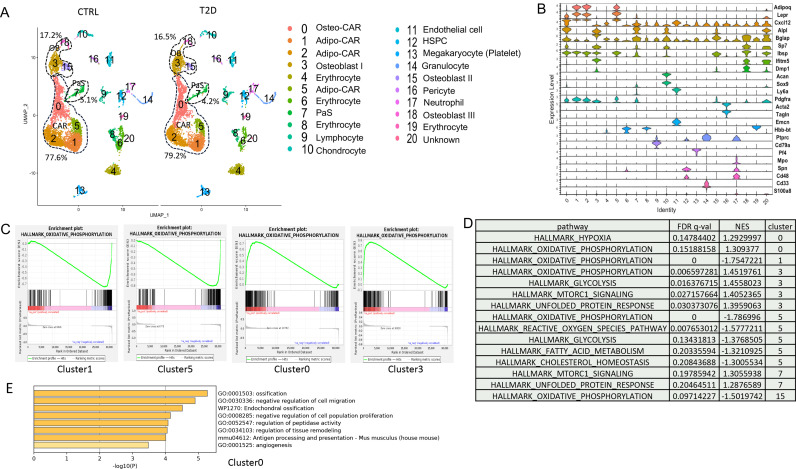
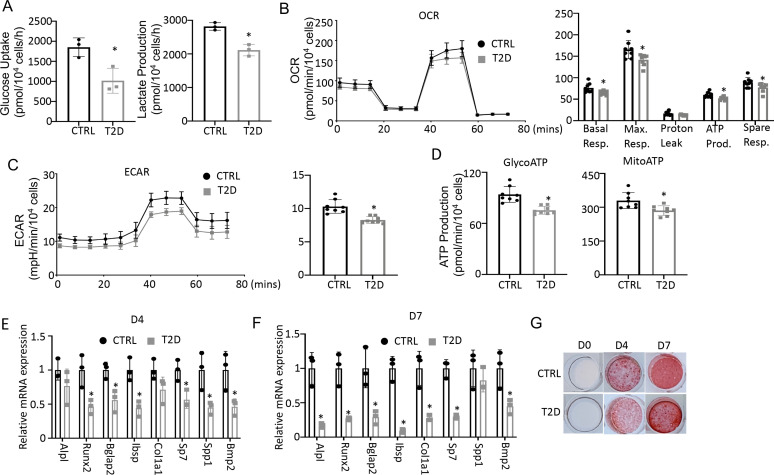
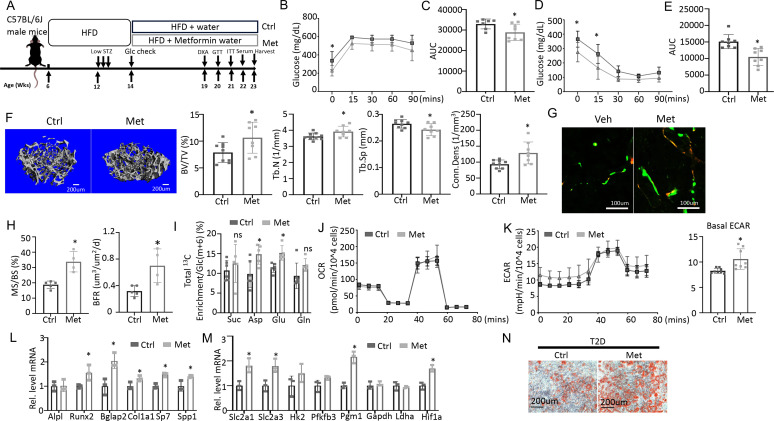
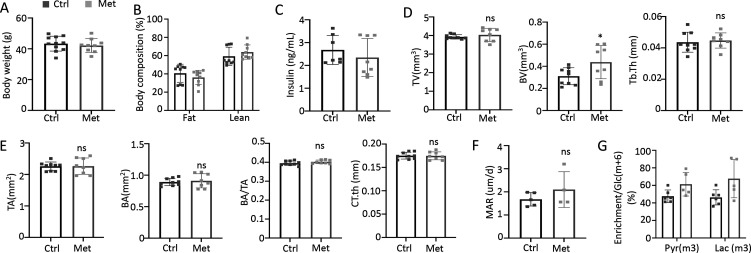
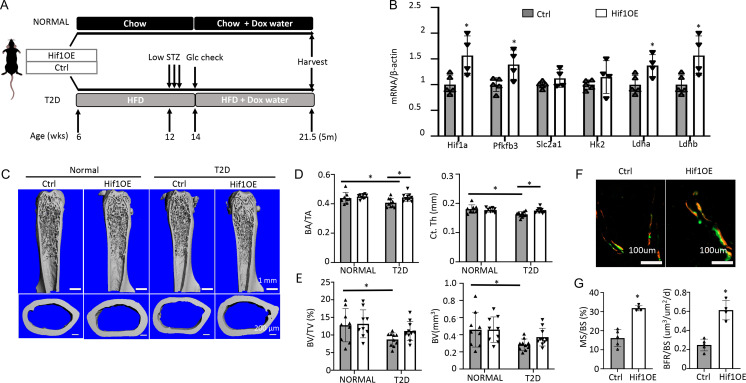
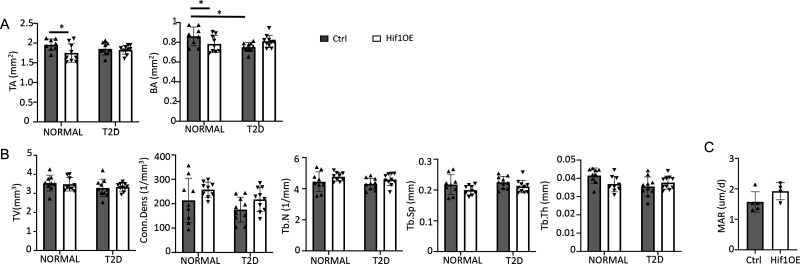
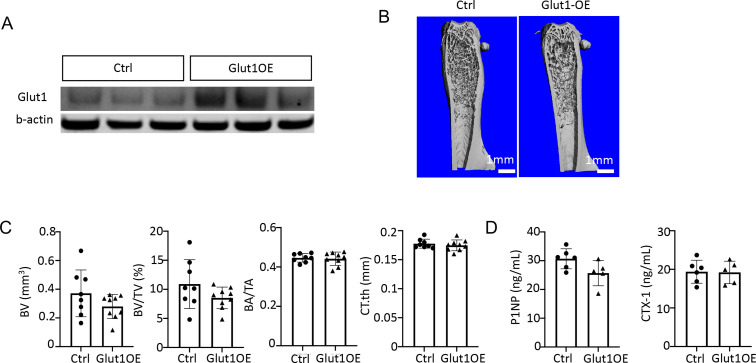
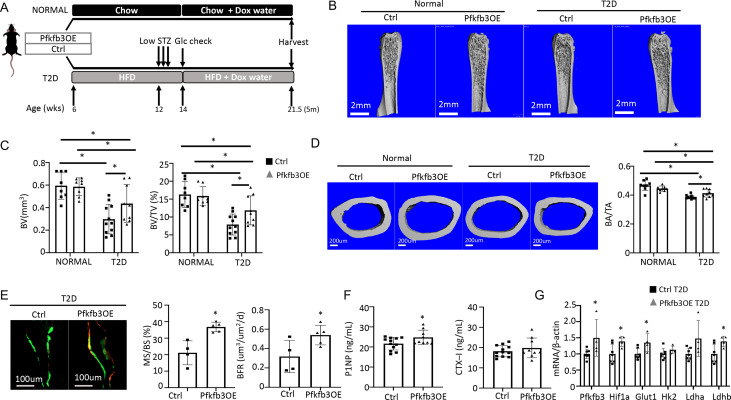
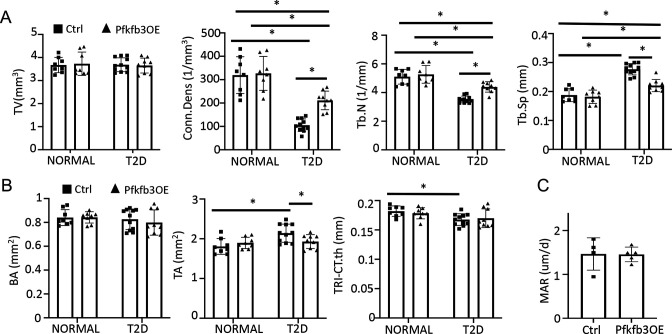
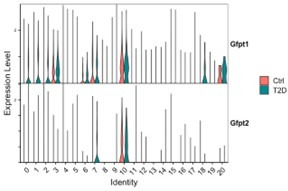
Skeletal fragility is associated with type 2 diabetes mellitus (T2D), but the underlying mechanism is not well understood. Here, in a mouse model for youth-onset T2D, we show that both trabecular and cortical bone mass is reduced due to diminished osteoblast activity. Stable isotope tracing in vivo with 13C-glucose demonstrates that both glycolysis and glucose fueling of the TCA cycle are impaired in diabetic bones. Similarly, Seahorse assays show suppression of both glycolysis and oxidative phosphorylation by diabetes in bone marrow mesenchymal cells as a whole, whereas single-cell RNA sequencing reveals distinct modes of metabolic dysregulation among the subpopulations. Metformin not only promotes glycolysis and osteoblast differentiation in vitro, but also improves bone mass in diabetic mice. Finally, osteoblast-specific overexpression of either Hif1a, a general inducer of glycolysis, or Pfkfb3 which stimulates a specific step in glycolysis, averts bone loss in T2D mice. The study identifies osteoblast-intrinsic defects in glucose metabolism as an underlying cause of diabetic osteopenia, which may be targeted therapeutically.

Keywords: bone; diabetic osteopenia; glucose metabolism; medicine; mouse; osteoblast; type II diabetes.


Conflict of interest statement

FS, WL, TM, XJ, CS, XL, RS, LY, HL, FL No competing interests declared

Figures

Figure 1.
Figure 1.. Combination of HFD and low-dose streptozotocin (STZ) induces Type 2 diabetes (T2D) in mice.
(A) A schematic for experimental design. Low-dose STZ: 30 mg/kg body weight. (B, C) Body weight (B, CTRL, n=8; T2D, n=10) and body composition by DXA (C, CTRL, n=6; T2D, n=9) at harvest. (D) Glucose levels after 6 hr fasting immediately before harvest. n=8. (E, F) Glucose tolerance test (GTT) curve (E) and area under curve (AUC) (F). CTRL, n=6; T2D, n=9. (G, H) Insulin tolerance test (ITT) glucose curve (G), AUC, (H) and percentage of baseline (I). CTRL, n=6; T2D, n=7. (J, K) Serum insulin (J, CTRL, n=6; T2D, n=8) and Igf1 (K, CTRL, n=9; T2D, n=13) levels. (L) HOMA-IR graphs. CTRL, n=6; T2D, n=8. All bar graphs are presented as mean ± SD. unpaired student’s t-test (B–D, F, H, J–L) or two-way ANOVA with Sidak’s multiple comparisons test (E, G, I). *p<0.05.
Figure 1—figure supplement 1.
Figure 1—figure supplement 1.. Type 2 diabetes (T2D) mice increase fat mass over lean mass.
Body composition was measured with DEXA. CTRL, n=6; T2D, n=9. *p<0.05, Student’s t-test.
Figure 2.
Figure 2.. Type 2 diabetes (T2D) causes low turnover osteopenia.
(A) Bone mineral density (BMD) for the whole body (minus head) and one leg (femur and tibia). CTRL, n=6; T2D, n=9. (B) Representative µCT images. (C) Quantitative analysis of trabecular bone of the distal femur. n=6. (D) Quantitative analysis of cortical bone in femur. CTRL, n=6; T2D, n=7. (E) Serum bone formation (P1NP) and resorption (CTX-1) markers. CTRL, n=6; T2D, n=9. (F, G) Representative images (F) and quantification (G) for double labeling of trabecular bone in the distal femur. n=5. Data are mean ± SD. Unpaired Student’s t-tests. *p<0.05.
Figure 2—figure supplement 1.
Figure 2—figure supplement 1.. Diabetic osteopenia in Type 2 diabetes (T2D) mouse model.
(A) Body length (cm) from nose tip to the anus. n=4. (B) Femur length measured by DEXA. CTRL, n=6; T2D, n=9. (C–F) Trabecular bone parameters by µCT. n=6. (G, H) Cortical bone parameters by µCT. CTRL, n=6; T2D, n=7. (I, J) Double labeling analysis of periosteum. n=6. (K, L) Double labeling analysis of endosteum. n=6. Data are represented as mean ± SD. *p<0.05, Student’s t-test.
Figure 3.
Figure 3.. Type 2 diabetes (T2D) suppresses glucose metabolism in bone.
(A) A diagram for carbon tracing with 1313C6-Glc. (B) Relative pool size of glycolytic and TCA metabolites. CTRL, n=8; T2D, n=6. (C) Enrichment of specific isotopologues of metabolites relative to own pool. CTRL, n=8; T2D, n=6. (D) Relative enrichment of specific isotopologues normalized to Glc(m+6). CTRL, n=8; T2D, n=6. (E) Carbon enrichment of metabolites relative to own pool (left) and normalized to Glc(m+6) (right). CTRL, n=8; T2D, n=6. (F, G) Western blot images (F) and quantifications (G). n=3. Data presented as mean ± SD. *p<0.05, Two-tailed unpaired t-test.
Figure 3—figure supplement 1.
Figure 3—figure supplement 1.. Glucose tracing in plasma.
(A, B) Relative levels of glycolysis (A) and TCA (B) metabolites in the plasma. CTRL, n=8; T2D, n=6. Data are represented as mean ± SD. *p<0.05, Student’s t-test.
Figure 3—figure supplement 2.
Figure 3—figure supplement 2.. Glucose tracing in bone.
(A) Relative enrichment of specific isotopomers normalized to 1313C6-Glc in bone. (B) Enrichment of specific isotopomers in bone. CTRL, n=8; T2D, n=6. Data are represented as mean ± SD. *p<0.05, Student’s t-test.
Figure 4.
Figure 4.. Single-cell RNA-sequencing (scRNA-seq) detects metabolic dysregulation in bone marrow mesenchymal cells of Type 2 diabetes (T2D) mice.
(A) UMAP clusters with annotations to the right. Percentages denote the relative abundance of osteoblast (OB), CAR, and PaS cells among mesenchymal cells. (B) Violin plots of the example feature genes for each cluster. (C) Gene set enrichment analysis (GSEA) of T2D over CTRL for OXPHOS pathway in clusters as indicated. (D) GSEA of T2D over CTRL for metabolic pathways in clusters as indicated. (E) Top pathways identified among T2D downregulated genes in cluster 0 with Metascape.
Figure 5.
Figure 5.. Type 2 diabetes (T2D) impairs glucose metabolism and osteogenic differentiation in bone marrow stromal cells (BMSC).
(A) Glucose uptake and lactate production rates. n=3. (B, C) Seahorse measurements of oxygen consumption rate (OCR) (B) and extracellular acidification rate (ECAR) (C). n=8. (D) Projected ATP production glycolysis (glycoATP) and mitochondria (mitoATP) based on Seahorse. n=8. (E, F) qPCR for osteoblast markers at day 4 (E) and day 7 (F) of differentiation. n=3. (G) Alizarin red staining. Data presented as mean ± SD. *p<0.05, Unpaired student’s t-test.
Figure 5—figure supplement 1.
Figure 5—figure supplement 1.. Bone marrow stromal cells (BMSC) purification with MACS beads.
(A) Bright field of BMSC with or without depletion of CD45 + cells. (B) FACS analysis of CD45+ cell percentage for BMSC with or without depletion after one or two passages.
Figure 5—figure supplement 2.
Figure 5—figure supplement 2.. In vitro osteoblast differentiation of MACS-purified bone marrow stromal cells (BMSC) from wild-type mice.
(A) Alizarin red staining with differentiation at day 0, day 4, and day 7. (B) qPCR of osteoblast marker genes. n=3. Data are represented as mean ± SD. *p<0.05, one-way ANOVA.
Figure 6.
Figure 6.. Metformin improves bone mass and glucose metabolism impaired by Type 2 diabetes (T2D).
(A) A schematic for metformin regimen. T2D animals were randomly divided into Control (Ctrl) and metformin (Met) groups. (B, C) Glucose tolerance test (GTT) curve (B) and area under curve (C). Ctrl, n=7; Met, n=8. (D, E) ITT curve (D) and area under curve (E). n=8. (F) Representative µCT images and quantification of trabecular bone in the distal femur. Ctrl, n=9; Met, n=8. (G, H) Representative images (G) and quantification (H) of double labeling in trabecular bone of the distal femur. Ctrl, n=5; Met, n=4. (I) Carbon enrichment of TCA metabolites normalized to Glc(m+6). Ctrl, n=6; Met, n=5. (J, K) Seahorse measurements of oxygen consumption rate (OCR) (J) and extracellular acidification rate (ECAR) (K) with or without 1 mM metformin treatment for 24 hr. n=8. (L, M) qPCR analyses of osteoblast markers (L) and glycolysis-related genes (M) in bone marrow stromal cells (BMSC) at day 7 of differentiation with or without 1 mM metformin treatment. n=3. (N) Alizarin red staining at day 7 of osteoblast differentiation. Data are presented as mean ± SD. *p<0.05, two-way ANOVA followed by Sidak’s multiple comparisons (B, D) or Student’s t-test (all others).
Figure 6—figure supplement 1.
Figure 6—figure supplement 1.. Metformin improves bone mass in Type 2 diabetes (T2D) mice.
(A) Body weight. Ctrl, n=11; Met, n=9. (B) Body composition. n=9. (C) Serum insulin level. Ctrl, n=7; Met, n=8. (D) Trabecular bone parameters of femurs by µCT. Ctrl, n=9; Met, n=8. (E) Cortical bone parameters of femur midshaft. Ctrl, n=9; Met, n=8. (F) Mineral apposition rate by double labeling method. Ctrl, n=5; Met, n=4. (G) Relative enrichment of specific isotopomers normalized to Glc(m+6). Ctrl, n=6; Met, n=5. Data are represented as mean ± SD. *p<0.05 by Student’s t-test.
Figure 7.
Figure 7.. Targeted overexpression of Hif1a in osteoblasts rescues low bone mass in Type 2 diabetes (T2D) mice.
(A) A schematic for Hif1a overexpression (Hif1OE) in normal or T2D conditions. (B) qPCR analyses of glycolysis-related genes in bones of diabetic mice with or without Hif1a overexpression. n=4. (C–E) Representative µCT images (C) and quantification of cortical bone (D) and distal trabecular bone (E) of the femur. n=10. (F, G) Representative images (F) and quantification (G) of double labeling in trabecular bone of proximal tibia in diabetic mice. Ctrl, n=5, Hif1OE, n=4. Data presented as mean ± SD. *p<0.05 Unpaired Student’s t-test (B, G) or two-way ANOVA followed by Fisher’s LSD test (D, E).
Figure 7—figure supplement 1.
Figure 7—figure supplement 1.. Hif1a overexpression improves bone mass in Type 2 diabetes (T2D) mice.
(A, B) Cortical (A) and trabecular (B) bone parameters by µCT. (C) Mineral apposition rate (MAR) from double labeling in the T2D group. Ctrl, n=5; Hif1OE; n=4. Data are represented as mean ± SD. *p<0.05, two-way ANOVA followed by Fisher’s LSD test (A, B) or Student’s t-test (C).
Figure 7—figure supplement 2.
Figure 7—figure supplement 2.. Glut1 overexpression does not improve bone in Type 2 diabetes (T2D) mice.
(A) Glut1 overexpression in the bone shaft by Western blot. (B) Representative µCT images. (C) Quantification by µCT. Ctrl, n=8; Glut1OE; n=9. (D) Serum P1NP and CTX-1 levels. Ctrl, n=6; Glut1OE; n=5. Data are represented as mean ± SD. *p<0.05 by Student’s t-test.
Figure 8.
Figure 8.. Osteoblast-directed Pfkfb3 overexpression corrects bone loss in Type 2 diabetes (T2D).
(A) A schematic for experimental design. Representative µCT images (B) and quantification (C) of trabecular bone in the distal femur. (D) Representative µCT images and quantification of cortical bone in femur. Ctrl NORMAL, n = 8; Pfkfb3OE NORMAL, n = 8; Ctrl T2D, n = 11; Pfkfb3OE T2D, n = 9. (E) Representative images and quantification of double labeling in trabecular bone of the proximal tibia. Ctrl T2D, n = 4; Pfkfb3OE T2D, n = 5. (F) Serum markers for bone formation (P1NP) and resorption (CTX-1). Ctrl T2D, n = 12; Pfkfb3OE T2D, n = 9. (G) qPCR analyses of glycolysis-related genes in bone. Ctrl T2D, n = 7; Pfkfb3OE T2D n = 4. Data presented as mean ± SD. *p<0.05, Two-way ANOVA followed by Fisher’s LSD test (C, D) or Student’s t-test (all others).
Figure 8—figure supplement 1.
Figure 8—figure supplement 1.. Pfkfb3 overexpression improves bone mass in Type 2 diabetes (T2D mice).
(A, B) Trabecular (A) and cortical (B) bone parameters of Pfkfb3OE versus Ctrl mice in T2D or NORMAL groups. Ctrl NORMAL, n = 8; Pfkfb3OE NORMAL, n = 8; Ctrl T2D, n = 11; Pfkfb3OE T2D, n = 9. (C) Quantification of mineral apposition rate (MAR) by double labeling in T2D mice with or without Pfkfb3OE. Ctrl T2D, n = 4; Pfkfb3OE T2D, n = 5. Data are represented as mean ± SD. *p<0.05, two-way ANOVA followed by Fisher’s LSD test (A, B) or by Student’s t-test (C).
Author response image 1.
Author response image 1.. scRNA-seq detects increased expression of Gfpt1 in multiple mesenchymal cell clusters in the bone marrow of T2D mice compared to control.
Violin plots show relative gene expression levels in each cell cluster (x-axis) in control (red) versus T2D (green) mice.

Update of

References

    1. Baccin C, Al-Sabah J, Velten L, Helbling PM, Grünschläger F, Hernández-Malmierca P, Nombela-Arrieta C, Steinmetz LM, Trumpp A, Haas S. Combined single-cell and spatial transcriptomics reveal the molecular, cellular and spatial bone marrow niche organization. Nature Cell Biology. 2020;22:38–48. doi: 10.1038/s41556-019-0439-6. - DOI - PMC - PubMed
    1. Baryawno N, Przybylski D, Kowalczyk MS, Kfoury Y, Severe N, Gustafsson K, Kokkaliaris KD, Mercier F, Tabaka M, Hofree M, Dionne D, Papazian A, Lee D, Ashenberg O, Subramanian A, Vaishnav ED, Rozenblatt-Rosen O, Regev A, Scadden DT. A cellular taxonomy of the bone marrow stroma in homeostasis and leukemia. Cell. 2019;177:1915–1932. doi: 10.1016/j.cell.2019.04.040. - DOI - PMC - PubMed
    1. Bonds DE, Larson JC, Schwartz AV, Strotmeyer ES, Robbins J, Rodriguez BL, Johnson KC, Margolis KL. Risk of fracture in women with type 2 diabetes: the women’s health Initiative observational study. The Journal of Clinical Endocrinology and Metabolism. 2006;91:3404–3410. doi: 10.1210/jc.2006-0614. - DOI - PubMed
    1. Brownlee M. Biochemistry and molecular cell biology of diabetic complications. Nature. 2001;414:813–820. doi: 10.1038/414813a. - DOI - PubMed
    1. Buttgereit F, Brand MD. A hierarchy of ATP-consuming processes in mammalian cells. The Biochemical Journal. 1995;312 (Pt 1):163–167. doi: 10.1042/bj3120163. - DOI - PMC - PubMed

Publication types