. 2023 Aug 7;220(8):e20221166.
doi: 10.1084/jem.20221166. Epub 2023 May 5.

OX40L-expressing recombinant modified vaccinia virus Ankara induces potent antitumor immunity via reprogramming Tregs

Affiliations

OX40L-expressing recombinant modified vaccinia virus Ankara induces potent antitumor immunity via reprogramming Tregs

Ning Yang et al. J Exp Med. .

Abstract

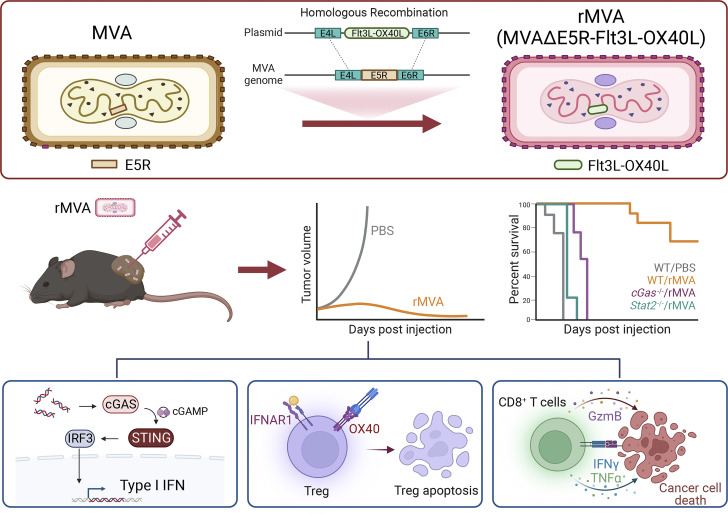
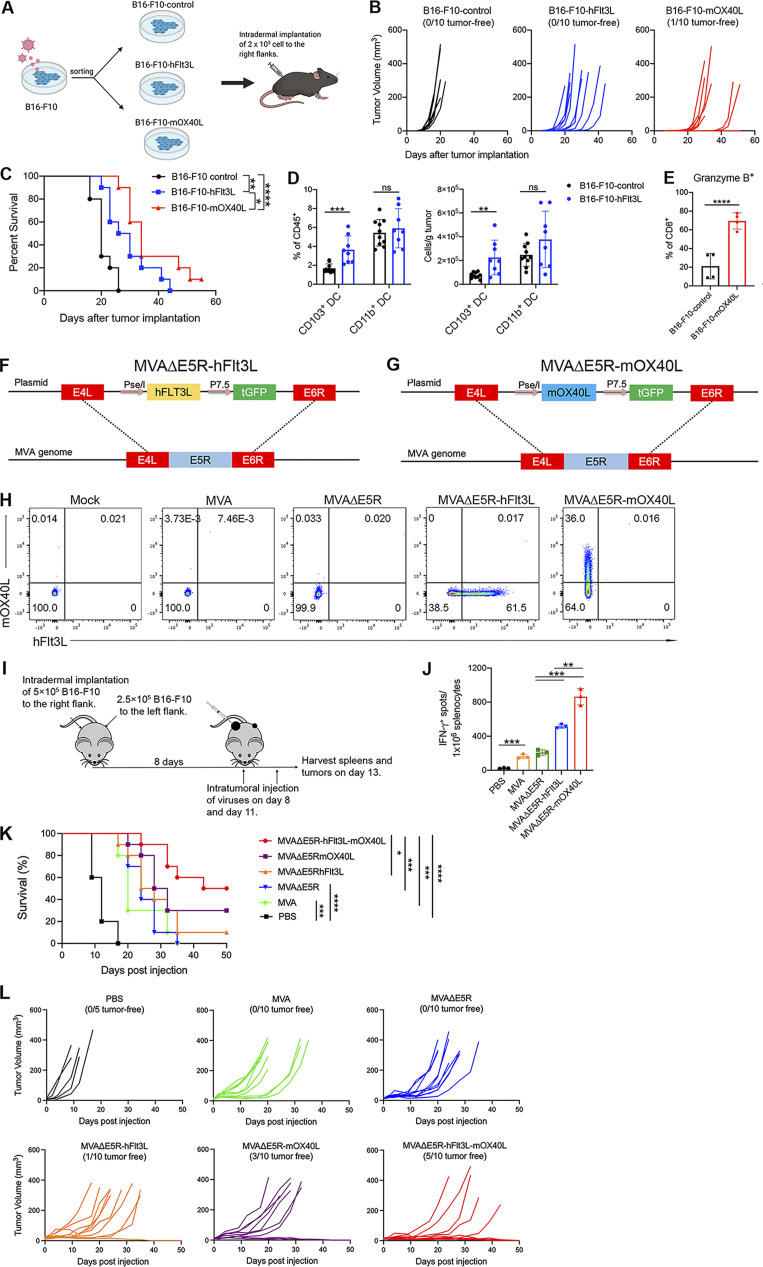
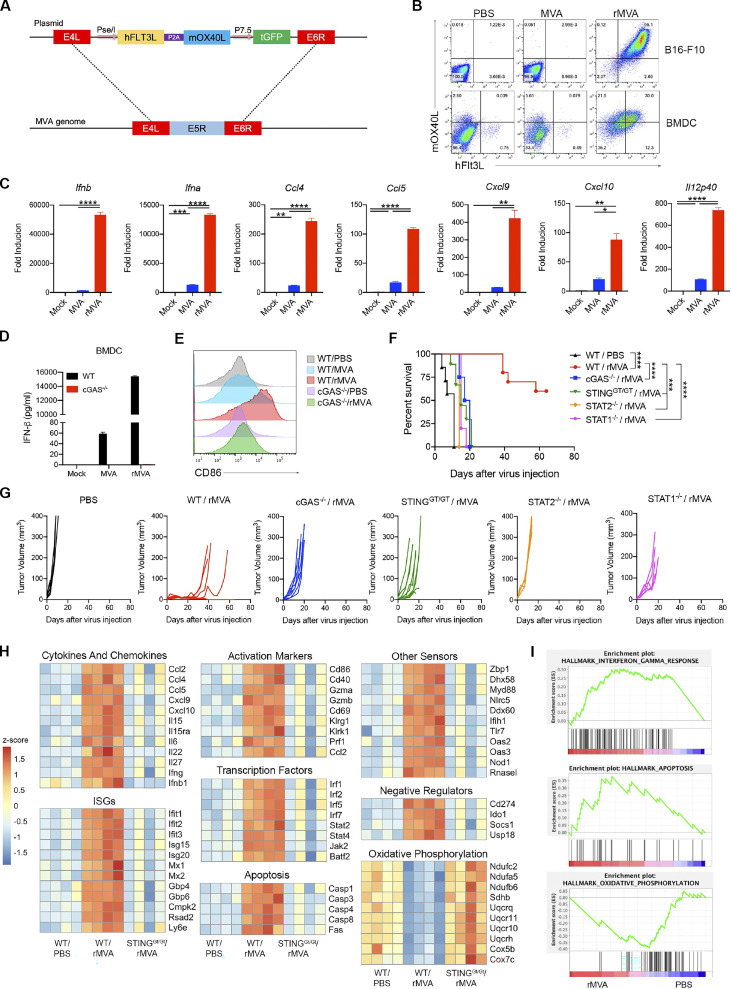
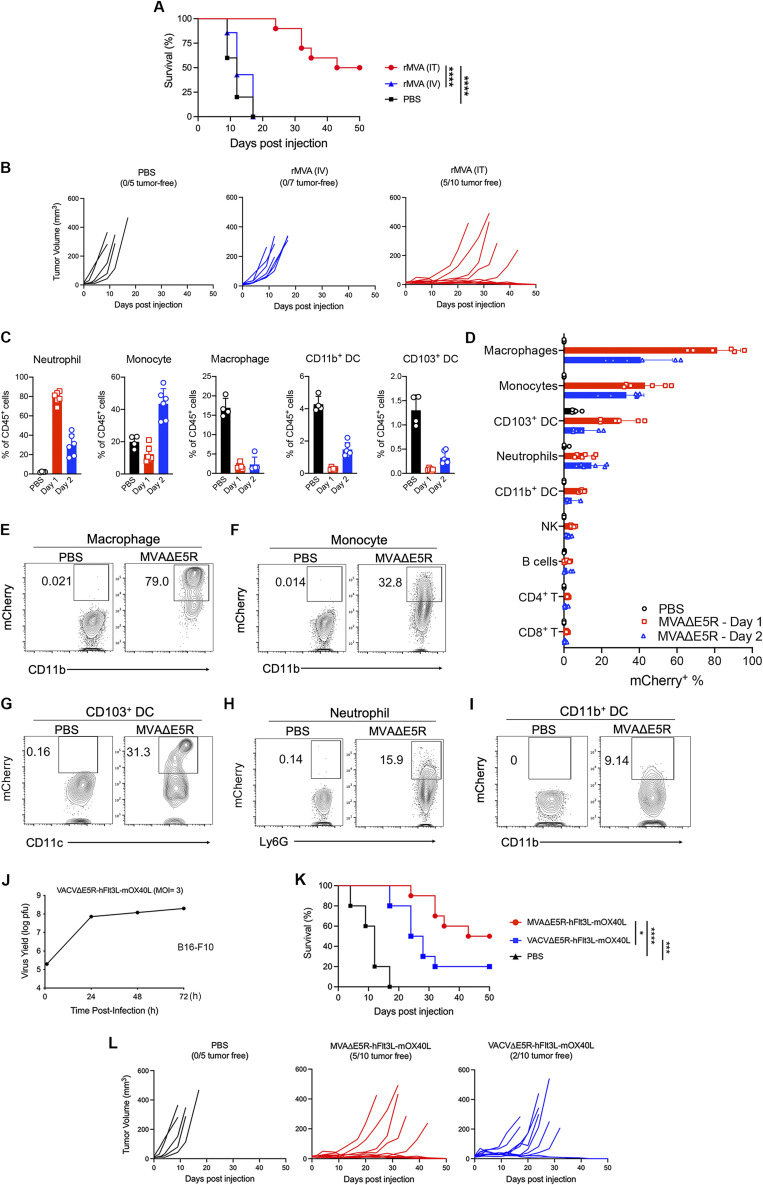
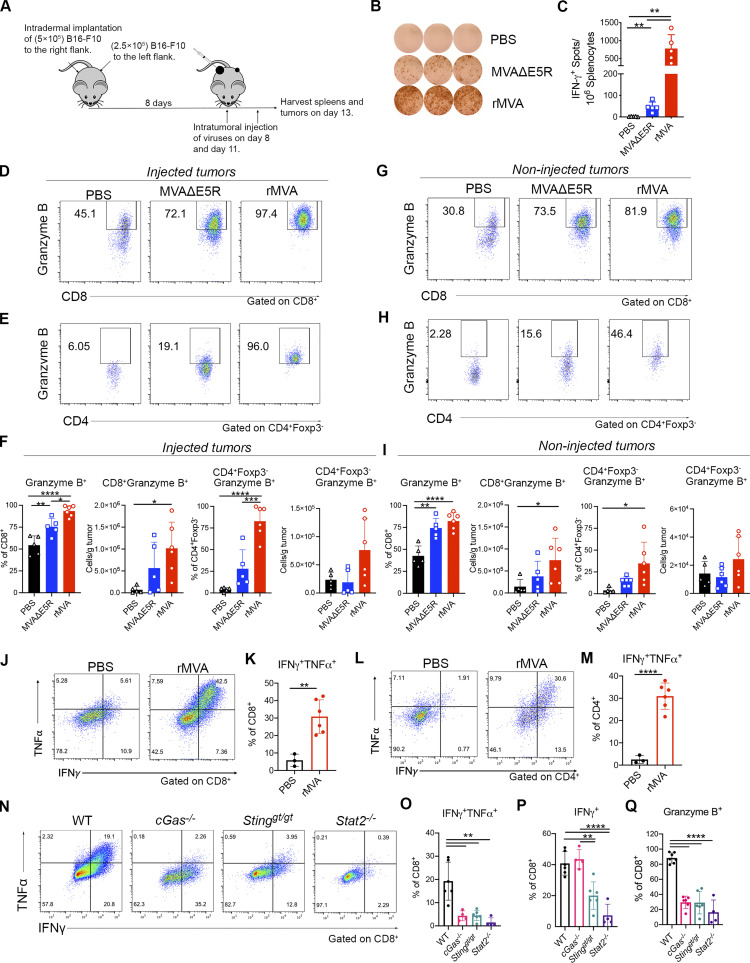
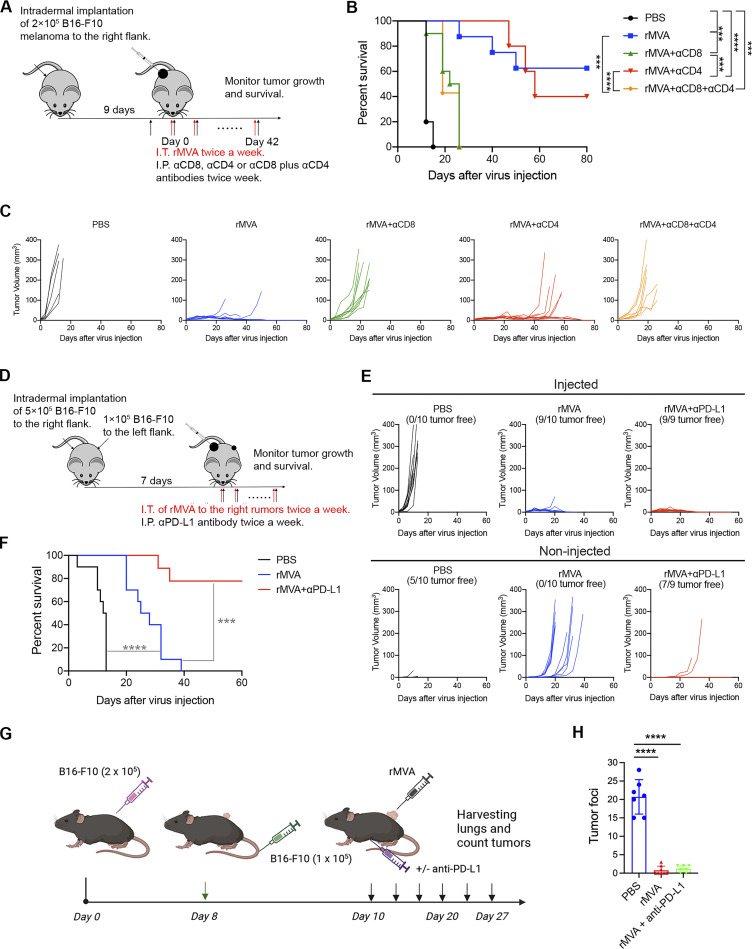
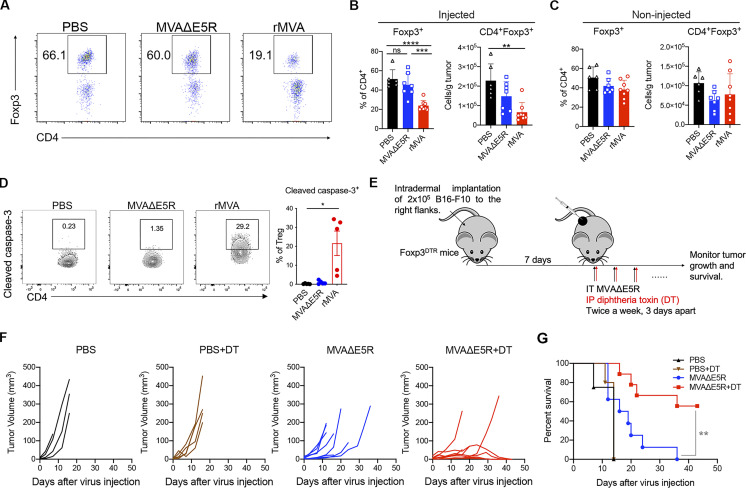
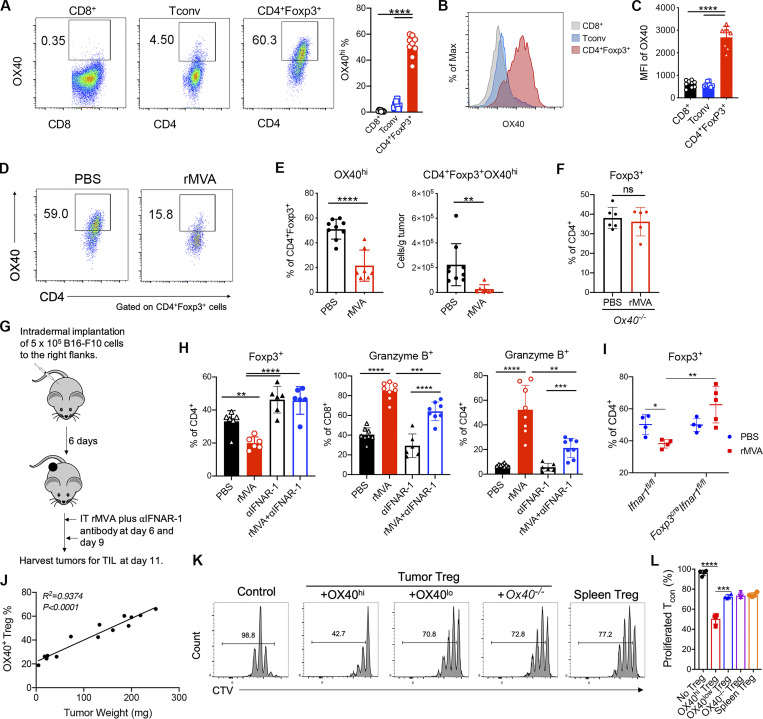
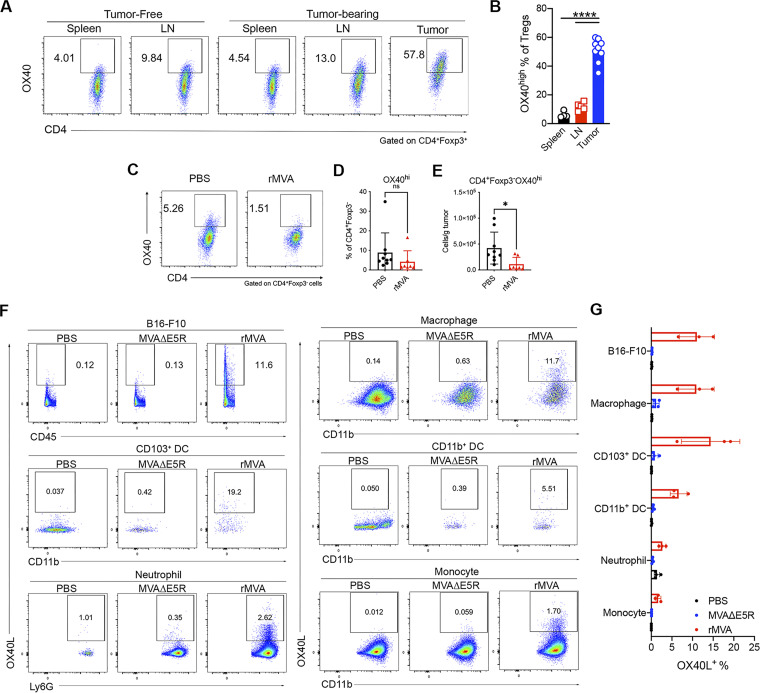
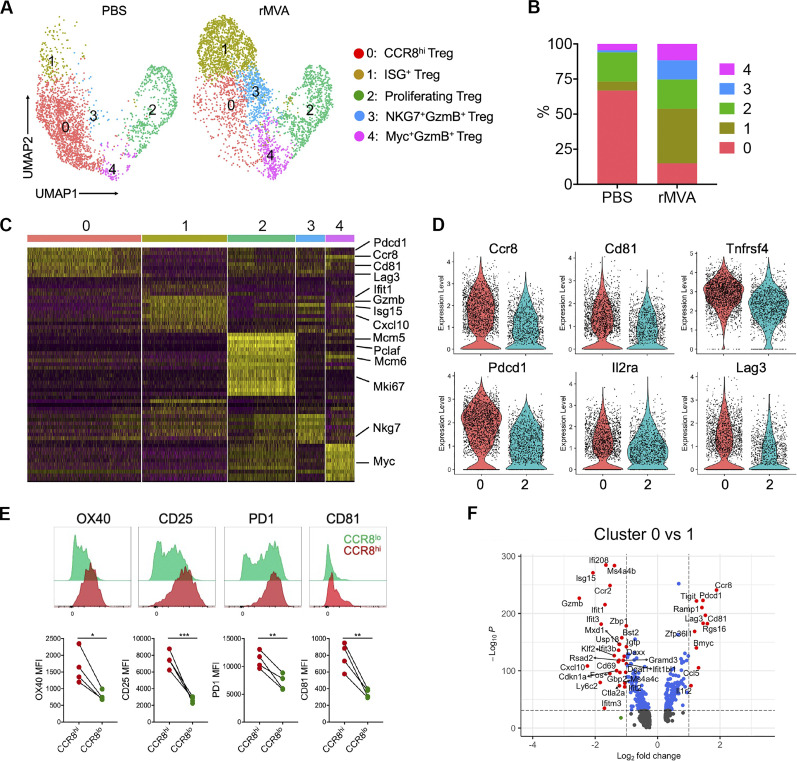
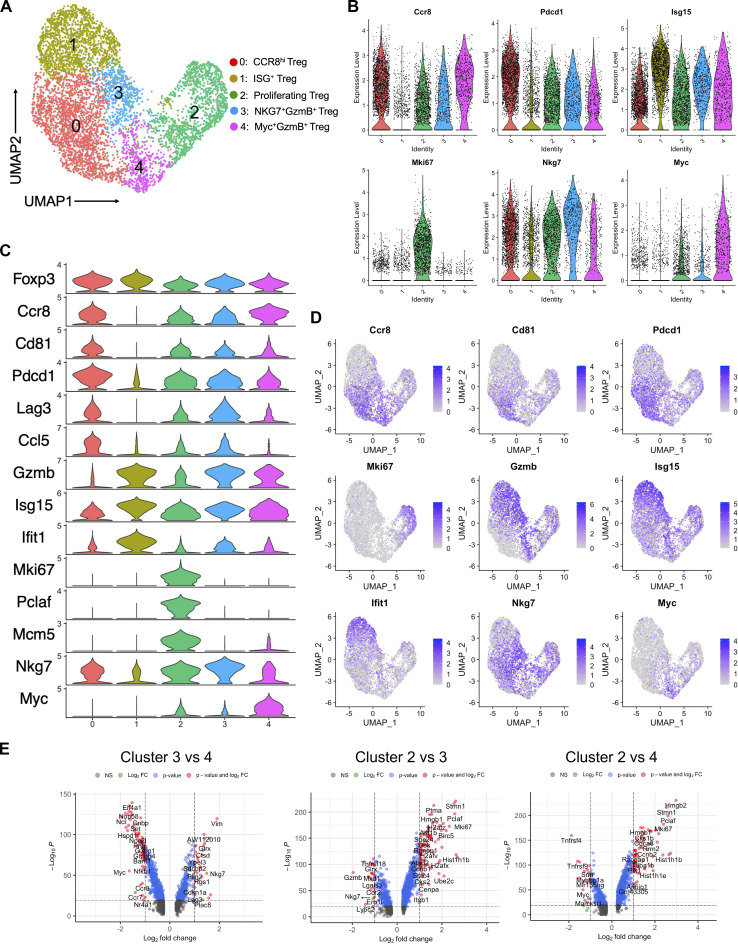
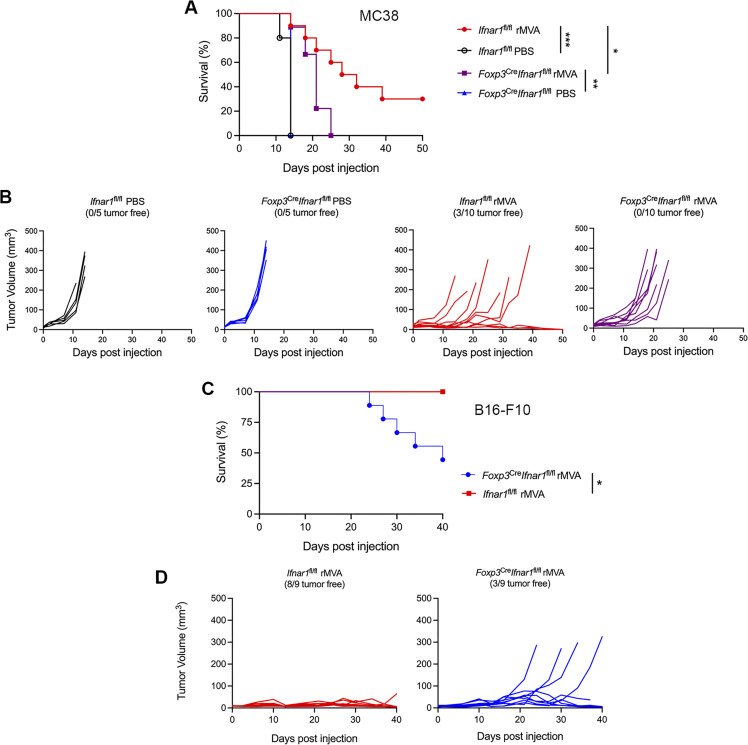
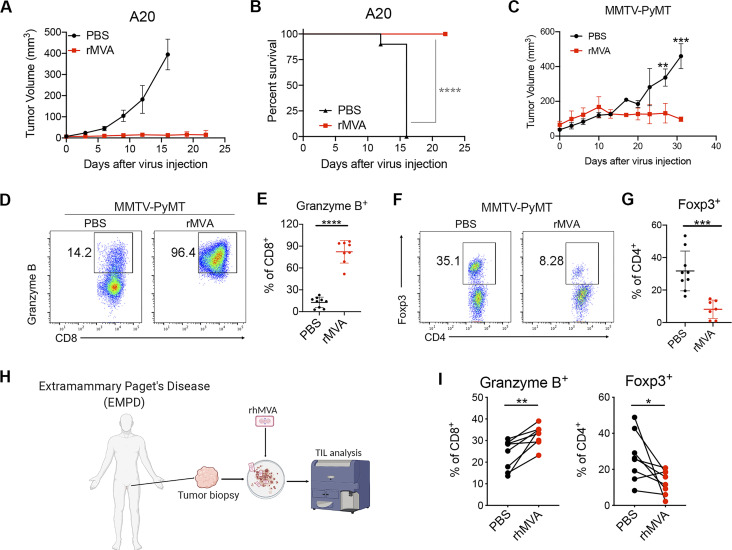
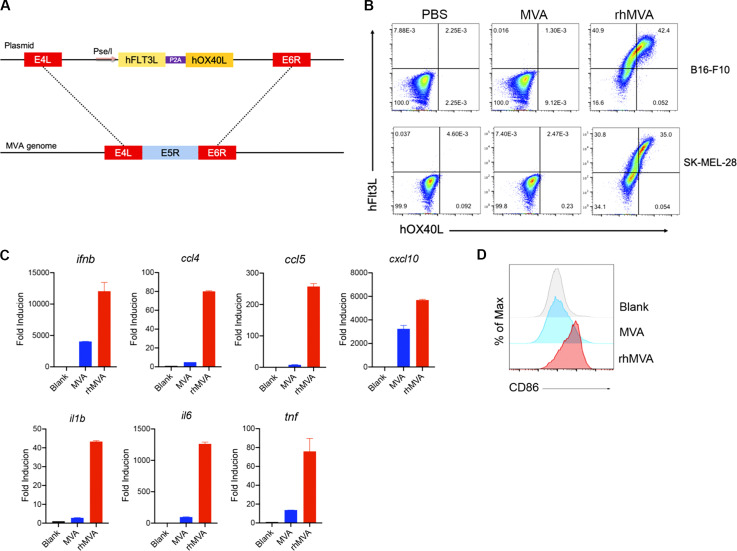
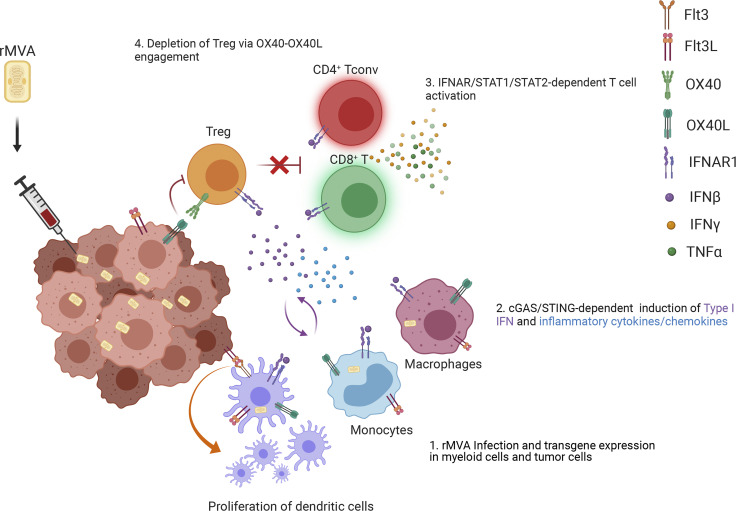
Effective depletion of immune suppressive regulatory T cells (Tregs) in the tumor microenvironment without triggering systemic autoimmunity is an important strategy for cancer immunotherapy. Modified vaccinia virus Ankara (MVA) is a highly attenuated, non-replicative vaccinia virus with a long history of human use. Here, we report rational engineering of an immune-activating recombinant MVA (rMVA, MVA∆E5R-Flt3L-OX40L) with deletion of the vaccinia E5R gene (encoding an inhibitor of the DNA sensor cyclic GMP-AMP synthase, cGAS) and expression of two membrane-anchored transgenes, Flt3L and OX40L. Intratumoral (IT) delivery of rMVA (MVA∆E5R-Flt3L-OX40L) generates potent antitumor immunity, dependent on CD8+ T cells, the cGAS/STING-mediated cytosolic DNA-sensing pathway, and type I IFN signaling. Remarkably, IT rMVA (MVA∆E5R-Flt3L-OX40L) depletes OX40hi regulatory T cells via OX40L/OX40 interaction and IFNAR signaling. Single-cell RNA-seq analyses of tumors treated with rMVA showed the depletion of OX40hiCCR8hi Tregs and expansion of IFN-responsive Tregs. Taken together, our study provides a proof-of-concept for depleting and reprogramming intratumoral Tregs via an immune-activating rMVA.


Conflict of interest statement

Disclosures: L. Deng, N. Yang, Y. Wang, G. Mazo, J. D. Wolchok, and T. Merghoub reported a patent US20220056475A1 Application Number: 17/275,974 (filed by Memorial Sloan Kettering Cancer Center and licensed to IMVAQ Therapeutics). L. Deng, N. Yang, J. D. Wolchok, T. Merghoub, W. Yan, and J. Choi are co-founders of IMVAQ Therapeutics and have equity in IMVAQ Therapeutics. L. Deng reported grants and personal fees from IMVAQ Therapeutics during the conduct of the study. N. Yang reported personal fees from IMVAQ Therapeutics during the conduct of study. W. Yan reported personal fees from IMVAQ during the conduct of the study and personal fees from Sound Biologics outside the submitted work. J. Choi is an employee of IMVAQ Therapeutics during the conduct of the study. C.M. Rice has been a scientific advisor for IMVAQ, which has an interest in the material presented in this paper. J. D. Wolchok reported personal fees from IMVAQ Therapeutics during the conduct of the study; personal fees from Apricity Therapeutics, Ascentage Pharma, AstraZeneca, Bicara Therapeutics, Boehringer Ingelheim, Bristol Myers Squibb, Chugai, Daiichi Sankyo, Dragonfly, Georgiamune, Larkspur, Linneaus, Psioxus, Recepta, Tizona Therapeutics, Trishula, and Sellas; grants from Bristol Myers Squibb and Sephora; and “other” from Maverick and Xenimmune outside the submitted work. In addition, J. D. Wolchok had a patent to xenogeneic DNA vaccines with royalties paid, a patent to Newcastle Disease viruses for Cancer Therapy with royalties paid, a patent to myeloid-derived suppressor cell (MDSC) assay with royalties paid, a patent to prediction of responsiveness to treatment with immunomodulatory therapeutics and method of with royalties paid, a patent to monitoring abscopal effects during such treatment with royalties paid CellCarta, a patent to anti-CTLA4 antibodies licensed Agenus, a patent to anti-PD1 licensed Agenus, and a patent to anti-GITR licensed Agenus/Incyte. T. Merghoub is a consultant for Leap Therapeutics, Immunos Therapeutics, and Pfizer; and has grants from Bristol-Myers Squibb, Surface Oncology, Kyn Therapeutics, Infinity Pharmaceuticals, Peregrine Pharmeceuticals, Adaptive Biotechnologies, Leap Therapeutics, and Aprea. T. Merghoub is an inventor on patent applications related to work on oncolytic viral therapy, alphavirus-based vaccines, neo-antigen modeling, CD40, GITR, OX40, PD-1, and CTLA-4. No other disclosures were reported.

Figures

None
Graphical abstract
Figure S1.
Figure S1.
Incremental engineering of MVA with deletion of E5R gene and expression of hFlt3L or mOX40L improves antitumor effects. (A) B16-F10 were transduced with retrovirus to generate hFlt3L- or mOX40L-expressing stable cell lines. C57BL/6J mice were intradermally implanted with 2 × 10⁵ B16-F10-hFlt3L, B16-F10-mOX40L, or B16-F10 control cells. (B) Tumor growth curve (n = 10). (C) Kaplan–Meier survival curve (n = 10; *P < 0.05, **P < 0.01, ****P < 0.0001, Mantel-Cox test). (D) Percentages and absolute number of CD103+ DCs and CD11b+ DCs in B16-F10-hFlt3L or B16-F10-control tumors. Data are means ± SD (n = 8 or 10; **P < 0.01, ***P < 0.001, t test). A representative experiment is shown, repeated once. (E) Percentages Granzyme B+ CD8+ and Granzyme B+ CD4+ in B16-F10-hFlt3L or B16-F10-control tumors. Data are means ± SD (n = 4; ****P < 0.0001, t test). A representative experiment is shown, repeated once. (F and G) Schematic diagrams for the generation of MVAΔΕ5R-hFlt3L (F) or MVAΔΕ5R-mOX40L (G) through homologous recombination. (H) Representative flow cytometry plots of expression of hFlt3L or mOX40L by MVA, MVAΔΕ5R, MVAΔΕ5R-hFlt3L, MVAΔΕ5R-mOX40L, or mock-infected BHK21 cells. (I) Schematic diagram of IT MVA, MVAΔE5R, MVAΔΕ5R-hFlt3L, MVAΔΕ5R-mOX40L, or PBS in a bilateral B16-F10 melanoma implantation model. (J) IFN-γ+ splenocytes from MVA, MVAΔE5R, MVAΔΕ5R-hFlt3L, MVAΔΕ5R-mOX40L, or PBS-treated mice. Data are means ± SD (n = 3; *P < 0.05, ***P < 0.001, t test). (K) Kaplan–Meier survival curve of mice treated with MVA, MVAΔΕ5R, MVA∆E5R-hFlt3L, MVA∆E5R-mOX40L, MVA∆E5R-hFlt3L-mOX40L, or PBS in a unilateral B16-F10 implantation model (n = 10 in each virus group and n = 5 in PBS group; *P < 0.05, ***P < 0.001, ****P < 0.0001, Mantel-Cox test). (L) B16-F10 tumor volumes over time in C57BL/6J mice treated with MVA, MVAΔΕ5R, MVA∆E5R-hFlt3L, MVA∆E5R-mOX40L, MVA∆E5R-hFlt3L-mOX40L, or PBS.
Figure 1.
Figure 1.
IT injection of rMVA elicits strong antitumor immunity. (A) Schematic diagram for the generation of rMVA through homologous recombination. (B) Representative flow cytometry plots of expression of hFlt3L or mOX40L in rMVA-infected B16-F10 cells and BMDCs. (C) Relative mRNA expression levels of Ifnb, Ifna, Ccl4, Ccl5, Cxcl9, Cxcl10, and Il12p40 in BMDCs infected with MVA or rMVA. Data are means ± SD (n = 3; *P < 0.05, **P < 0.01, ***P < 0.001, ****P < 0.0001, t test). A representative experiment is shown, repeated twice. (D) Concentrations of secreted IFN-β in the medium of WT or cGas−/− BMDCs infected with MVA or rMVA. Data are means ± SD. (E) Mean fluorescence intensity of CD86 expressed by WT or cGas−/− BMDCs infected with MVA or rMVA. (F) Kaplan–Meier survival curve of mice treated with rMVA or PBS in a unilateral B16-F10 implantation model (n = 5 ∼ 10; ***P < 0.001, ****P < 0.0001, Mantel-Cox test). A representative experiment is shown, repeated once. (G) Tumor growth curve of mice treated with rMVA or PBS in a unilateral B16-F10 implantation model. (H) Heatmap of gene expression from RNA-seq analysis of RNAs isolated from tumors implanted on WT or Stinggt/gt mice treated with or without IT delivery of rMVA. (I) Gene set enrichment analysis of the expression of genes involved IFN-γ response, apoptosis, and oxidative phosphorylation in tumors treated with rMVA vs. PBS control.
Figure S2.
Figure S2.
IT delivery of rMVA (MVA∆E5R-hFlt3L-mOX40L) is more efficacious in eradicating tumors than IV delivery of the virus. (A) Kaplan–Meier survival curve of mice treated with IT vs. IV delivery of rMVA in a unilateral B16-F10 implantation model (n = 5–10; ****P < 0.0001, Mantel-Cox test). (B) B16-F10 tumor volumes over time in C57BL/6J mice treated with IT vs. IV delivery of rMVA. PBS mock-treatment control was included. (C–I) Influx of myeloid cells into MVAE5R-treated tumors and induction of IFN-β and other inflammatory cytokine production in a cGAS/STING-dependent manner. (C) Percentages of neutrophils, monocytes, macrophages, CD103+ DCs, and CD11b+ DCs in the MVA∆E5R-treated tumors. Mice were intradermally implanted with B16-F10 cells. 7 d after implantation, tumors were injected with MVAΔE5R-mCherry or PBS as control and harvested 1 or 2 d after injection for myeloid cell analysis. Data are means ± SD (n = 4 ∼ 6). (D) Percentages of mCherry+ immune cells. Data are means ± SD (n = 4–6). NK, natural killer. (E–I) Representative flow cytometry plots of mCherry+ immune cells. (J–L) IT delivery of rMVA (MVA∆E5R-hFlt3L-mOX40L) is more effective than VACV∆E5R-hFlt3L-mOX40L in restricting tumor growth. (J) VACV∆E5R-hFlt3L-mOX40L replication curve in B16-F10 cells. Cells were infected at an MOI of 3. (K) Kaplan–Meier survival curve of mice treated with IT delivery of rMVA (MVA∆E5R-hFlt3L-mOX40L) vs. VACV∆E5R-hFlt3L-mOX40L in a unilateral B16-F10 implantation model (n = 10 in each virus group and n = 5 in PBS group; *P < 0.05, ***P < 0.001, ****P < 0.0001, Mantel-Cox test). (L) B16-F10 tumor volumes over time in C57BL/6J mice treated with IT delivery of rMVA (MVA∆E5R-hFlt3L-mOX40L) vs. VACV∆E5R-hFlt3L-mOX40L. PBS mock-treatment control was included.
Figure 2.
Figure 2.
IT rMVA generates strong systemic and local anti-tumor immune responses dependent on cGAS/STING/STAT2 pathways. (A) Schematic diagram of IT rMVA or MVAΔE5R for ELISpot assay and TIL analysis in a murine B16-F10 melanoma implantation model. (B) Representative images of IFN-γ+ spots from ELISpot assay. The experiment was repeated twice. (C) Statistical analysis of IFN-γ+ splenocytes from MVAΔE5R-, rMVA-, or PBS-treated mice. Data are means ± SD (n = 5 or 6; **P < 0.01, t test). (D and E) Representative flow cytometry plots of Granzyme B+ CD8+ (D) and Granzyme B+ CD4+ Foxp3 cells (E) in the injected tumors. (F) Percentages and absolute number of Granzyme B+ CD8+ and Granzyme B+ CD4+ Foxp3 cells in the injected tumors. Data are means ± SD (n = 5 or 6; *P < 0.05, **P < 0.01, ***P < 0.001, ****P < 0.0001, t test). (G and H) Representative flow cytometry plots of Granzyme B+ CD8+ (G) and Granzyme B+ CD4+ Foxp3 cells (H) in the non-injected tumors. (I) Percentages and absolute number of Granzyme B+ CD8+ and Granzyme B+ CD4+ Foxp3 cells in the non-injected tumors. Data are means ± SD (n = 5 or 6; *P < 0.05, **P < 0.01, ****P < 0.0001, t test). (J–M) Representative flow cytometry plots and statistical analysis of IFNγ+TNFα+ CD8+ (J and K) and IFNγ+TNFα+ CD4+ cells (L and M) in the injected tumors. Data are means ± SD (n = 3 or 6; **P < 0.01, ****P < 0.0001, t test). The above experiment was repeated twice. (N) Representative flow cytometry plots of IFNγ+TNFα+ CD8+ T cells in the injected tumors harvested from WT, cGas−/−, Stinggt/gt, and Stat2−/− mice. (O) Percentages of IFNγ+TNFα+ CD8+ T cells in the injected tumors from WT, cGAS−/−, Stinggt/gt, and Stat2−/− mice. Data are means ± SD (n = 4 ∼ 6; **P < 0.01, t test). (P) Percentages of IFN-γ+ CD8+ T cells in the injected tumors from WT, cGAS−/−, Stinggt/gt and Stat2−/− mice. Data are means ± SD (n = 4 ∼ 6; **P < 0.01, ****P < 0.0001, t test). (Q) Percentages of Granzyme B+ CD8+ T cells in the injected tumors from WT, cGas−/−, Stinggt/gt, and Stat2−/− mice. Data are means ± SD (n = 4 ∼ 6; ****P < 0.0001, t test). A representative experiment is shown, repeated once.
Figure 3.
Figure 3.
CD8 T cells are required for rMVA-induced antitumor effects. (A) Schematic diagram of IT rMVA in C57BL/6J mice in the presence or absence of depleting antibodies for CD8 and/or CD4 in a unilateral B16-F10 melanoma implantation model. (B) Kaplan–Meier survival curve of mice treated with IT rMVA in the presence or absence of depleting antibodies for CD8 and/or CD4 (n = 5 ∼ 10; ***P < 0.001, ****P < 0.0001, Mantel-Cox test). A representative experiment is shown, repeated once. (C) Tumor volumes over days in mice under various treatment conditions. (D) Schematic diagram of IT rMVA in combination with IP αPD-L1 antibody in a bilateral B16-F10 melanoma implantation model. (E) Injected and non-injected tumor volumes over days in mice under various treatment conditions. (F) Kaplan–Meier survival curve of mice treated with IT rMVA alone or in combination with IP anti–PD-L1 antibody (n = 9 or 10; ***P < 0.001, ****P < 0.0001, Mantel-Cox test). A representative experiment is shown, repeated once. (G) Schematic diagram of testing whether IT rMVA results in restricting B16-F10 melanoma lung metastasis in C57BL/6J mice. (H) B16-F10 tumor foci on the surface of lungs of mice treated with PBS, rMVA, or the combination of IT rMVA and systemic delivery of anti–PD-L1 antibody (n = 7 or 8; ****P < 0.0001, t test).
Figure 4.
Figure 4.
IT rMVA depletes OX40hi Tregs in the injected tumors to promote anti-tumor therapy. (A) Representative flow cytometry plots of Foxp3+CD4+ cells in the injected tumors. Mice were treated as described in Fig. 2 A. (B and C) Percentages and absolute number of Foxp3+CD4+ cells in the injected (B) and non-injected (C) tumors. Data are means ± SD (n = 6–8; **P < 0.01, ***P < 0.001, ****P < 0.0001, t test). (D–F) Mice were intradermally implanted with B16-F10 cells. Tumors were injected with rMVA, MVA∆E5R, or PBS as control after 7 d after implantation and harvested 2 d after injection. (D) Left: Representative flow cytometry plots of cleaved caspase-3+ Tregs in the injected tumors. The experiment was repeated twice. Right: Percentages of cleaved caspase-3 in tumor-infiltrating Tregs by flow cytometry. Data are means ± SD (n = 3–5; *P < 0.05, t test). (E) Schematic diagram of IT MVA∆E5R in the presence or absence of DT in a unilateral B16-F10 melanoma implantation model in Foxp3DTR mice. Three doses of DT (200 ng each per mouse) were administered to mice at −2, −1, and +1 d relative to the first MVA∆E5R injection at day 0. (F) Tumor volumes over time in mice treated with MVA∆E5R, MVA∆E5R + DT, DT alone, or PBS. (G) Kaplan–Meier survival curves of mice treated with MVA∆E5R, MVA∆E5R + DT, DT alone, or PBS (n = 5–10; **P < 0.01, Mantel-Cox test).
Figure 5.
Figure 5.
IT rMVA preferentially depletes OX40hi Tregs in the injected tumors in a type I IFN signaling dependent manner. (A) Representative flow cytometry plots of OX40 expression on tumor infiltrating CD8+, Tconv (CD4+Foxp3), and CD4+Foxp3+ T cells in tumors 15 d after implantation. Mice were treated as described in Fig. 2 A. (B and C) Representative flow cytometry plots and statistical analysis of mean fluorescence intensity (MFI) of OX40 on tumor-infiltrating CD8+, Tconv (CD4+Foxp3), and CD4+Foxp3+ T cells. Data are means ± SD in C (n = 6 ∼ 8; ****P < 0.0001, t test). (D) Representative flow cytometry plots of OX40hi CD4+Foxp3+ in the injected tumors. Mice were treated as described in Fig.2 A. The experiment was repeated twice. (E) Percentages and absolute number of OX40hi CD4+Foxp3+ T cells in the injected tumors. Data are means ± SD (n = 7 or 9; **P < 0.01, ****P < 0.0001, t test). (F) Percentages of CD4+Foxp3+ T cells in the injected tumors from WT and Ox40−/− mice. Mice were treated as described in Fig. 3 A. Data are means ± SD (n = 5 or 6; t test). A representative experiment is shown, repeated once. (G) Schematic diagram of IT rMVA in the presence or absence of IT αIFNAR-1 antibody in a unilateral B16-F10 melanoma implantation model. (H) Percentages of CD4+Foxp3+, CD8+Granzyme B+, and CD4+Granzyme B+ T cells in the injected tumors. Data are means ± SD (n = 6; **P < 0.01, ***P < 0.001, ****P < 0.0001, t test). A representative experiment is shown, repeated once. (I) Percentages of CD4+Foxp3+ T cells in the injected tumors in Ifnar1fl/fl and Foxp3creIfnar1fl/fl mice treated with IT rMVA or PBS. Data are means ± SD (n = 4–5; *P < 0.05, **P < 0.01, t test). A representative experiment is shown, repeated once. (J) Correlation of the percentages of OX40hi Tregs in the tumors with tumor weight. Mice were implanted with B16-F10 tumors intradermally. Tumors with different sizes were analyzed for OX40 expression on tumor-infiltrating Tregs. (K and L) Representative flow cytometry plots (K) and percentage of Tcon (conventional CD4+ T cells) proliferation (L) as measured by CellTrace Violet (CTV) dye dilution co-cultured with tumor OX40hi, OX40low, Ox40−/− Tregs, or spleen Tregs. Data are means ± SD in L (***P < 0.001, ****P < 0.0001, t test). A representative experiment is shown, repeated once.
Figure S3.
Figure S3.
OX40 expression on T cells in lymphoid organs and in tumors and OX40L expression in tumors and tumor-infiltrating cells after IT rMVA. (A) Representative flow cytometry plots of OX40 expression on CD4+Foxp3+ T cells in the spleens, lymph nodes, or tumors from naive or B16-F10 tumor-bearing mice. The experiment was repeated twice. (B) Percentages of OX40hi Tregs in the spleens, lymph nodes, and tumors in the tumor-bearing mice (n = 7 or 9; ****P < 0.0001, t test). (C) Representative flow cytometry plots of OX40 expression on CD4+Foxp3 T cells in the PBS- or rMVA-injected tumors. (D and E) Percentages (D) and absolute numbers (E) of OX40hi CD4+Foxp3 Tconv cells in the injected tumors. Data are means ± SD (n = 7 or 9; *P < 0.05, t test). (F) Representative flow cytometry plots of OX40L expression on B16-F10 tumor cells or myeloid cells in the tumors injected with MVAΔE5R, rMVA, or PBS as control. The experiment was repeated once. (G) Percentages of OX40L+ B16-F10 cells or myeloid cells in the tumors. Data are means ± SD (n = 3–5).
Figure 6.
Figure 6.
scRNA-seq of Tregs in tumors treated with rMVA or PBS control. (A) UMAP visualization of single-cell transcriptomes of Treg cells isolated from tumors treated with rMVA or PBS control. Each dot corresponds to a single cell, color coded by cell cluster. (B) Proportion of each Treg subtype in all Treg cells from PBS- and rMVA-treated tumors. (C) Heatmap of genes differentially expressed according to cluster identity as in A. (D) Violin plots showing the expression levels of selected marker genes in clusters 0 and 2. (E) Representative FACS plot and statistical analysis of mean fluorescence intensity (MFI) showing the expressions of OX40, CD25, PD1, and CD81 on CCR8hi Tregs and CCR8lo IT Tregs. (F) Volcano plots showing genes differentially expressed between clusters 0 and 1.
Figure S4.
Figure S4.
Single-cell transcriptomic analysis of Tregs in the tumors. (A) UMAP visualization of single-cell transcriptomes of Treg cells isolated from PBS- and rMVA-treated tumors. Each dot corresponds to a single cell and each color represents one cluster. (B) Violin plots showing the expression levels of selected marker genes in different Treg cell clusters. (C) Violin plots showing the expression levels of top enriched genes in different Treg cell clusters. (D) UMAP showing the expression of selected marker genes for each Treg cell cluster. (E) Volcano plots showing genes differentially expressed between clusters 3 vs. 4, clusters 2 vs. 3, and clusters 2 vs. 4.
Figure 7.
Figure 7.
IFNAR1 on Tregs are important for rMVA-induced antitumor effects in two murine tumor models. (A) Kaplan–Meier survival curve of MC38-bearing Ifnar1fl/fl and Foxp3CreIfnar1fl/fl mice treated with IT rMVA or PBS (n = 5 or 10; *P < 0.05, **P < 0.01, ***P < 0.001, Mantel-Cox test). (B) MC38 tumor volumes over days in Ifnar1fl/fl and Foxp3CreIfnar1fl/fl mice treated with IT rMVA or PBS control. (C) Kaplan–Meier survival curve of B16-F10-bearing Ifnar1fl/fl and Foxp3CreIfnar1fl/fl mice treated with IT rMVA (n = 9; *P < 0.05, Mantel-Cox test). (D) B16-F10 tumor volumes over days in Ifnar1fl/fl and Foxp3CreIfnar1fl/fl mice treated with IT rMVA.
Figure 8.
Figure 8.
IT rMVA elicits strong antitumor immunity in multiple murine tumor models. (A) Tumor volumes over days in BALB/c mice treated with IT rMVA or PBS control in an A20 B cell lymphoma implantation model. (B) Kaplan–Meier survival curve of mice treated with IT rMVA or PBS (n = 10; ****P < 0.0001, Mantel-Cox test). A representative experiment is shown, repeated once. (C) Tumor volumes over days in the MMTV-PyMT breast tumor model. Data are means ± SD (n = 5; **P <0.01, ***P < 0.001, t test). (D) Representative flow cytometry plots of Granzyme B+CD8+ T cells in the IT rMVA- or PBS-treated tumors from MMTV-PyMT mice. A representative experiment is shown, repeated twice. (E) Percentages of Granzyme B+ CD8+ T cells in the rMVA- or PBS-injected tumors. Data are means ± SD (n = 8; ****P < 0.0001, t test). (F) Representative flow cytometry plots of Foxp3+CD4+ T cells in the rMVA- or PBS-injected tumors. (G) Percentages of Foxp3+CD4+ T cells in the rMVA- or PBS-injected tumors. Data are means ± SD (n = 8; ***P < 0.001, t test). (H) Schematic diagram of ex vivo infection of human Extramammary Paget’s disease tumors with rhMVA (MVA∆E5R-hFlt3L-hOX40L). (I) Percentages of Granzyme B+CD8+ T cells and Foxp3+CD4+ T cells in the rhMVA- or PBS-treated tumor tissues. Data are means ± SD (n = 7; *P < 0.05, **P < 0.01, t test).
Figure S5.
Figure S5.
Clinical candidate rhMVA induces innate immunity and promotes maturation of human moDCs. (A) Schematic diagram for the generation of rhMVA through homologous recombination. (B) Representative flow cytometry plots of expression of hFlt3L or hOX40L by rMVA-infected B16-F10 cells and SK-MEL-28 cells. (C) Relative mRNA expression levels of ifnb, ccl4, ccl5, cxcl10, il1b, il6, and tnf in moDCs infected with MVA or rhMVA. A representative experiment is shown, repeated once. (D) Mean fluorescence intensity of CD86 expressed by human moDCs infected with MVA or rhMVA. A representative experiment is shown, repeated once.
Figure 9.
Figure 9.
Working model. IT injection of rMVA results in the infection of tumor-infiltrating myeloid cells, including macrophages, monocytes, and DCs, as well as tumor cells. This leads to the activation of cGAS/STING-mediated cytosolic DNA-sensing pathway and the production of type I IFN and cytokines and chemokines that are important for CD8+ and CD4+ T cell proliferation and activation (as indicated by Granzyme B, TNF, and IFN-γ expression). Flt3L expression of the tumor microenvironment facilitates the proliferation of CD103+ DCs in the tumors. OX40L expression by myeloid cell populations and tumor cells results in the depletion of OX40hi Tregs infiltrating the tumors via OX40L–OX40 ligation, which is promoted by type I IFN. This leads to the blunting of their inhibition on tumor-specific effector CD4+ and CD8+ T cells. Taken together, IT delivery of rMVA results in the alteration of tumor immunosuppressive microenvironment through activation of innate immunity and boosting of antitumor T cells by depletion of OX40hi regulatory T cells.

References

    1. Antoine, G., Scheiflinger F., Dorner F., and Falkner F.G.. 1998. The complete genomic sequence of the modified vaccinia Ankara strain: Comparison with other orthopoxviruses. Virology. 244:365–396. 10.1006/viro.1998.9123 - DOI - PubMed
    1. Barsheshet, Y., Wildbaum G., Levy E., Vitenshtein A., Akinseye C., Griggs J., Lira S.A., and Karin N.. 2017. CCR8+FOXp3+ Treg cells as master drivers of immune regulation. Proc. Natl. Acad. Sci. USA. 114:6086–6091. 10.1073/pnas.1621280114 - DOI - PMC - PubMed
    1. Bommareddy, P.K., Shettigar M., and Kaufman H.L.. 2018. Integrating oncolytic viruses in combination cancer immunotherapy. Nat. Rev. Immunol. 18:498–513. 10.1038/s41577-018-0014-6 - DOI - PubMed
    1. Bos, P.D., Plitas G., Rudra D., Lee S.Y., and Rudensky A.Y.. 2013. Transient regulatory T cell ablation deters oncogene-driven breast cancer and enhances radiotherapy. J. Exp. Med. 210:2435–2466. 10.1084/jem.20130762 - DOI - PMC - PubMed
    1. Chen, A.I., McAdam A.J., Buhlmann J.E., Scott S., Lupher M.L. Jr, Greenfield E.A., Baum P.R., Fanslow W.C., Calderhead D.M., Freeman G.J., and Sharpe A.H.. 1999. Ox40-ligand has a critical costimulatory role in dendritic cell:T cell interactions. Immunity. 11:689–698. 10.1016/S1074-7613(00)80143-0 - DOI - PubMed

Publication types

Substances

Supplementary concepts