. 2023 May 12;8(83):eabq6352.
doi: 10.1126/sciimmunol.abq6352. Epub 2023 May 5.

A human model of asthma exacerbation reveals transcriptional programs and cell circuits specific to allergic asthma

Affiliations

A human model of asthma exacerbation reveals transcriptional programs and cell circuits specific to allergic asthma

Jehan Alladina et al. Sci Immunol. .

Abstract

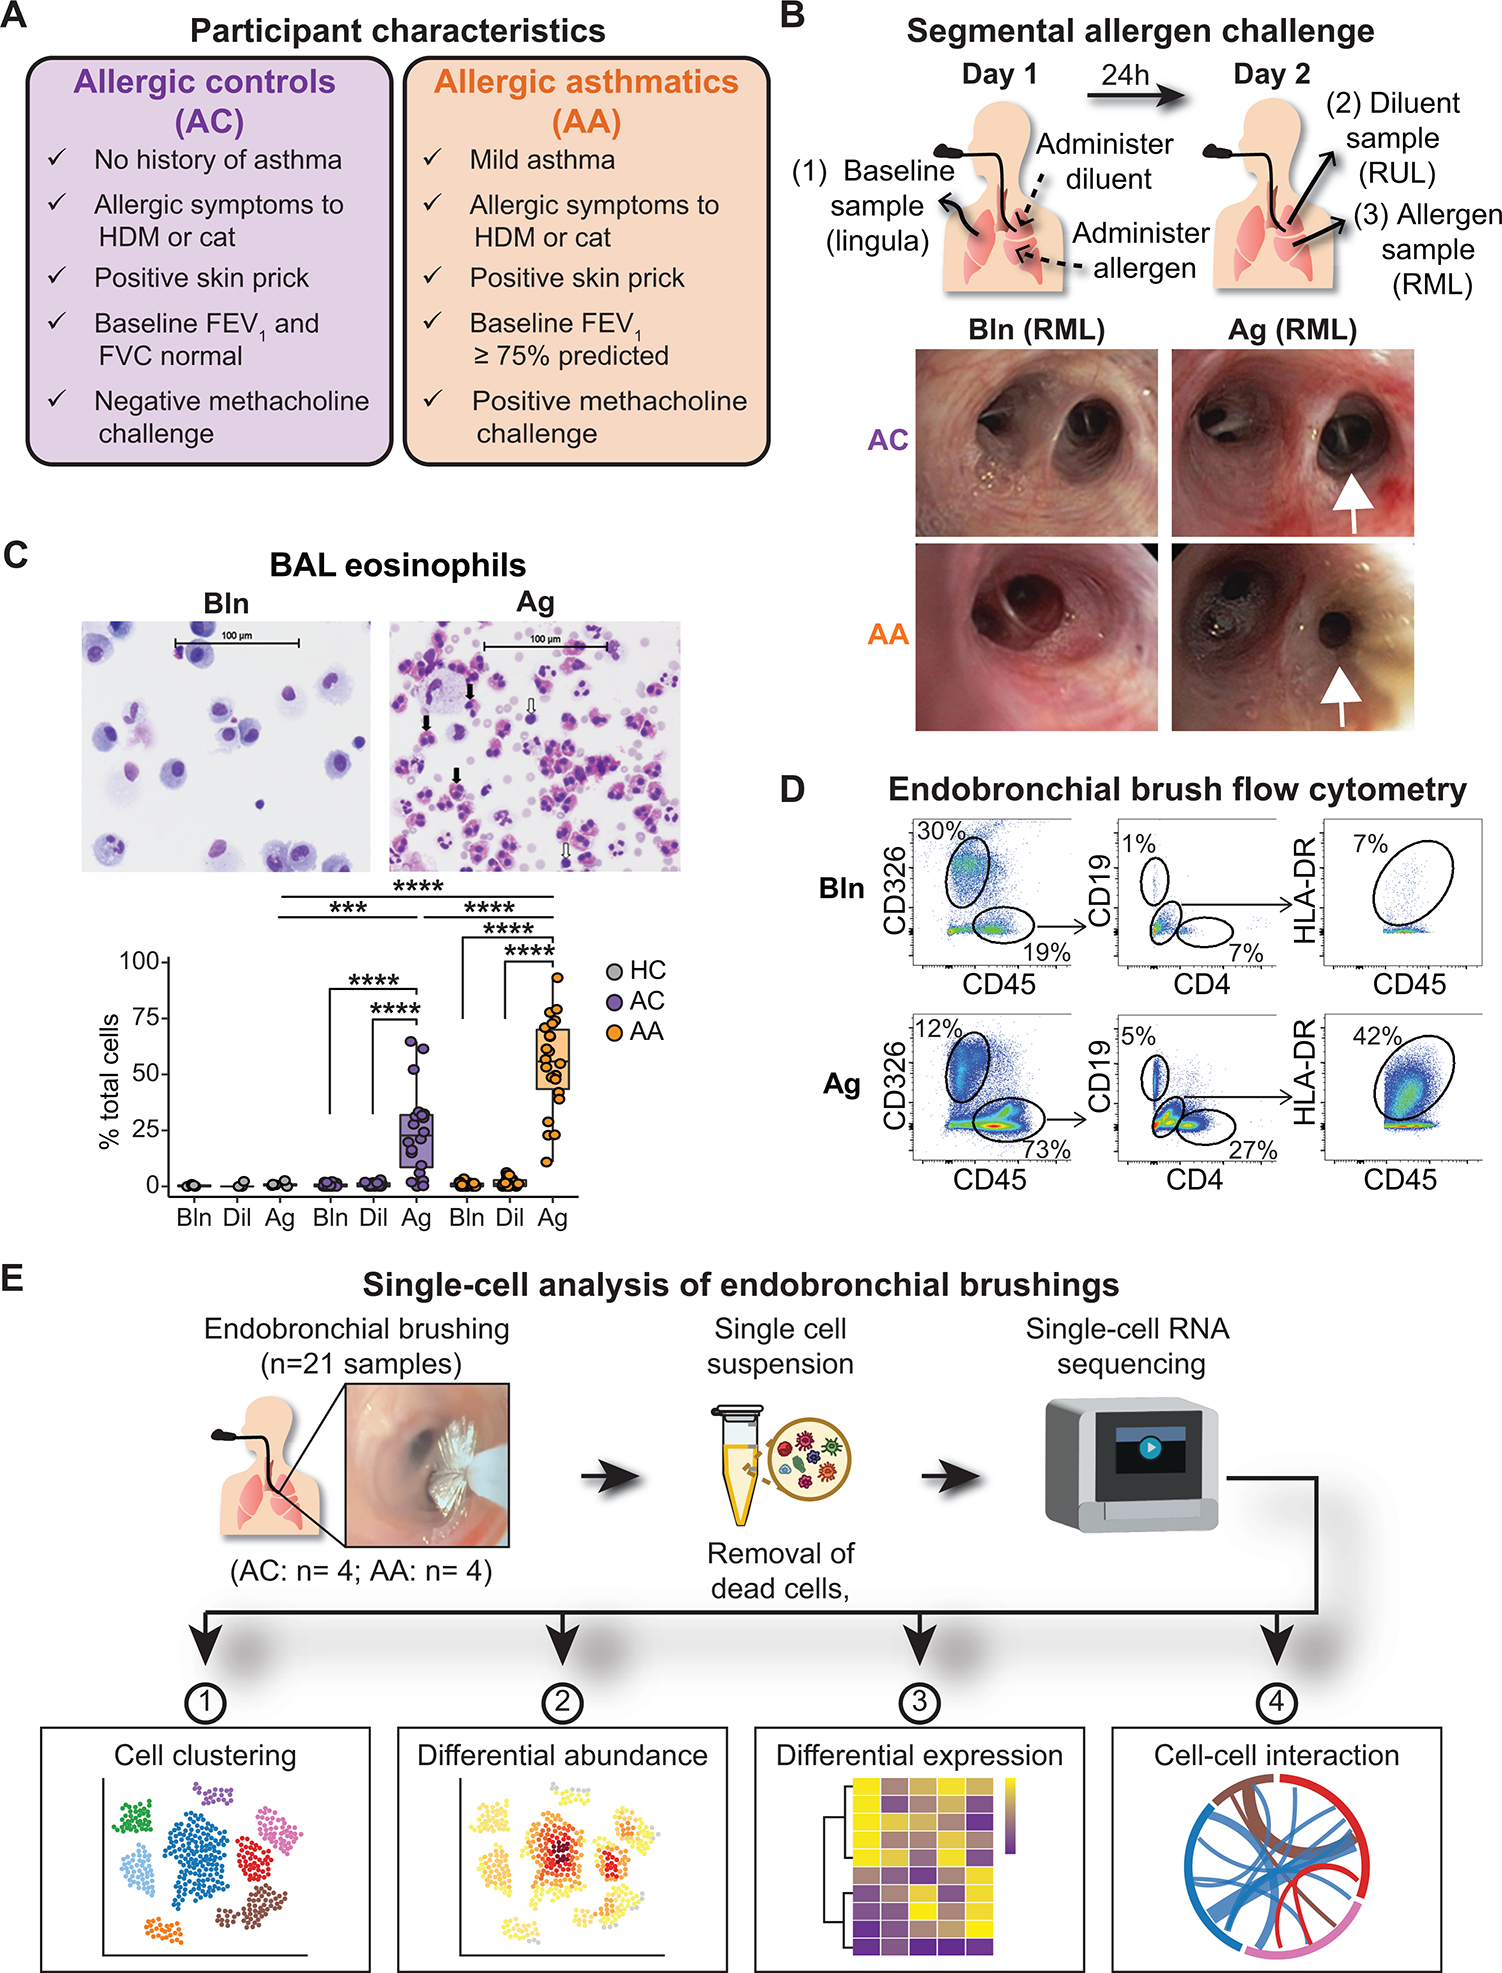
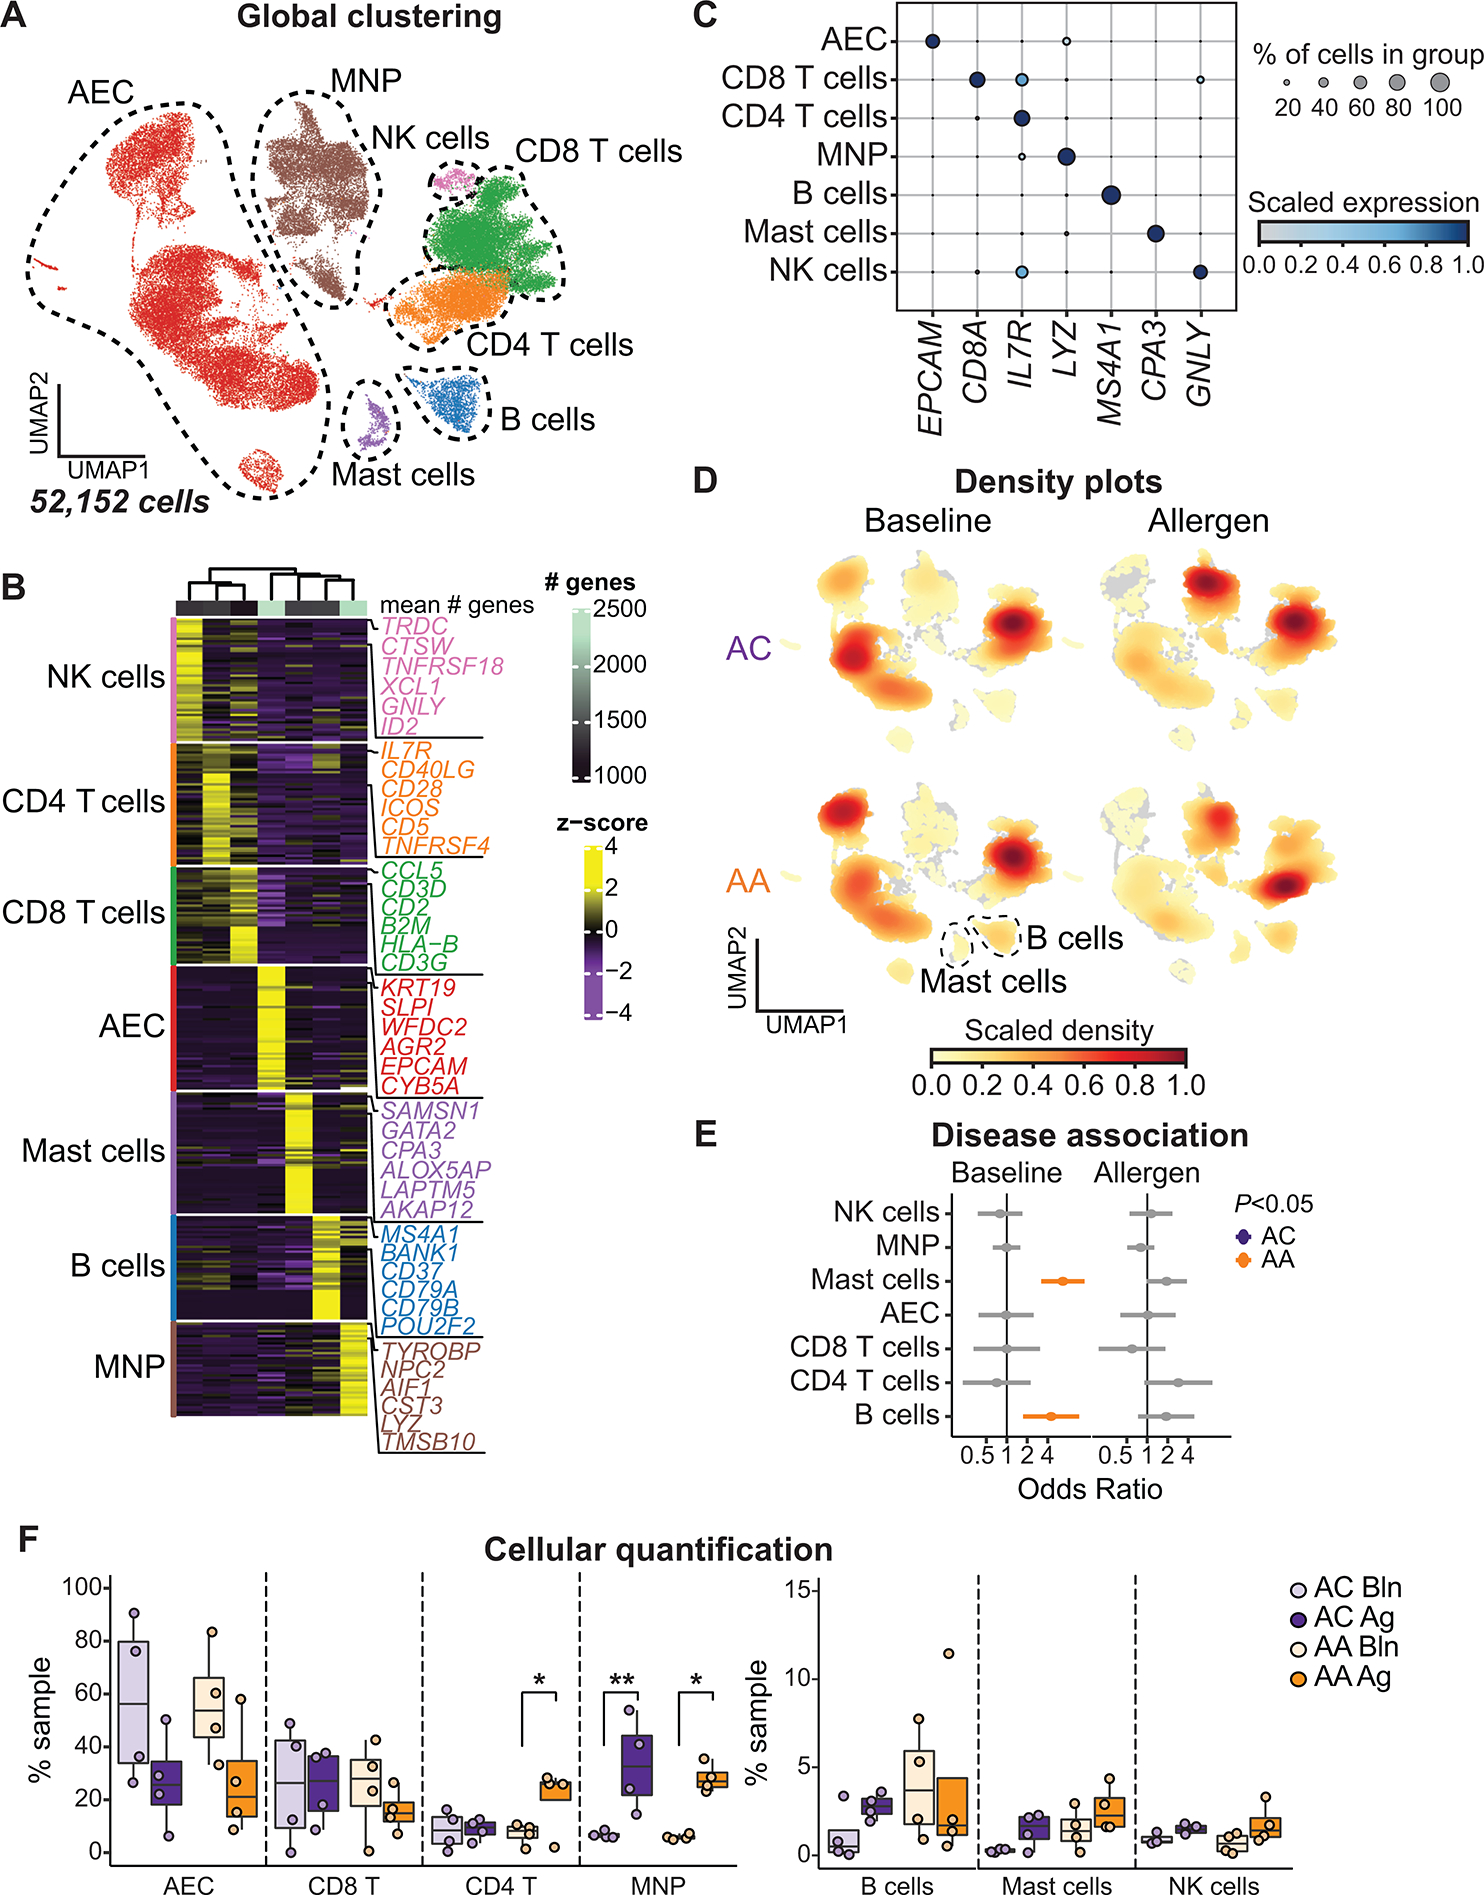
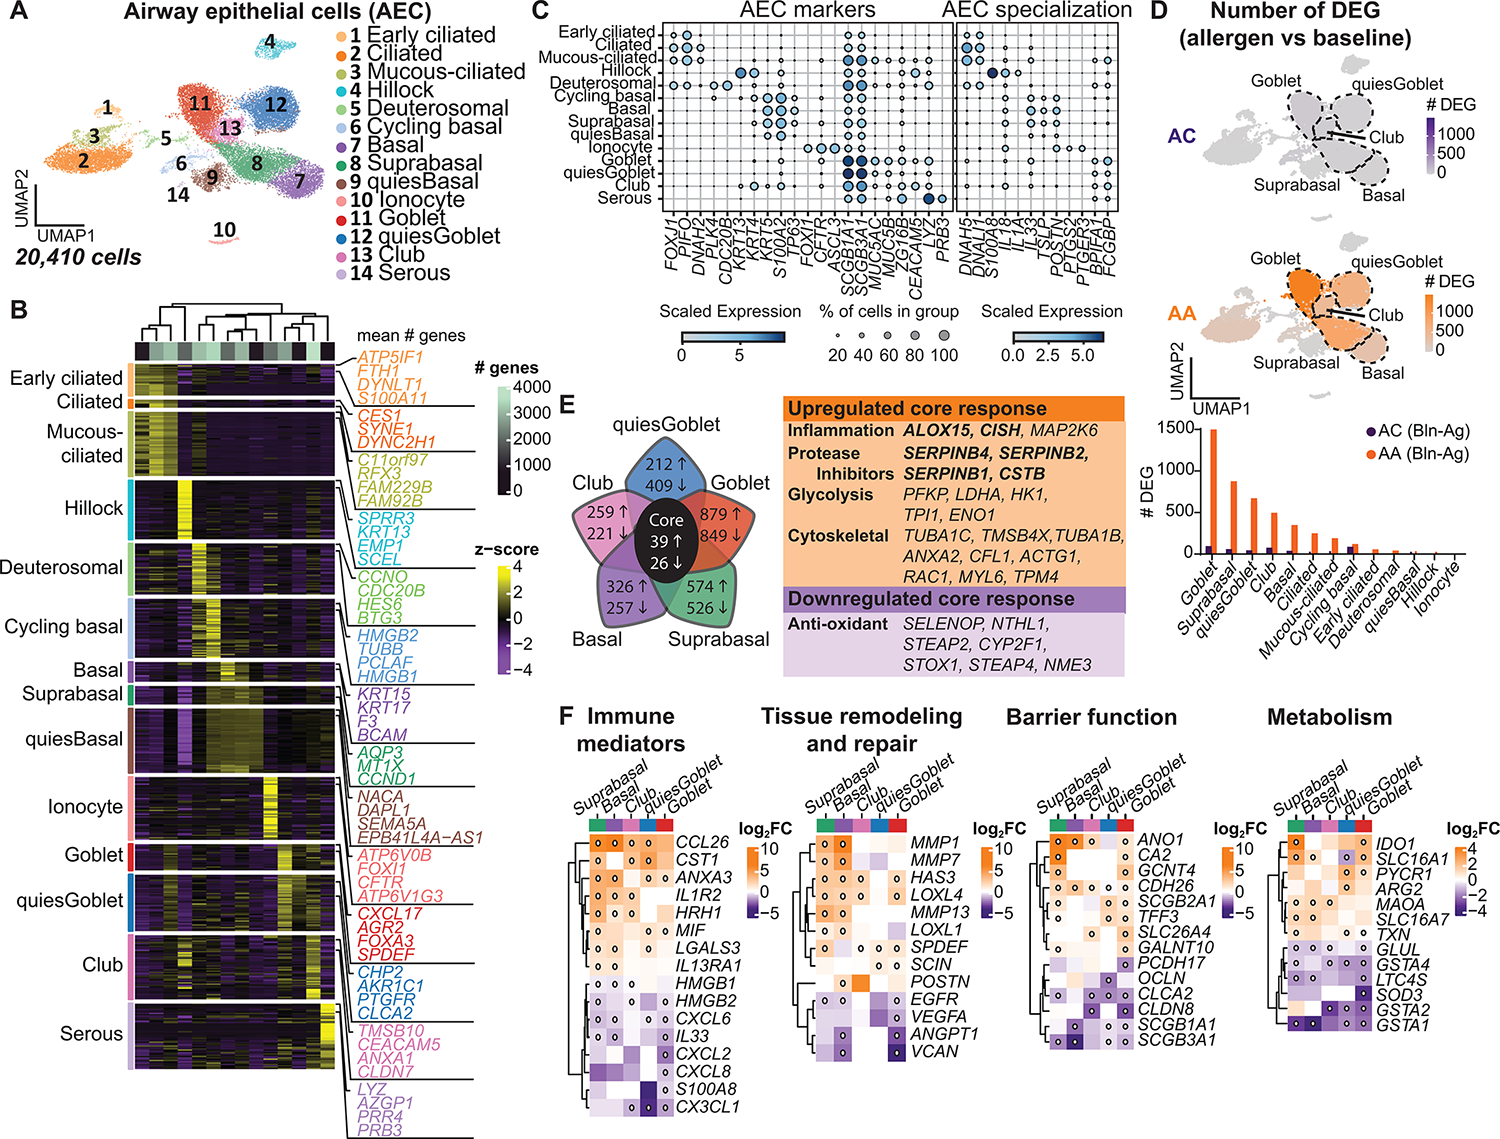
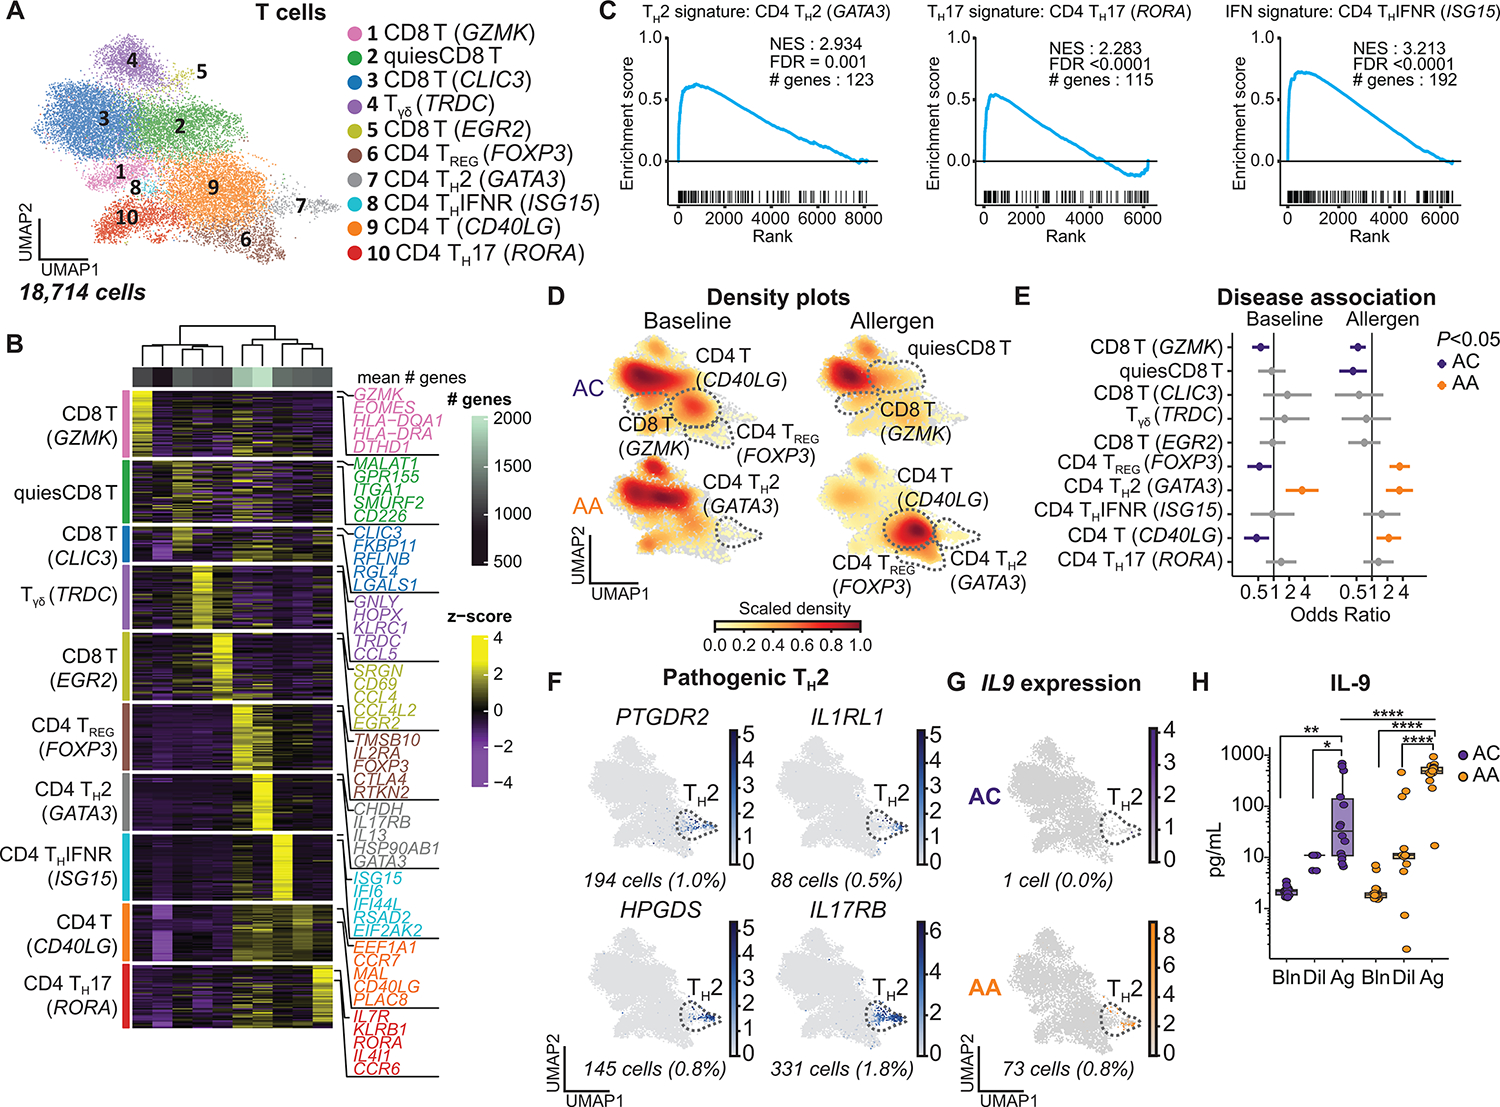
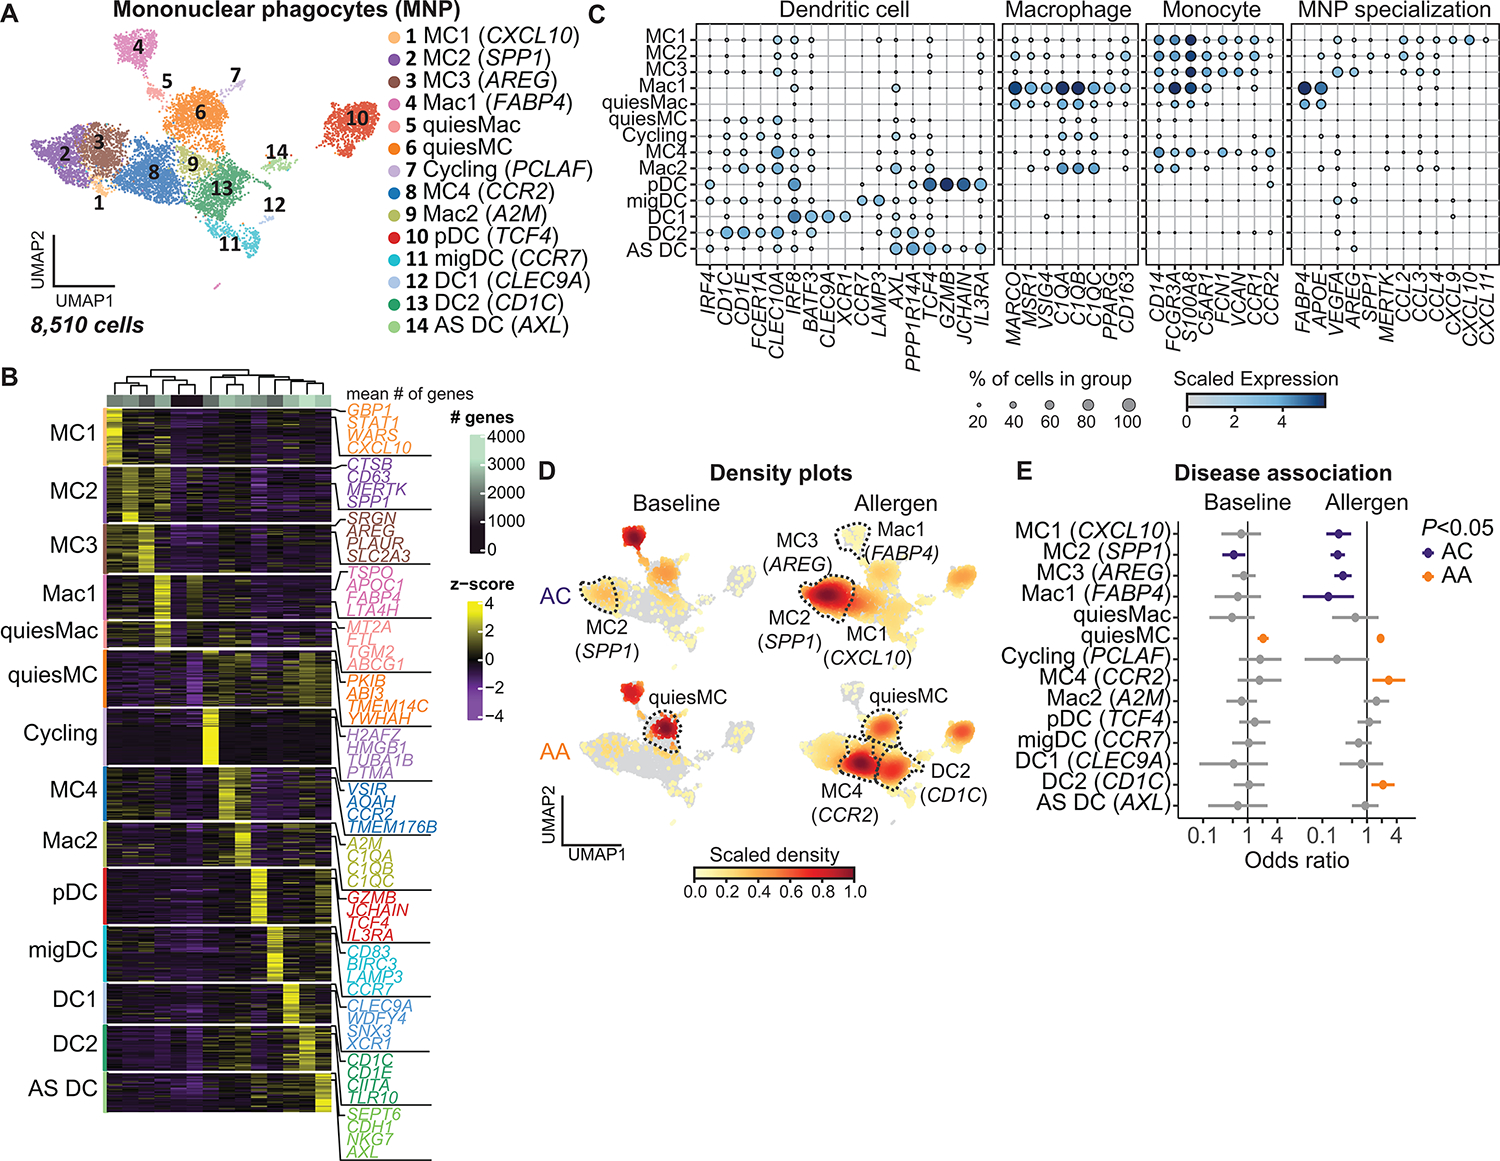
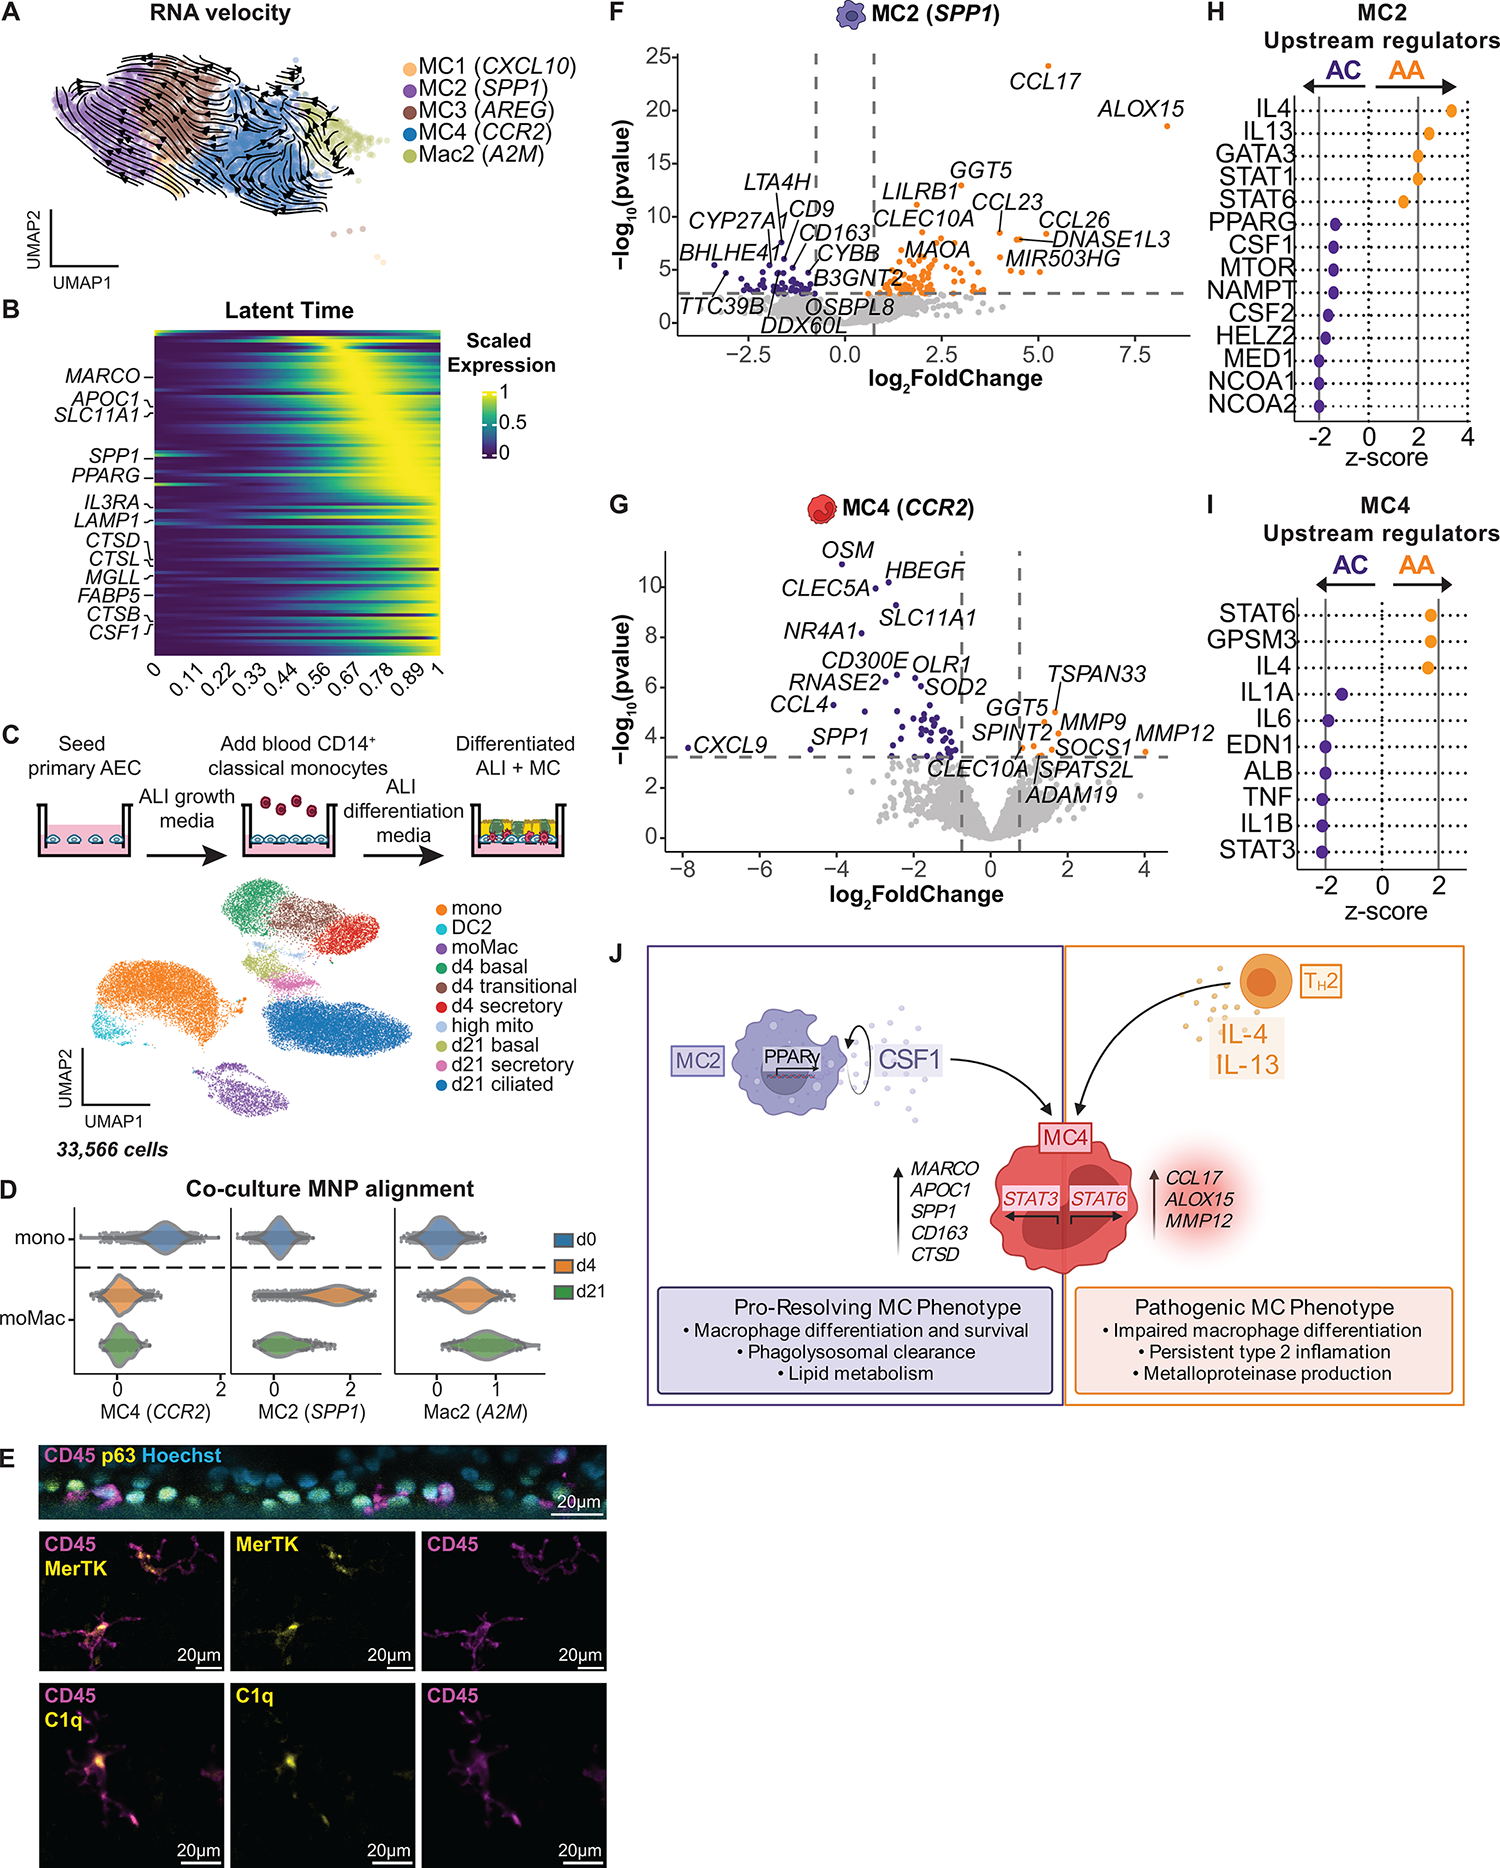
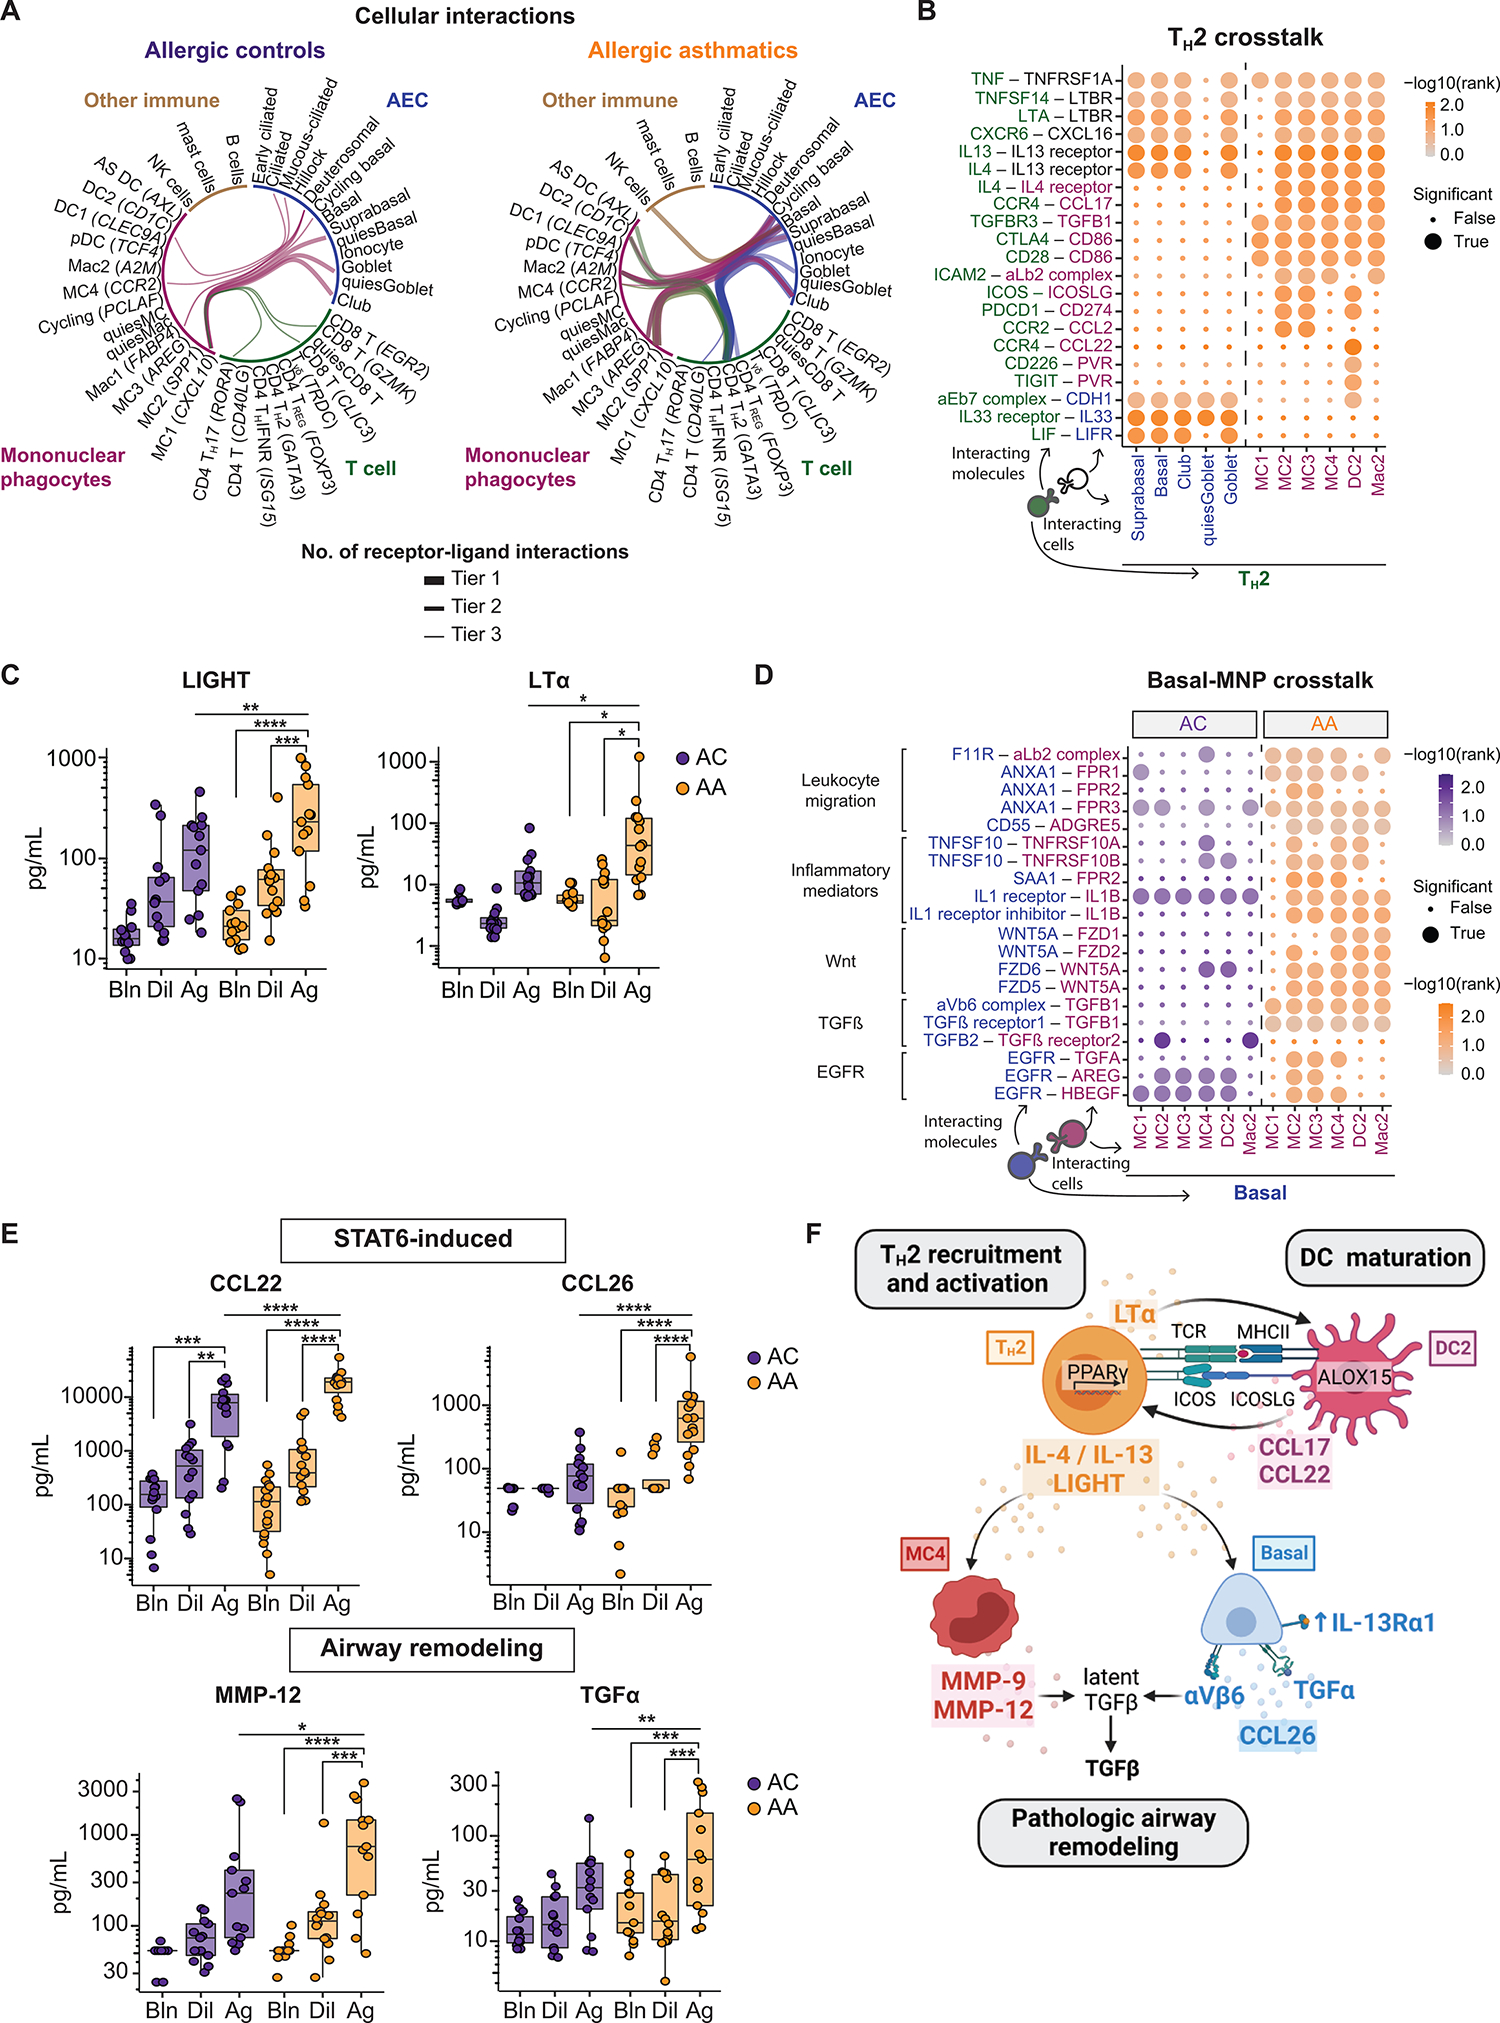
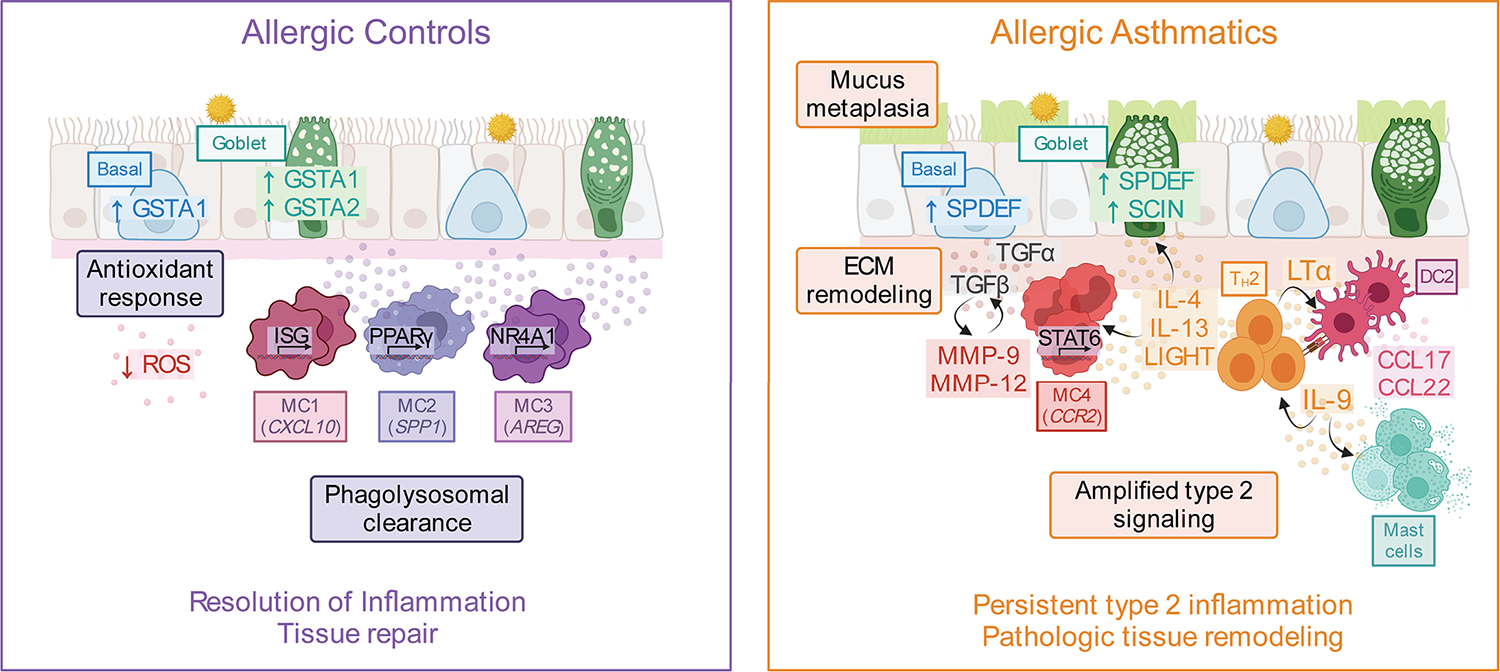
Asthma is a chronic disease most commonly associated with allergy and type 2 inflammation. However, the mechanisms that link airway inflammation to the structural changes that define asthma are incompletely understood. Using a human model of allergen-induced asthma exacerbation, we compared the lower airway mucosa in allergic asthmatics and allergic non-asthmatic controls using single-cell RNA sequencing. In response to allergen, the asthmatic airway epithelium was highly dynamic and up-regulated genes involved in matrix degradation, mucus metaplasia, and glycolysis while failing to induce injury-repair and antioxidant pathways observed in controls. IL9-expressing pathogenic TH2 cells were specific to asthmatic airways and were only observed after allergen challenge. Additionally, conventional type 2 dendritic cells (DC2 that express CD1C) and CCR2-expressing monocyte-derived cells (MCs) were uniquely enriched in asthmatics after allergen, with up-regulation of genes that sustain type 2 inflammation and promote pathologic airway remodeling. In contrast, allergic controls were enriched for macrophage-like MCs that up-regulated tissue repair programs after allergen challenge, suggesting that these populations may protect against asthmatic airway remodeling. Cellular interaction analyses revealed a TH2-mononuclear phagocyte-basal cell interactome unique to asthmatics. These pathogenic cellular circuits were characterized by type 2 programming of immune and structural cells and additional pathways that may sustain and amplify type 2 signals, including TNF family signaling, altered cellular metabolism, failure to engage antioxidant responses, and loss of growth factor signaling. Our findings therefore suggest that pathogenic effector circuits and the absence of proresolution programs drive structural airway disease in response to type 2 inflammation.


Conflict of interest statement

Competing interests: L.P.H. reports grants from Boehringer Ingelheim and has received personal consulting fees from Boehringer Ingelheim, Pliant Therapeutics, Biogen Idec, and Bioclinica. R.J.X. is a cofounder of Celsius Therapeutics and Jnana Therapeutics, a director at MoonLake Immunotherapeutics, and a scientific advisory board member at Nestle. B.D.M. receives research funding from and served as a consultant for Sanofi and Regeneron. The other authors declare that they have no competing interests.

Figures

Fig. 1.
Fig. 1.. A human model of allergen-induced asthma exacerbation using SAC.
(A) Characteristics of AC and AA participants. (B) Design of the bronchoscopic SAC procedure. BAL and endobronchial brush samples were obtained at baseline (from the lingula) and 24 hours after administration of diluent to the right upper lobe (RUL) and allergen to the right middle lobe (RML). Representative images of RML airway segments from one AC participant (top row) and one AA participant (bottom row) at baseline (left) and after SAC (right). In the AA participant, the allergen-challenged segmental airway is narrowed, and mucus is present after SAC. (C) Representative images of cytospin preparations from BAL from one AA participant and quantification of BAL eosinophils in nonallergic healthy controls (HCs; n = 5), ACs (n = 20), and AAs (n = 22). Black arrows indicate eosinophils; white arrows indicate lymphocytes. (D) Representative flow cytometry of endobronchial brush samples at baseline (Bln; top row) and after allergen challenge (Ag; bottom row) from one AA participant. Epithelial cells were identified as CD326+CD45. After gating on CD45+ cells, CD19+ B cells and CD4+ T cells were identified, as were CD19CD4HLA-DR+ antigen-presenting cells. (E) scRNA-seq was performed on endobronchial brushing samples (n = 21) collected from segmental airways, and downstream analysis was performed to identify differences between ACs (n = 4) and AAs (n = 4). In (C), boxes represent the median (line) and IQR, with whiskers extending to the remainder of the distribution no more than 1.5× IQR, with dots representing individual samples. P values were generated using a mixed-effects model with Šidák correction to adjust for multiple comparisons. ***P < 0.001 and ****P < 0.0001.
Fig. 2.
Fig. 2.. Allergen-induced immune cell enrichment in the airway mucosa.
(A) UMAP embedding of 52,152 high-quality single cells color-coded by predicted cell lineage. NK, natural killer. (B) Heatmap showing the top discriminative gene sets for each cell lineage compared with every other lineage. Color scales denote the normalized gene expression (mean zero, unit variance) for each cluster and the mean number of genes per cluster (top bar). (C) Dot plot showing the percentage and expression level of marker genes defining each cell lineage, with the size of the dot representing the percentage of cells within each lineage expressing each marker and the color intensity indicating the scaled expression level. (D) UMAP embedding of cell density displaying the proportion of each cell lineage at baseline (left) and after allergen challenge (right) compared with every other cell lineage, faceted by disease group (ACs: top, AAs: bottom). (E) OR of disease association by cell lineage at baseline and after allergen challenge. Color-coding denotes significant associations with ACs (OR < 1, purple) or AAs (OR > 1, gold). (F) Contribution of each cell lineage defined in (B), shown as percentage (%) of total sample at baseline (Bln) and after allergen challenge (Ag). In (E), dots and whiskers represent OR with 95% confidence interval, calculated using a mixed-effects association logistic regression model (P < 0.05 corrected for multiple comparisons using the Tukey method). In (F), boxes represent the median (line) and IQR, with whiskers extending to the remainder of the distribution no more than 1.5× IQR and dots representing individual samples. P values generated using a mixed-effects model with Šidák correction to adjust for multiple comparisons. *P < 0.05 and **P < 0.01.
Fig. 3.
Fig. 3.. Dynamic transcriptional response in basal and secretory epithelial cells after allergen challenge.
(A) UMAP embedding derived from subclustering of 20,410 AECs. (B) Heatmap showing the top discriminative gene sets for each cluster compared with every other AEC cluster. Color scales denote the normalized gene expression (mean zero, unit variance) for each cluster and the mean number of genes per cluster (top bar). (C) Dot plot depicting gene expression levels and percentage of cells expressing genes across AECs. (D) UMAP plots with color intensity (top) indicating the number of DEGs induced by SAC in ACs and AAs compared with baseline. The number of DEGs induced by SAC, quantified by cluster for AAs and ACs (bottom). (E) Venn diagram depicting the top five AEC clusters with the most DEGs after SAC, with the number of genes up-regulated (up arrow) or down-regulated (down arrow) in AAs compared with ACs using an interaction term for disease state and experimental condition. The core transcriptional response is denoted in the table (right). Bolded genes are induced by IL-13. (F) Heatmap of selected DEGs. Color scale indicates FC differences between AAs and ACs after SAC. White dot indicates FDR < 0.1. (D) DEG based on FDR < 0.1 and log2FC > 0.5 using the Wald test on pseudo-bulk count matrix. (E and F) DEGs based on FDR < 0.1 and log2FC > 0.5 using a likelihood ratio test on pseudo-bulk count matrix.
Fig. 4.
Fig. 4.. IL9-expressing pathogenic TH2 cells specific to asthmatic airways.
(A) UMAP embedding derived from subclustering of 18,714 T cells. (B) Heatmap showing the top discriminative gene sets for each cluster, compared with every other T cell cluster and the mean number of genes per cluster (top bar). (C) GSEA of CD4 TH2, TH17, and THIFNR clusters comparing the marker genes for these clusters with published T cell gene sets from Seumois et al. (33) (data file S7). (D) UMAP embedding of cell density displaying the proportion of each T cell subset at baseline (left) and after allergen challenge (right) compared with every other T cell subset, faceted by disease group (ACs: top, AAs: bottom). (E) OR of disease association by cluster at baseline and after allergen challenge. (F) Feature plots of pathogenic TH2 genes using pseudo-coloring to indicate gene expression. (G) Feature plot of IL9 expression using pseudo-coloring to indicate gene expression, faceted by group. (H) BAL concentration of IL-9 (ACs, n =14; AAs, n = 18). In (E), dots and whiskers represent OR with 95% confidence interval, calculated using a mixed-effects association logistic regression model (P < 0.05 corrected for multiple comparisons using the Tukey method). In (F) and (G), cell number and percentages (%) represent gene expression across all T cell subsets. Scaled gene expression in log(CPM). In (H), boxes represent the median (line) and IQR, with whiskers extending to the remainder of the distribution no more than 1.5× IQR. P values were generated using a mixed-effects model with Šidák correction to adjust for multiple comparisons. *P < 0.05, **P < 0.01, and ****P < 0.0001.
Fig. 5.
Fig. 5.. Distinct MNP profiles in asthmatics and ACs.
(A) UMAP embedding derived from subclustering of 8510 MNPs. (B) Heatmap showing the top discriminative gene sets for each cluster compared with every other MNP cluster and the mean number of genes per cluster (top bar). (C) Dot plot depicting gene expression levels and percentage of cells expressing genes across MNP clusters. (D) UMAP embedding of cell density displaying the proportion of each MNP subset at baseline (left) and after allergen challenge (right) compared with every other MNP subset, faceted by disease group (ACs: top, AAs: bottom). (E) OR of disease association by cluster at baseline and after allergen challenge. In (E), dots and whiskers represent OR with 95% confidence interval, calculated using a mixed-effects association logistic regression model (P < 0.05 corrected for multiple comparisons using the Tukey method).
Fig. 6.
Fig. 6.. A pathogenic transcriptional program in airway MCs in asthmatics after SAC.
(A) RNAvelocities of a subset of MNP clusters visualized as streamlines projected on UMAP embedding. (B) Heatmap of gene expression pattern for the top 100 lineage driver genes correlated along the inferred differentiation trajectory. (C) Coculture model for blood CD14+ monocytes and AECs at ALI. UMAP embedding derived from clustering of 33,566 cells consisting of baseline blood CD14+ monocytes and cocultured cells collected at day 4 (d4) and day 21 (d21). Mono, monocyte; moMac, monocyte-derived Mac; mito, mitochondrial. (D) Alignment of blood CD14+ monocytes (day 0; d0) and moMacs from d4 and d21 coculture, using gene set scores (x axis) of airway MNP subclusters (Fig. 5A). (E) Immunofluorescence staining with orthogonal reconstruction at d21 of coculture demonstrates CD45+ immune cells (magenta) integrated into the p63+ basal cell layer (yellow) with Hoechst nuclear counterstain (cyan). CD45+ immune cells (magenta) exhibit prominent cytoplasmic projections and expression of MERTK and C1q (yellow). (F and G) Volcano plots representing DEGs in MC2 (F) and MC4 (G), comparing ACs (purple) with AAs (gold) after SAC. Vertical dotted lines represent cutoff of |log2FC| = 0.5, and horizontal dotted lines represent FDR cutoff = 0.1. (H and I) Predicted upstream regulators of MC2 (H) and MC4 (I) based on DEGs identified in (F) and (G) (ACs: purple, AAs: gold). Vertical solid lines represent z-score cutoff of |2|. (J) Summary figure of MC maturation sequence. (F and G) DEGs based on FDR < 0.1 and log2FC > 0.5 using the Wald test on pseudo-bulk count matrix.
Fig. 7.
Fig. 7.. A pathogenic cellular interactome in asthmatic airways after allergen challenge.
(A) Top 25 cell-cell pairs with the most unique receptor-ligand interactions in ACs and AAs, restricted to interactions between distinct cell lineages. Tiers represent the number of interactions (tier 1: ≥50, tier 2: 40 to 49, tier 3: 30 to 39). (B) Dot plots showing predicted interactions between TH2-AECs and TH2-MNPs after SAC in AAs. (C) BAL concentration of LIGHT (TNFSF14; ACs: n = 13, AAs: n = 14) and LTα (ACs: n = 13, AAs: n = 16). (D) Dot plots showing predicted interactions between AEC-MNP after SAC in AAs and ACs. (E) BAL concentration of CCL22, CCL26, MMP-12, and TGFα (ACs: n = 13, AAs: n = 14). (F) Summary figure of a pathogenic TH2–MNP–basal cell interactome in allergic asthma. In (B) and (D), dot size indicates significance (true: empirical P < 0.001), and color intensity indicates specificity of interaction to disease group [−log10(rank)]. In (C) and (F), boxes represent the median (line) and IQR, with whiskers extending to the remainder of the distribution no more than 1.5× IQR. In (C) and (F), P values were generated using a mixed-effects model with Šidák correction to adjust for multiple comparisons. *P < 0.05, **P < 0.01, ***P < 0.001, and ****P < 0.0001.
Fig. 8.
Fig. 8.. Transcriptional reprogramming in response to type 2 airway inflammation as a defining feature of allergic asthma.
After SAC, the airway landscape in allergic non-asthmatic controls was characterized by enrichment of macrophage-like MCs expressing growth factors associated with tissue repair as well as up-regulation of antioxidant genes in basal and goblet cells. In contrast, asthmatics failed to up-regulate these pathways and instead had enrichment of DC2 (CD1C), pro-inflammatory MC4 (CCR2), and IL9-expressing pathogenic TH2 cells. Type 2 cytokines and other mediators, including TNF family members, produced by TH2 cells may promote a pathogenic MC4 phenotype in asthmatics by interrupting the default MC maturation sequence to proresolution macrophages. These TH2 mediators may also override the epithelial injury response observed in ACs and instead promote ECM degradation, subepithelial fibrosis, and mucus metaplasia in asthma. Figure was created using biorender.com.

Comment in

References

    1. Centers for Disease Control and Prevention, CDC Virtal Signs—Asthma in the US (Centers for Disease Control and Prevention, 2011); www.cdc.gov/vitalsigns/asthma/index.html.
    1. Holgate ST, Wenzel S, Postma DS, Weiss ST, Renz H, Sly PD, Asthma. Nat. Rev. Dis. Primers 1, 15025 (2015). - PMC - PubMed
    1. Hammad H, Lambrecht BN, The basic immunology of asthma. Cell 184, 1469–1485 (2021). - PubMed
    1. Hewitt RJ, Lloyd CM, Regulation of immune responses by the airway epithelial cell landscape. Nat. Rev. Immunol. 21, 347–362 (2021). - PMC - PubMed
    1. Hammad H, Plantinga M, Deswarte K, Pouliot P, Willart MAM, Kool M, Muskens F, Lambrecht BN, Inflammatory dendritic cells—not basophils—are necessary and sufficient for induction of Th2 immunity to inhaled house dust mite allergen. J. Exp. Med. 207, 2097–2111 (2010). - PMC - PubMed

Publication types