. 2023 May 5;9(18):eade5111.
doi: 10.1126/sciadv.ade5111. Epub 2023 May 5.

Hypoxia-inducible factor orchestrates adenosine metabolism to promote liver cancer development

Affiliations

Hypoxia-inducible factor orchestrates adenosine metabolism to promote liver cancer development

Jacinth Wing-Sum Cheu et al. Sci Adv. .

Abstract

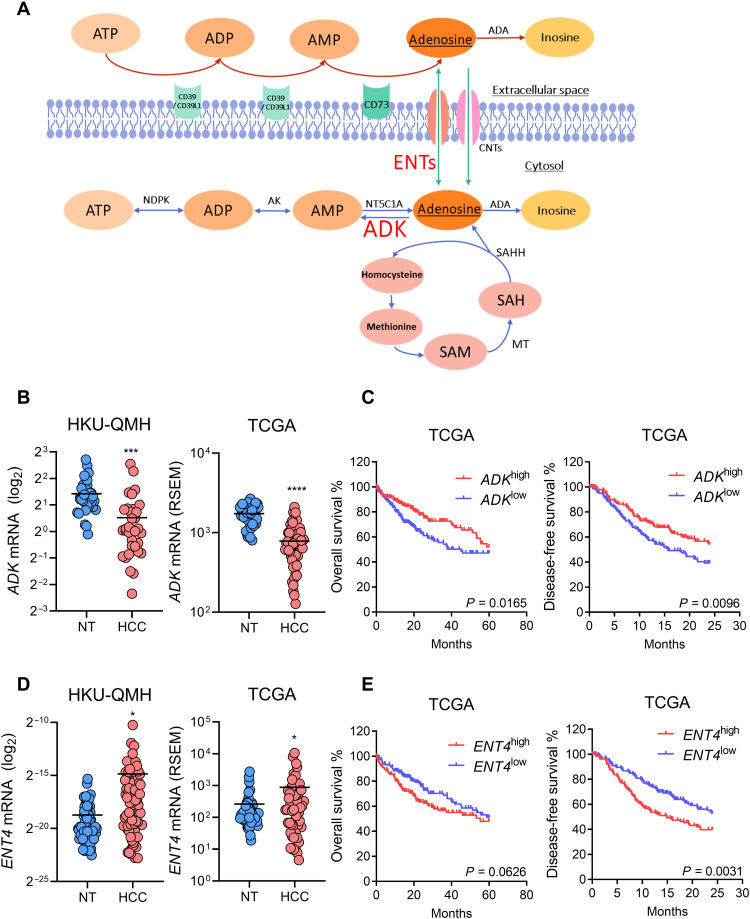
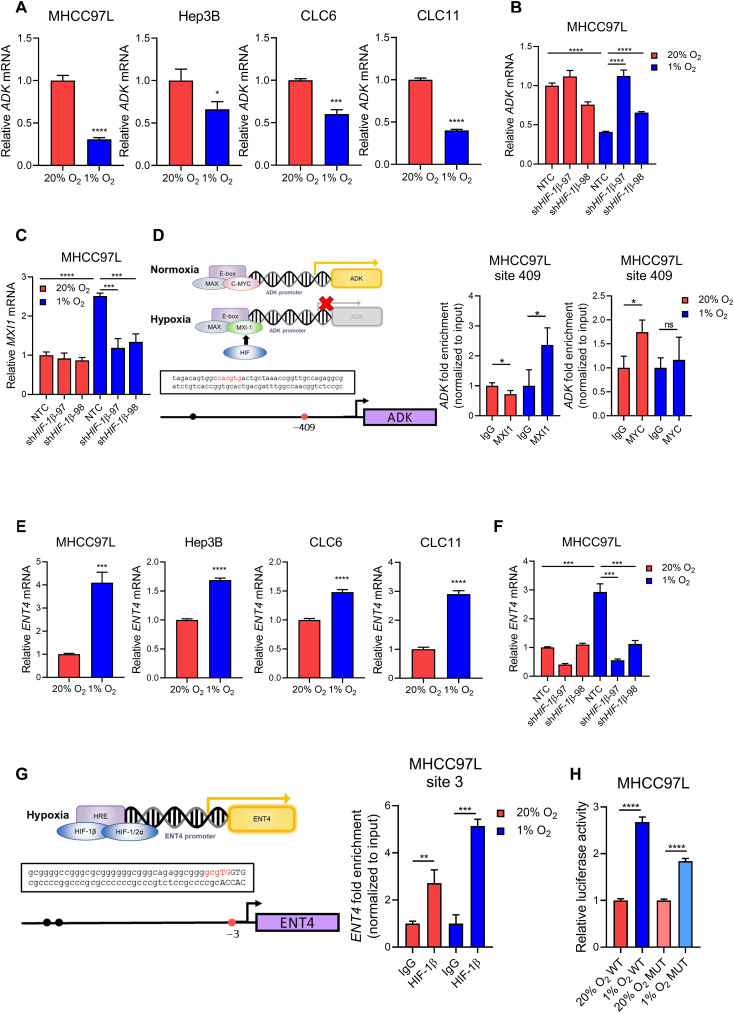
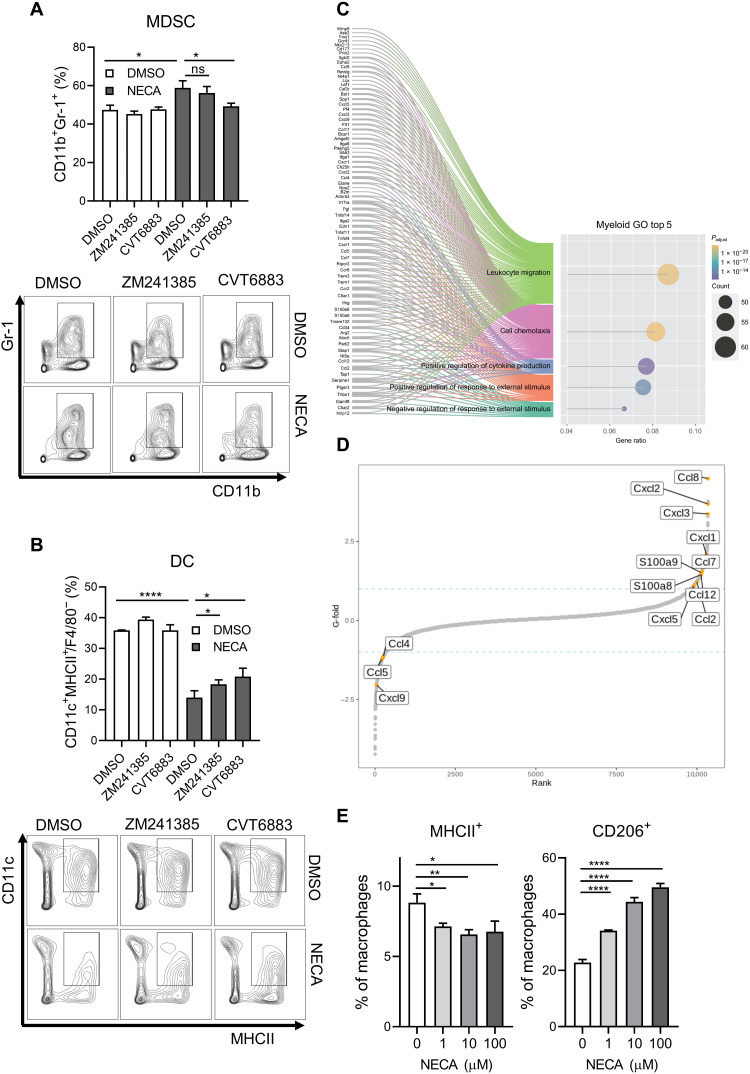
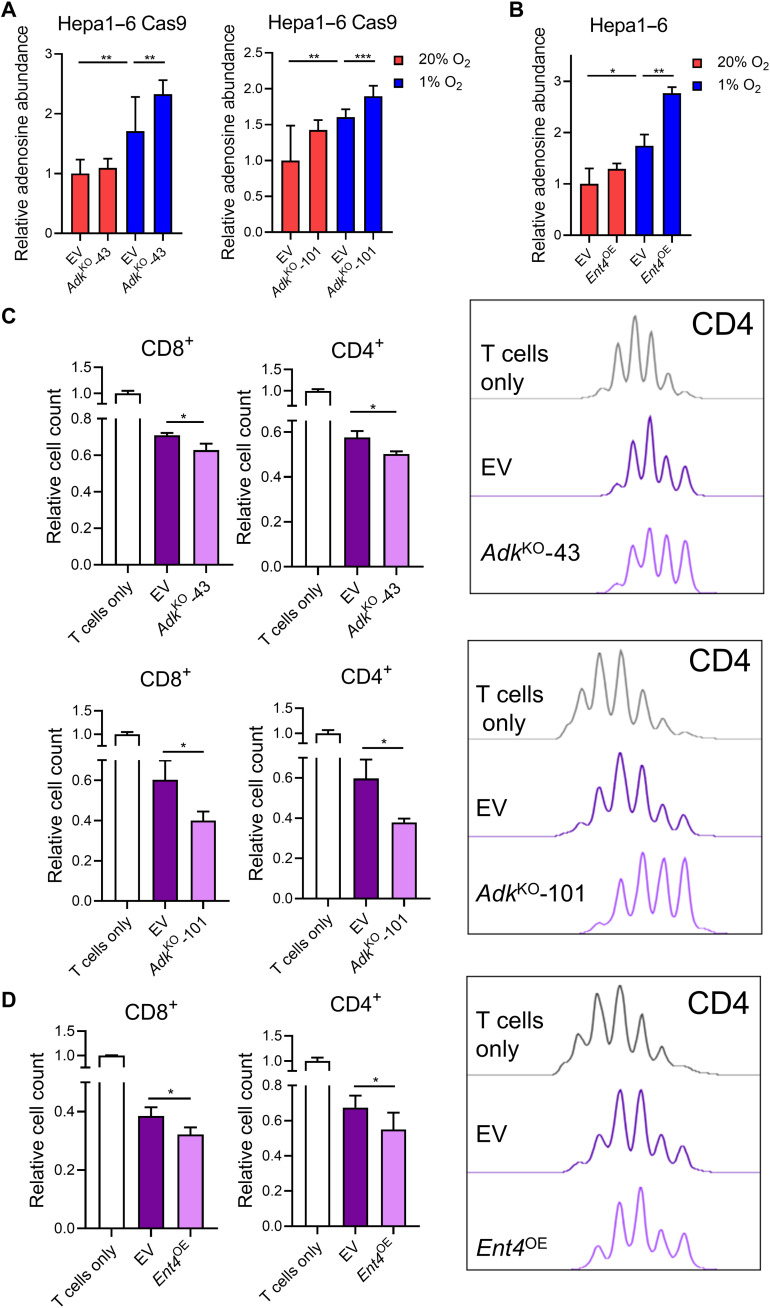
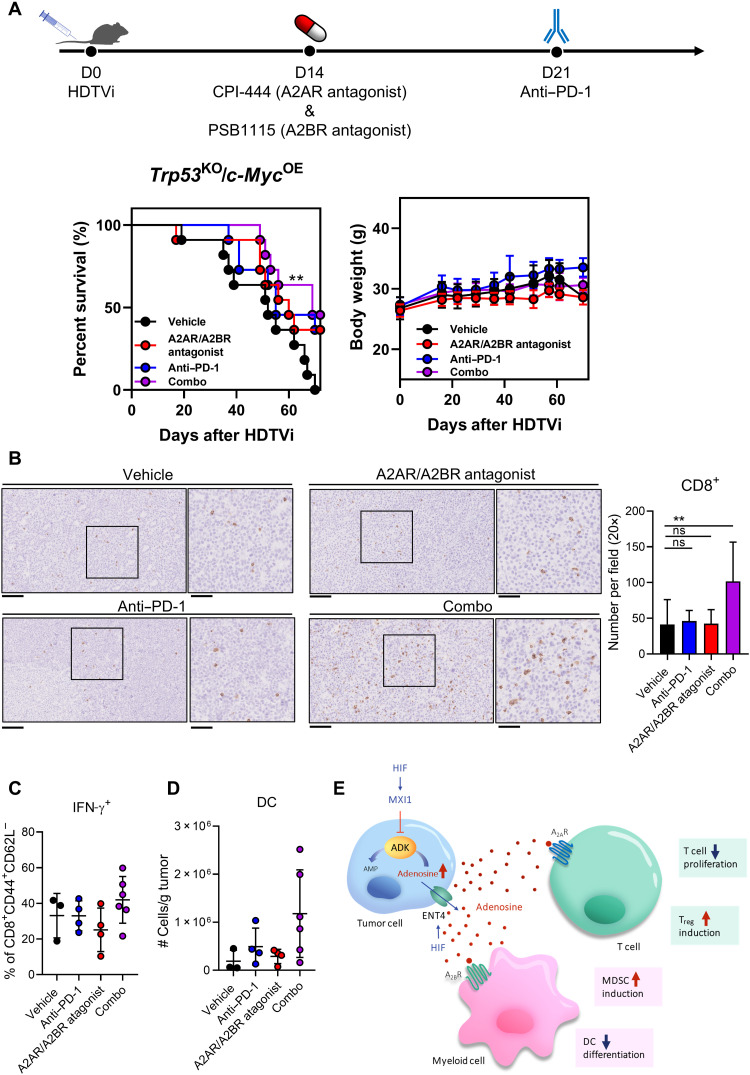
Hypoxia-induced adenosine creates an immunosuppressive tumor microenvironment (TME) and dampens the efficacy of immune checkpoint inhibitors (ICIs). We found that hypoxia-inducible factor 1 (HIF-1) orchestrates adenosine efflux through two steps in hepatocellular carcinoma (HCC). First, HIF-1 activates transcriptional repressor MXI1, which inhibits adenosine kinase (ADK), resulting in the failure of adenosine phosphorylation to adenosine monophosphate. This leads to adenosine accumulation in hypoxic cancer cells. Second, HIF-1 transcriptionally activates equilibrative nucleoside transporter 4, pumping adenosine into the interstitial space of HCC, elevating extracellular adenosine levels. Multiple in vitro assays demonstrated the immunosuppressive role of adenosine on T cells and myeloid cells. Knockout of ADK in vivo skewed intratumoral immune cells to protumorigenic and promoted tumor progression. Therapeutically, combination treatment of adenosine receptor antagonists and anti-PD-1 prolonged survival of HCC-bearing mice. We illustrated the dual role of hypoxia in establishing an adenosine-mediated immunosuppressive TME and offered a potential therapeutic approach that synergizes with ICIs in HCC.


Figures

Fig. 1.
Fig. 1.. ENT4 is overexpressed, while ADK is suppressed in human HCC.
(A) Schematic representation of pathways involved in adenosine metabolism. (B) ADK mRNA expression in paired HCC and NT (nontumorous) tissues from (left) University of Hong Kong-Queen Mary Hospital (HKU-QMH) patients and (right) The Cancer Genome Atlas (TCGA) database. (C) Kaplan-Meier curves showing the association of ADK mRNA expression with (left) overall and (right) disease-free survival in patients with HCC from TCGA database. (D) ENT4 mRNA expression in paired HCC and NT tissues from (left) HKU-QMH patients and (right) TCGA database. (E) Kaplan-Meier curves showing the association of ENT4 mRNA expression with (left) overall and (right) disease-free survival in patients with HCC from TCGA database. *P < 0.05, ***P < 0.001, and ****P < 0.0001 versus NT. (B) and (D) Student’s t test. (C) and (E) Kaplan-Meier followed by log-rank test. RSEM, RNA sequencing expression estimation by expectation maximization.
Fig. 2.
Fig. 2.. ADK and ENT4 are regulated by hypoxia via HIF.
(A) ADK mRNA expression in human HCC cell lines including MHCC97L, Hep3B, CLC6, and CLC11 exposed to 20 and 1% O2 for 24 hours. (B) ADK mRNA expression in MHCC97L-shHIF1β cells compared to NTC (nontargeting control) exposed to 20 and 1% O2 for 24 hours. (C) MXI1 mRNA expression in MHCC97L-shHIF-1β cells compared to NTC exposed to 20 and 1% O2 for 24 hours. (D) Left: Schematic representation of competition of MYC and MXI1 for E-box element binding under hypoxia and the binding site at ADK promoter region. Right: ChIP assay on MHCC97L cells exposed to 20 and 1% O2 using MXI1, MYC, and immunoglobulin G (IgG) antibodies. (E) ENT4 mRNA expression in human HCC cell lines including MHCC97L, Hep3B, CLC6, and CLC11 exposed to 20 and 1% O2 for 24 hours. (F) ENT4 mRNA expression in MHCC97L-shHIF-1β cells compared to NTC exposed to 20 and 1% O2 for 24 hours. (G) Left: Putative HRE at the promoter region of ENT4. Right: ChIP assay in MHCC97L cells exposed to 20 and 1% O2 using HIF-1β and IgG antibodies. (H) Relative luciferase activity in MHCC97L cells transfected with luciferase plasmids containing WT HRE or MUT HRE. (A) to (C), (E), and (F) mRNA expression was determined by quantitative real-time polymerase chain reaction (qRT-PCR), and values were normalized to 20% O2 or 20% O2 NTC. (D) and (G) Fold of enrichment was normalized to the corresponding IgG controls. (H) Relative luciferase activity was normalized to 20% O2 WT or 20% O2 MUT, respectively. Error bars indicate means ± SD. *P < 0.05, **P < 0.01, ***P < 0.001, and ****P < 0.0001 versus 20% O2, 20% O2 NTC, IgG, 20% O2 WT, or 20% O2 MUT as indicated. Student’s t test.
Fig. 3.
Fig. 3.. Adenosine promotes Treg differentiation and cell death while suppressing T cell proliferation and functions.
(A) CellTrace Violet (CTV) T cell proliferation assay on (left) CD8+ and (right) CD4+ T cells treated with indicated doses of NECA (adenosine stable analog) for 3 days with IL-2. (B) Percentages of (left) IFN-γ+ and (right) granzyme B+ CD8+ T cells treated with indicated doses of NECA for 3 days with IL-2. (C) Percentage of cell death of (left) CD8+ and (right) CD4+ T cells treated with indicated doses of NECA for 3 days with IL-2. (D) Splenic T cells were cultured with 100 μM NECA in the presence of vehicle [dimethyl sulfoxide (DMSO)], 100 nM A2AR antagonist (ZM241385), or 100 nM A2BR antagonist (CVT6883) for 3 days with IL-2. The percentage of Tregs (CD4+ CD25+FOXP3+) was determined by flow cytometry. (E to H) Bulk RNA sequencing was performed on NECA-treated T cells compared to vehicle (DMSO). (E) to (G) GSEA showed the enrichment of selected gene sets in NECA-treated T cells. (H) Fold change of selected genes as compared to vehicle. Error bars indicate means ± SD. *P < 0.05, **P < 0.01, ***P < 0.001, and ****P < 0.0001 versus 0 μM or DMSO as indicated. Student’s t test. ns, not significant.
Fig. 4.
Fig. 4.. Adenosine skews myeloid cells to immunosuppressive phenotypes.
(A and B) Bone marrow progenitor cells were cultured with 10 μM NECA in the presence of vehicle (DMSO), 100 nM A2AR antagonist (ZM241385), or 100 nM A2BR antagonist (CVT6883) for 5 days with IL-4 and GM-CSF. The percentages of (A) MDSC and (B) DC were determined by flow cytometry. (C and D) Bulk RNA sequencing was performed on NECA-treated bone marrow progenitor cells. (C) GO term enrichment analysis revealed the top five GO terms most enriched in NECA-treated bone marrow cells as compared to vehicle control. (D) Dot plot showed the fold change of a panel of chemokines as compared to vehicle. (E) Percentages of (left) MHCII+ and (right) CD206+ bone marrow–derived macrophages treated with indicated doses of NECA for 2 days with M-CSF. Error bars indicate means ± SD. *P < 0.05, **P < 0.01, and ****P < 0.0001 versus 0 μM or DMSO as indicated. Student’s t test.
Fig. 5.
Fig. 5.. ADK deficiency and ENT4 overexpression (OE) elevate extracellular adenosine level and suppress T cell proliferation.
(A and B) Conditioned media of (A) Hepa1–6 Cas9–AdkKO cells and (B) Hepa1–6–Ent4OE cells exposed to 20 and 1% O2 for 48 hours were harvested, and extracellular adenosine levels were determined by MS. (C and D) CTV T cell proliferation assay on (left) CD8+ and (right) CD4+ T cells cocultured with (C) Hepa1–6 Cas9–AdkKO cells or (D) Hepa1–6–Ent4OE cells for 3 days with IL-2. (A) and (B) Relative adenosine level was normalized to 20% O2 empty vector (EV). Error bars indicate means ± SD. *P < 0.05, **P < 0.01, and ***P < 0.001 versus EV or 20% O2 EV. Student’s t test.
Fig. 6.
Fig. 6.. ADK deficiency promotes HCC progression and creates an immunosuppressive TME.
(A) In vivo HCC tumors were induced via HDTVi of plasmids carrying Trp53KO/c-MycOE (EV) or Trp53KOAdkKO/c-MycOE (-43 and -101) in C57BL/6N mice. (Left) Liver mass and (right) representative picture of harvested livers with tumors. (B to F) Flow cytometry analysis was performed to determine tumor infiltration of immune cells. (B) Left: Quantification of CD8+ T cells. Right: Representative contour plots. (C) Percentage of effector T cells (CD8+CD44+CD62L) expressing multiple exhaustion markers. (D) Left: Quantification of CD4+ T cells. Right: Representative contour plots. (E) Quantification of (top) CD8+ and (bottom) CD4+ T cells in tumor by immunohistochemistry staining. (F) Left: Quantification of DCs. Right: Representative contour plots. Error bars indicate means ± SD. *P < 0.05, **P < 0.01, ***P < 0.001, and ****P < 0.0001 versus empty vector (EV). Student’s t test. Scale bar, 1 cm.
Fig. 7.
Fig. 7.. Adenosine receptors blockade synergizes with anti–PD-1 treatment.
(A) In vivo HCC tumors were induced via HDTVi of plasmids carrying Trp53KO/c-MycOE in C57BL/6N mice. (Left) Survival plot and (right) body weight of HCC-bearing mice treated with vehicle, adenosine receptor antagonists, anti–PD-1 monoclonal antibodies, or the combination of both. (B) Representative pictures (left) and quantification (right) of CD8+ T cells in tumor by immunohistochemistry staining. (C) Percentage of effector T cells (CD8+CD44+CD62L) expressing IFN-γ. (D) Quantification of DCs in tumor by flow cytometry. (E) Schematic summary of the role of HIF in promoting intracellular adenosine efflux and mediating immunosuppressive TME. Error bars indicate means ± SD. **P < 0.01 versus vehicle. (A) Kaplan-Meier followed by log-rank test. (B) Student’s t test. Original, 20× magnification (scale bars, 100 μm); Inset, 40× magnification (scale bars, 50 μm).

References

    1. H. Sung, J. Ferlay, R. L. Siegel, M. Laversanne, I. Soerjomataram, A. Jemal, F. Bray, Global cancer statistics 2020: GLOBOCAN estimates of incidence and mortality worldwide for 36 cancers in 185 countries. CA Cancer J. Clin. 71, 209–249 (2021). - PubMed
    1. J. M. Llovet, S. Ricci, V. Mazzaferro, P. Hilgard, E. Gane, J.-F. Blanc, A. C. De Oliveira, A. Santoro, J.-L. Raoul, A. Forner, M. Schwartz, C. Porta, S. Zeuzem, L. Bolondi, T. F. Greten, P. R. Galle, J.-F. Seitz, I. Borbath, D. Häussinger, T. Giannaris, M. Shan, M. Moscovici, D. Voliotis, J. Bruix; SHARP Investigators Study Group , Sorafenib in advanced hepatocellular carcinoma. N. Engl. J. Med. 359, 378–390 (2008). - PubMed
    1. M. Kudo, R. S. Finn, S. Qin, K.-H. Han, K. Ikeda, F. Piscaglia, A. Baron, J.-W. Park, G. Han, J. Jassem, J. F. Blanc, A. Vogel, D. Komov, T. R. J. Evans, C. Lopez, C. Dutcus, M. Guo, K. Saito, S. Kraljevic, T. Tamai, M. Ren, A.-L. Cheng, Lenvatinib versus sorafenib in first-line treatment of patients with unresectable hepatocellular carcinoma: A randomised phase 3 non-inferiority trial. Lancet 391, 1163–1173 (2018). - PubMed
    1. A. B. El-Khoueiry, B. Sangro, T. Yau, T. S. Crocenzi, M. Kudo, C. Hsu, T.-Y. Kim, S.-P. Choo, J. Trojan, T. H. Welling III, T. Meyer, Y.-K. Kang, W. Yeo, A. Chopra, J. Anderson, C. D. Cruz, L. Lang, J. Neely, H. Tang, H. B. Dastani, I. Melero, Nivolumab in patients with advanced hepatocellular carcinoma (CheckMate 040): An open-label, non-comparative, phase 1/2 dose escalation and expansion trial. Lancet 389, 2492–2502 (2017). - PMC - PubMed
    1. R. S. Finn, S. Qin, M. Ikeda, P. R. Galle, M. Ducreux, T.-Y. Kim, M. Kudo, V. Breder, P. Merle, A. O. Kaseb, D. Li, W. Verret, D.-Z. Xu, S. Hernandez, J. Liu, C. Huang, S. Mulla, Y. Wang, H. Y. Lim, A. X. Zhu, A.-L. Cheng; IMbrave150 Investigators , Atezolizumab plus bevacizumab in unresectable hepatocellular carcinoma. N. Engl. J. Med. 382, 1894–1905 (2020). - PubMed