. 2023 May 4;30(5):648-664.e8.
doi: 10.1016/j.stem.2023.04.005.

Osteoprogenitor-GMP crosstalk underpins solid tumor-induced systemic immunosuppression and persists after tumor removal

Affiliations

Osteoprogenitor-GMP crosstalk underpins solid tumor-induced systemic immunosuppression and persists after tumor removal

Xiaoxin Hao et al. Cell Stem Cell. .

Abstract

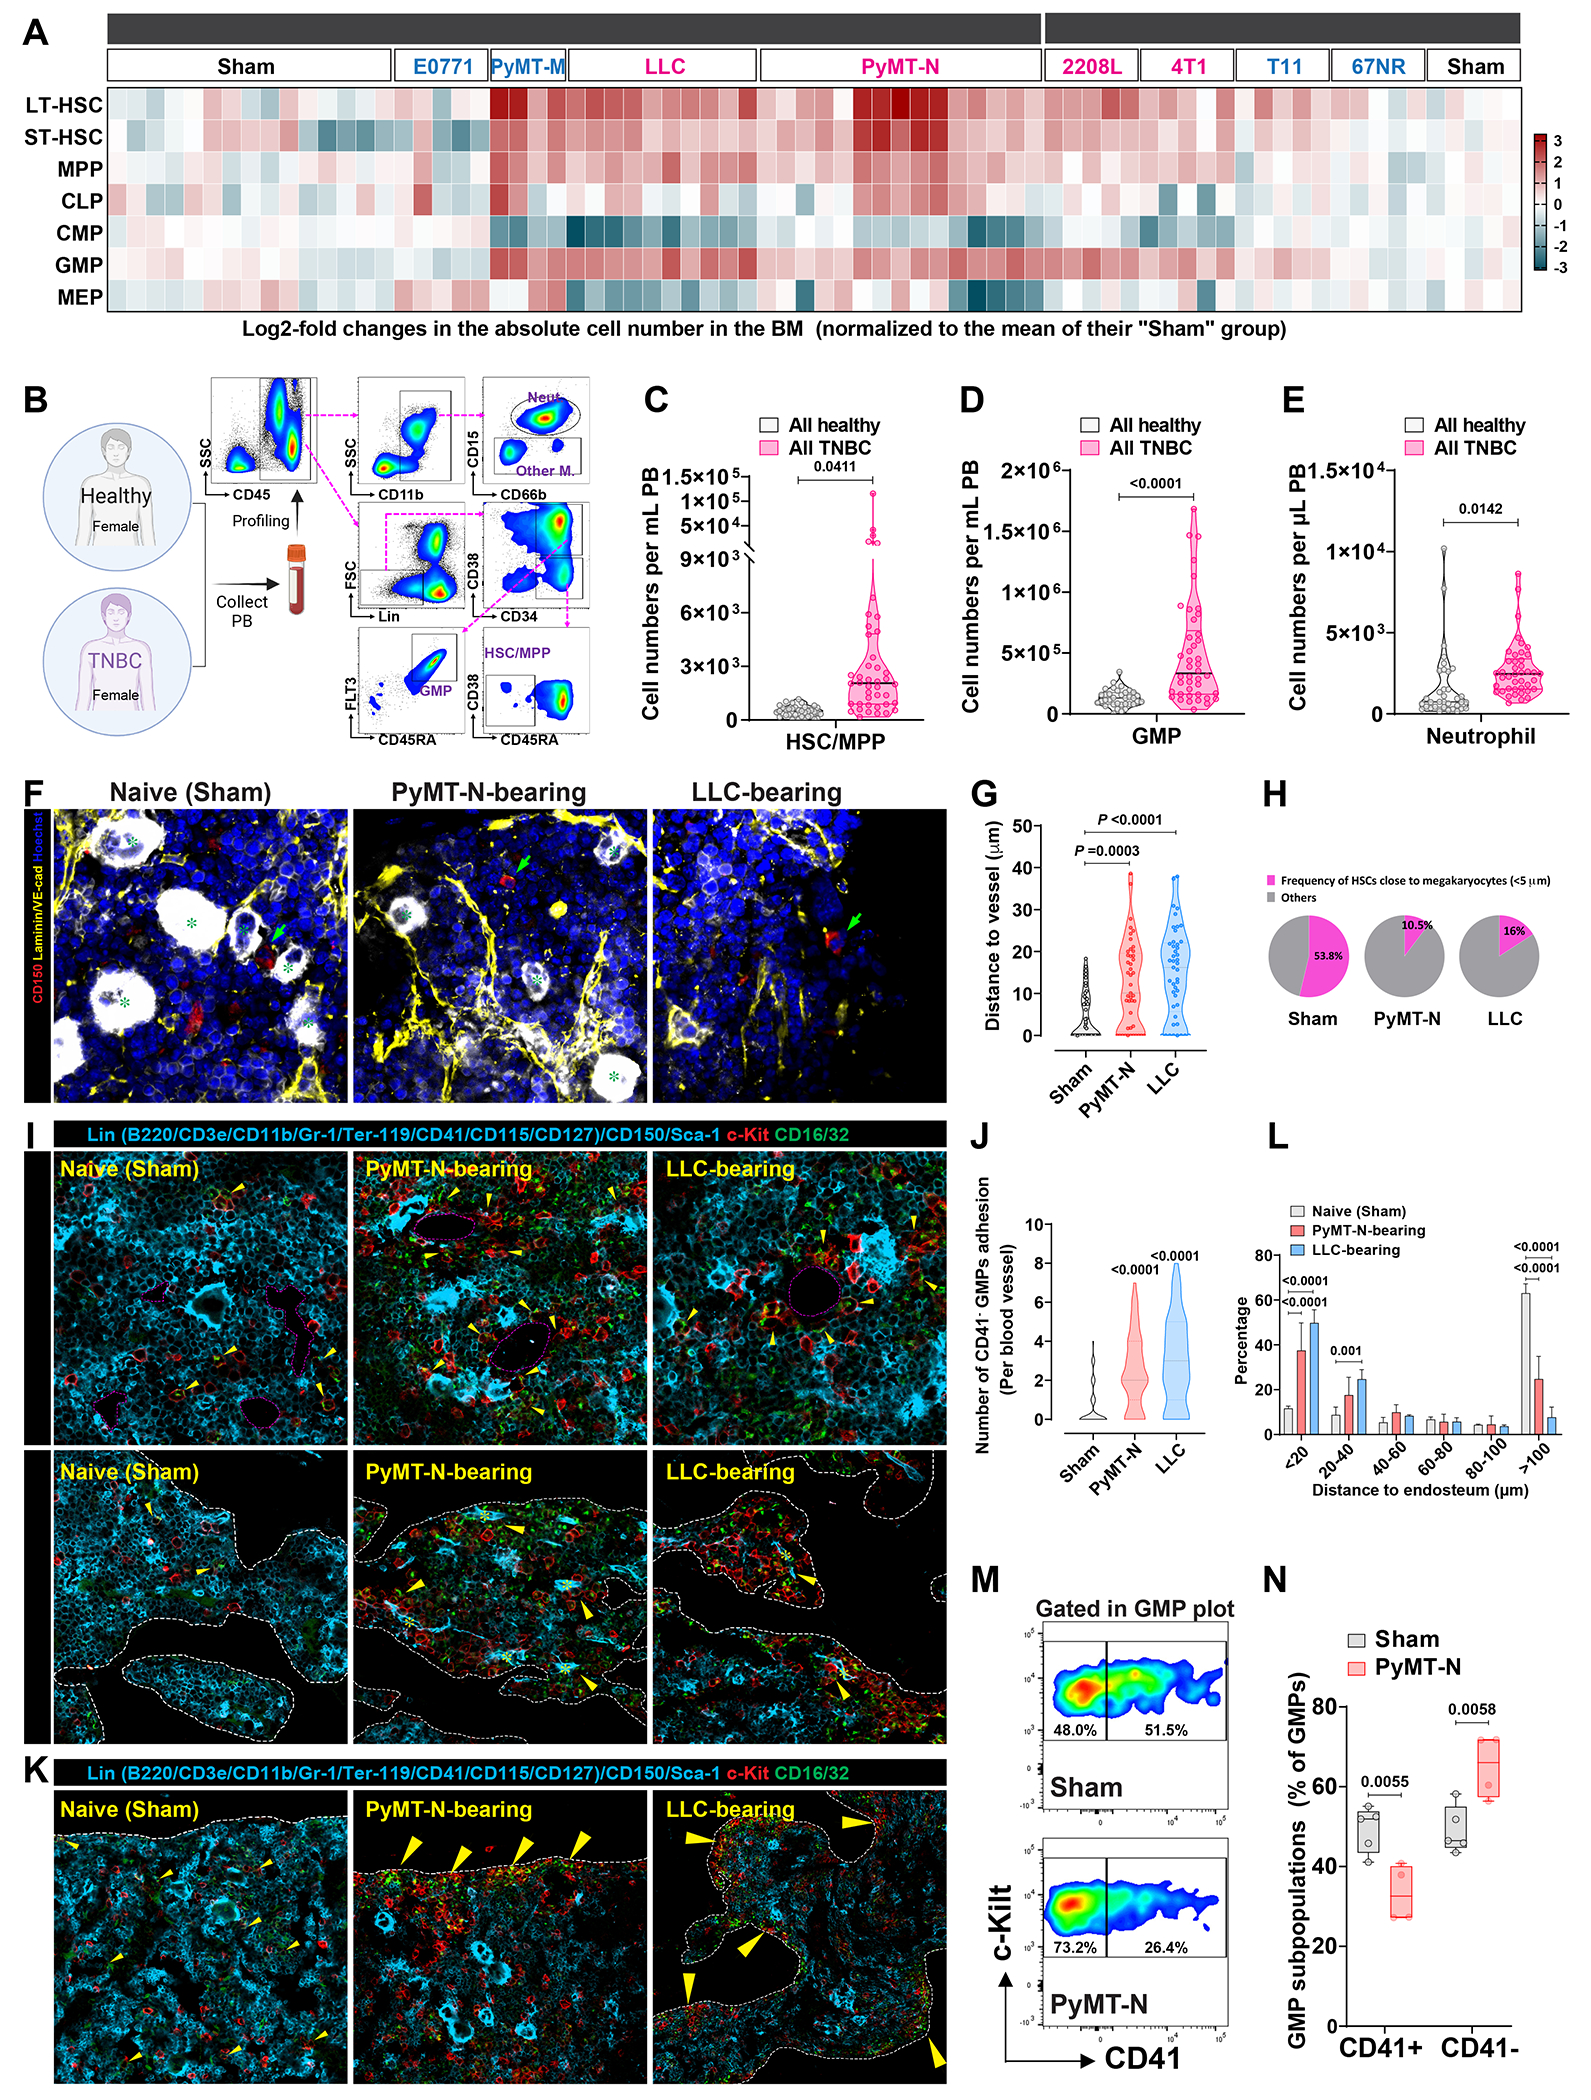
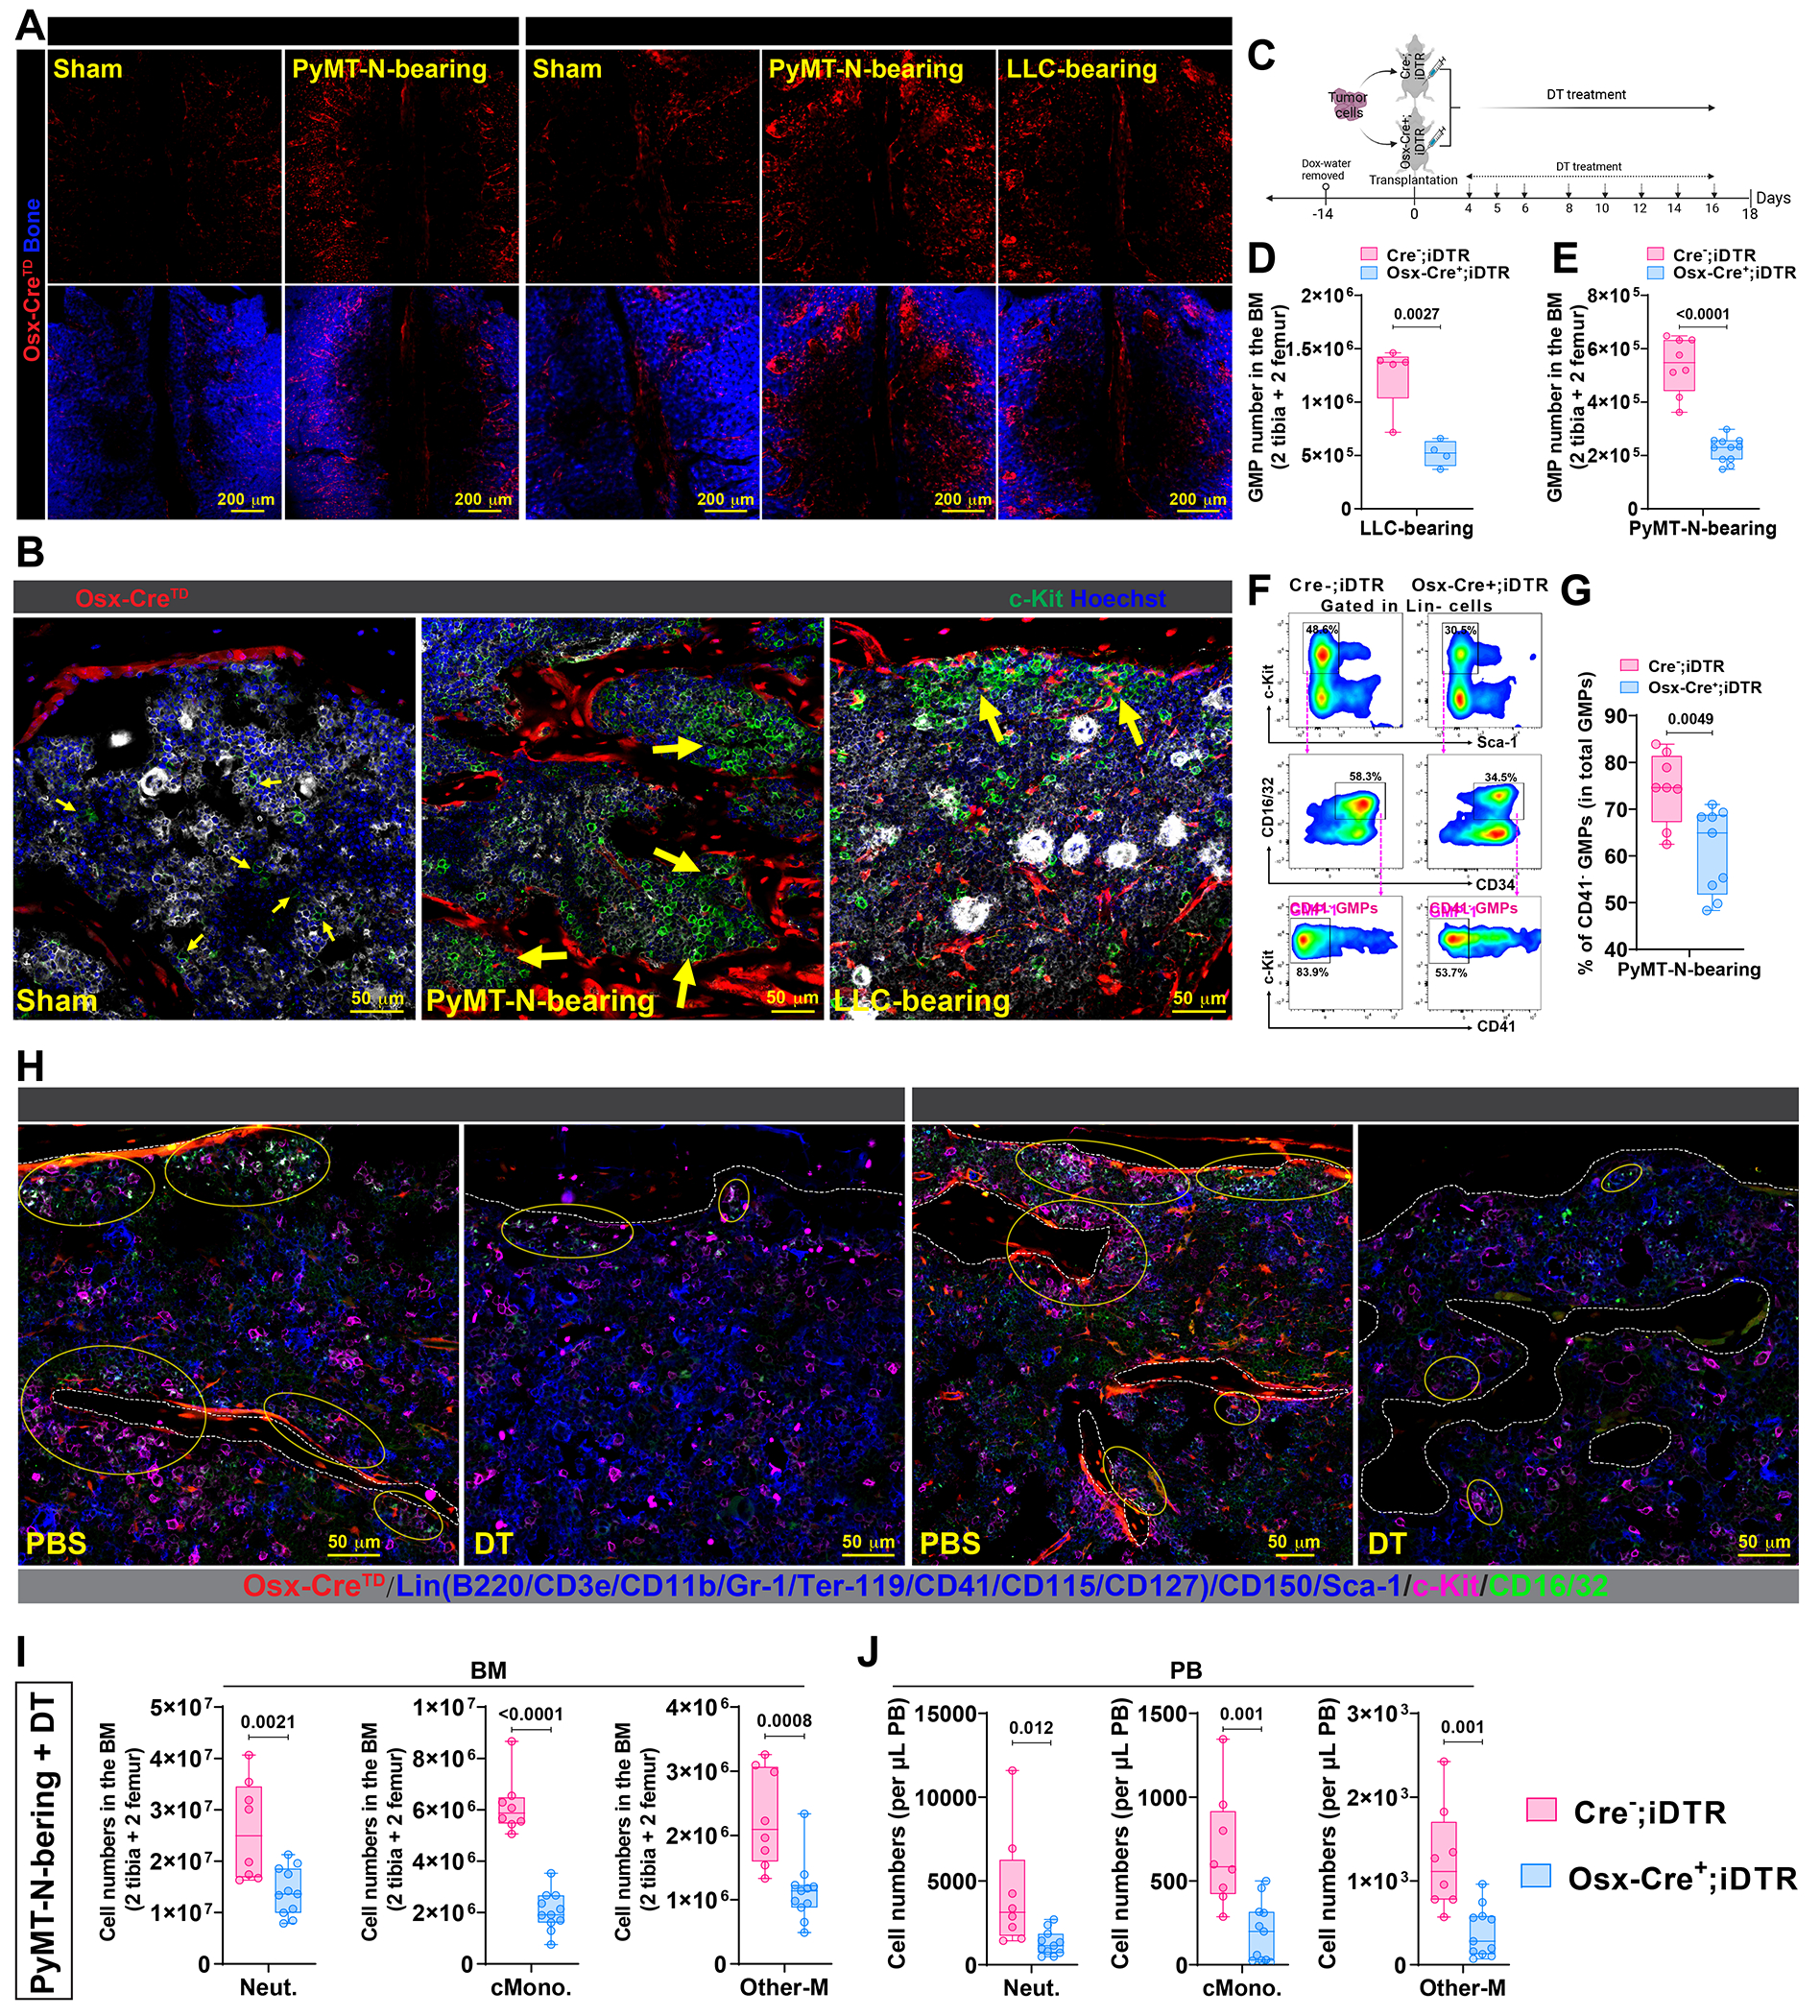
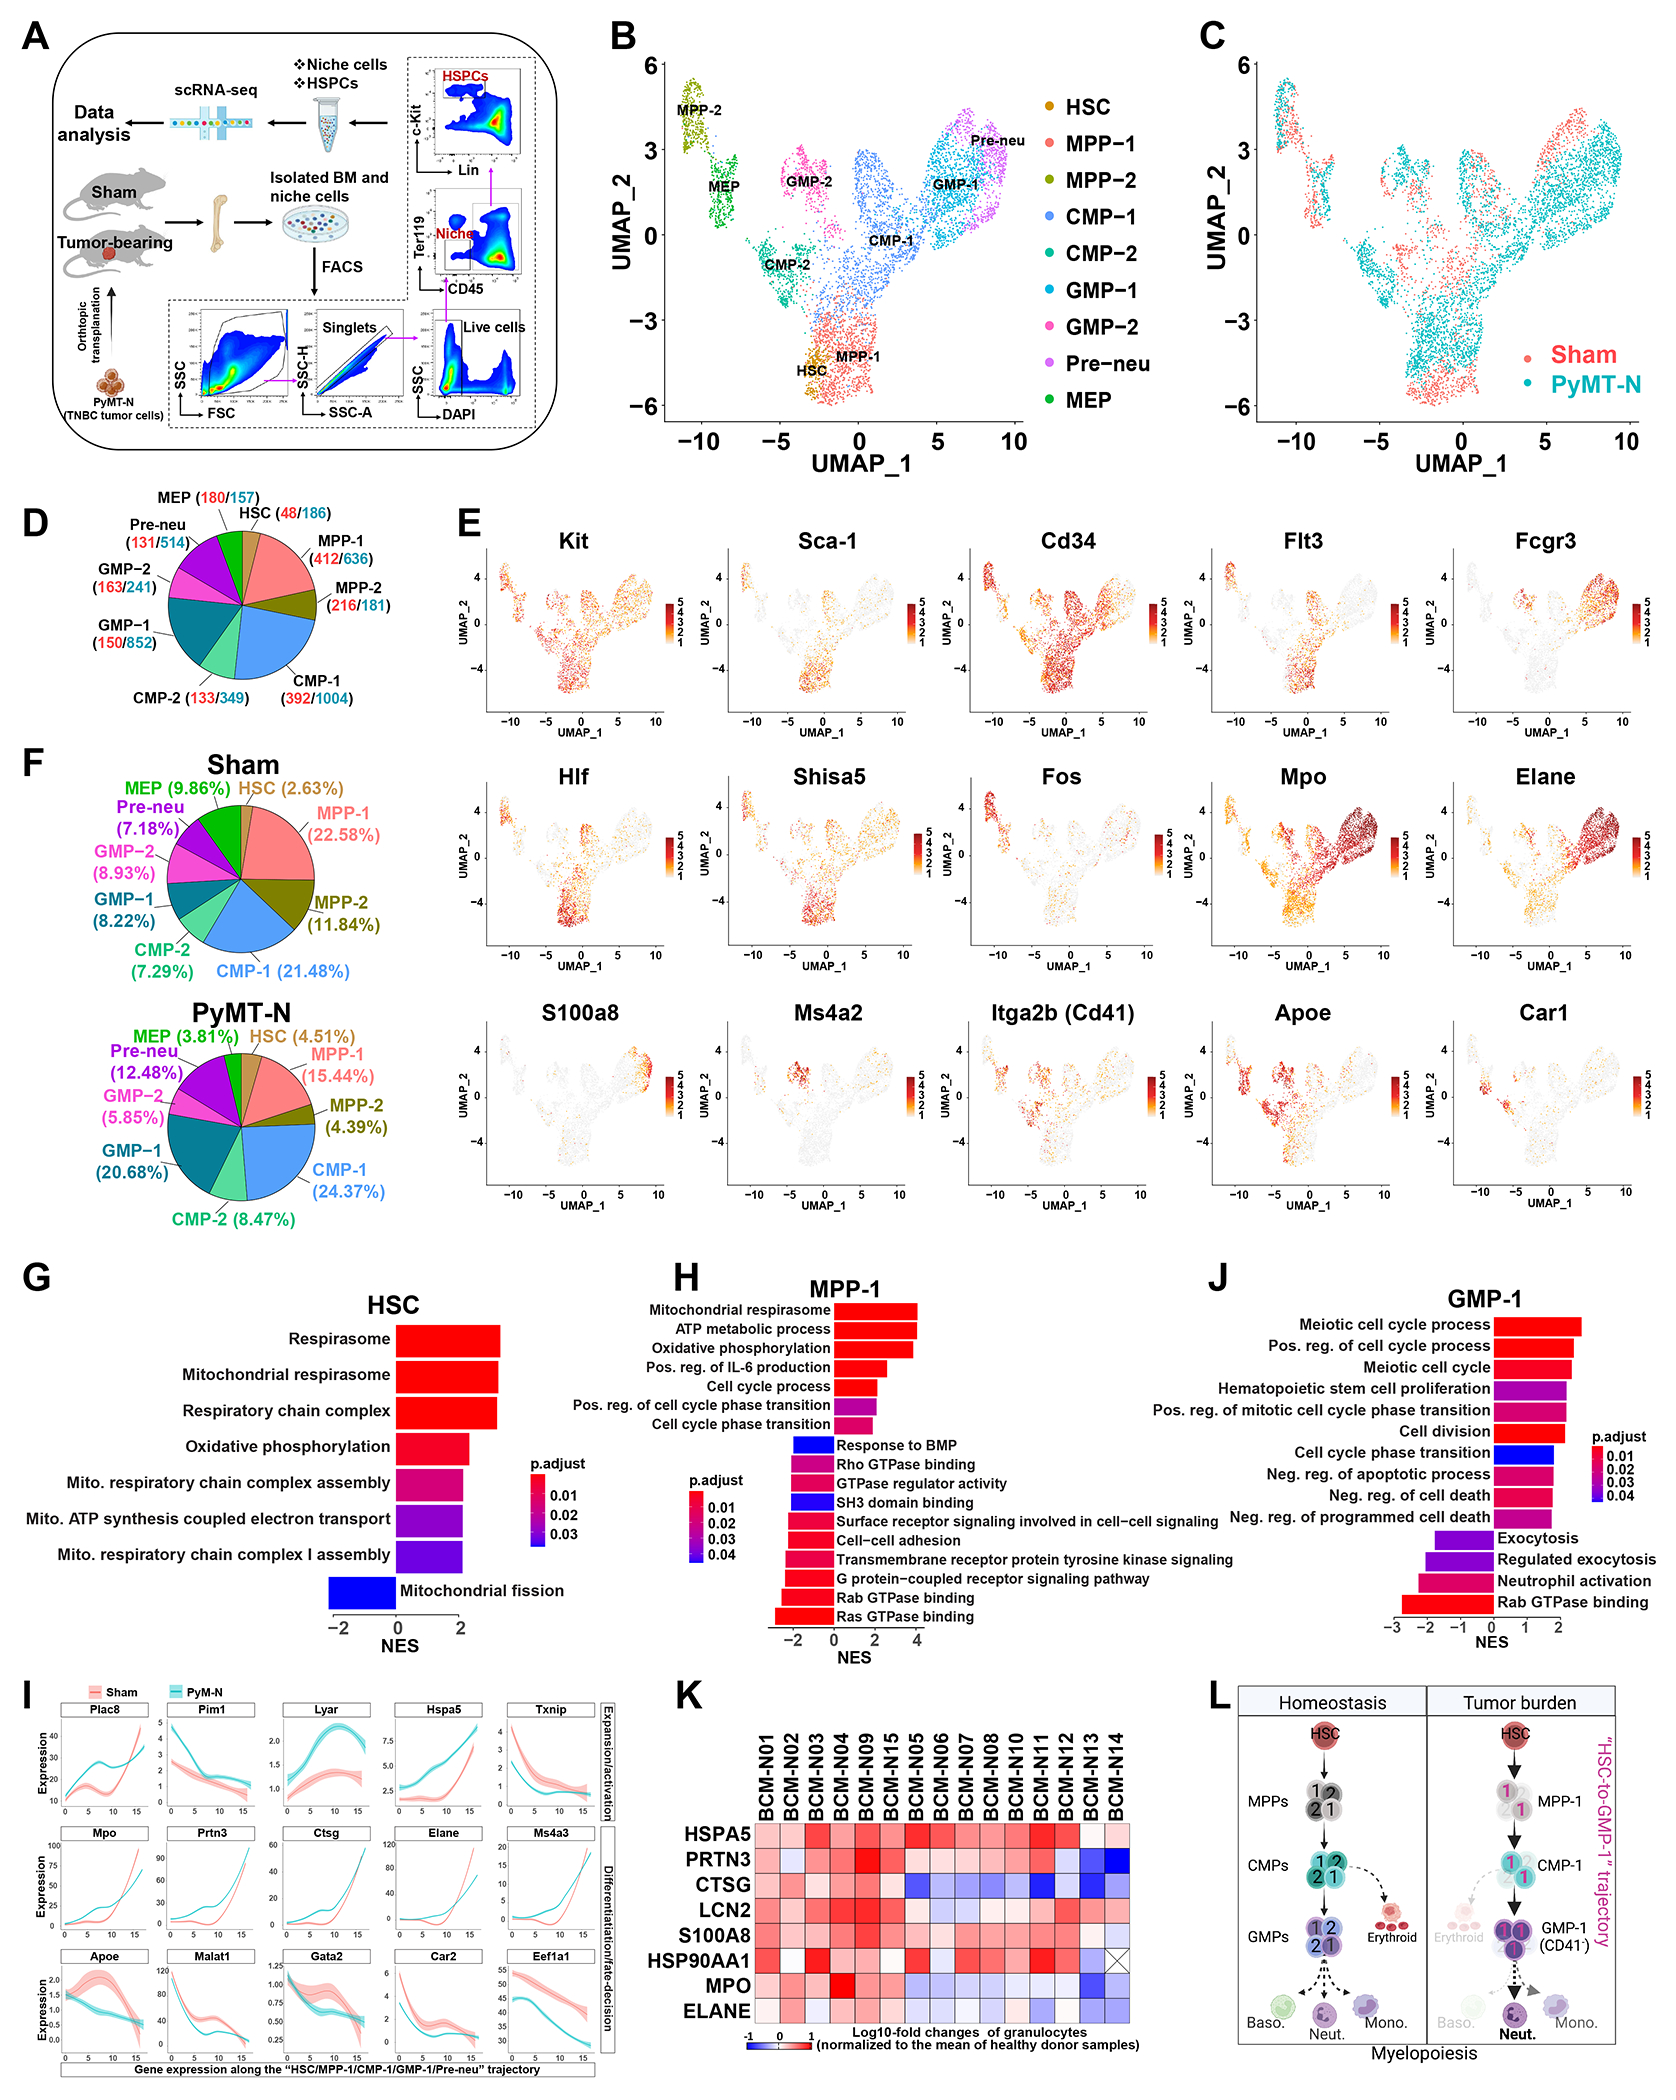
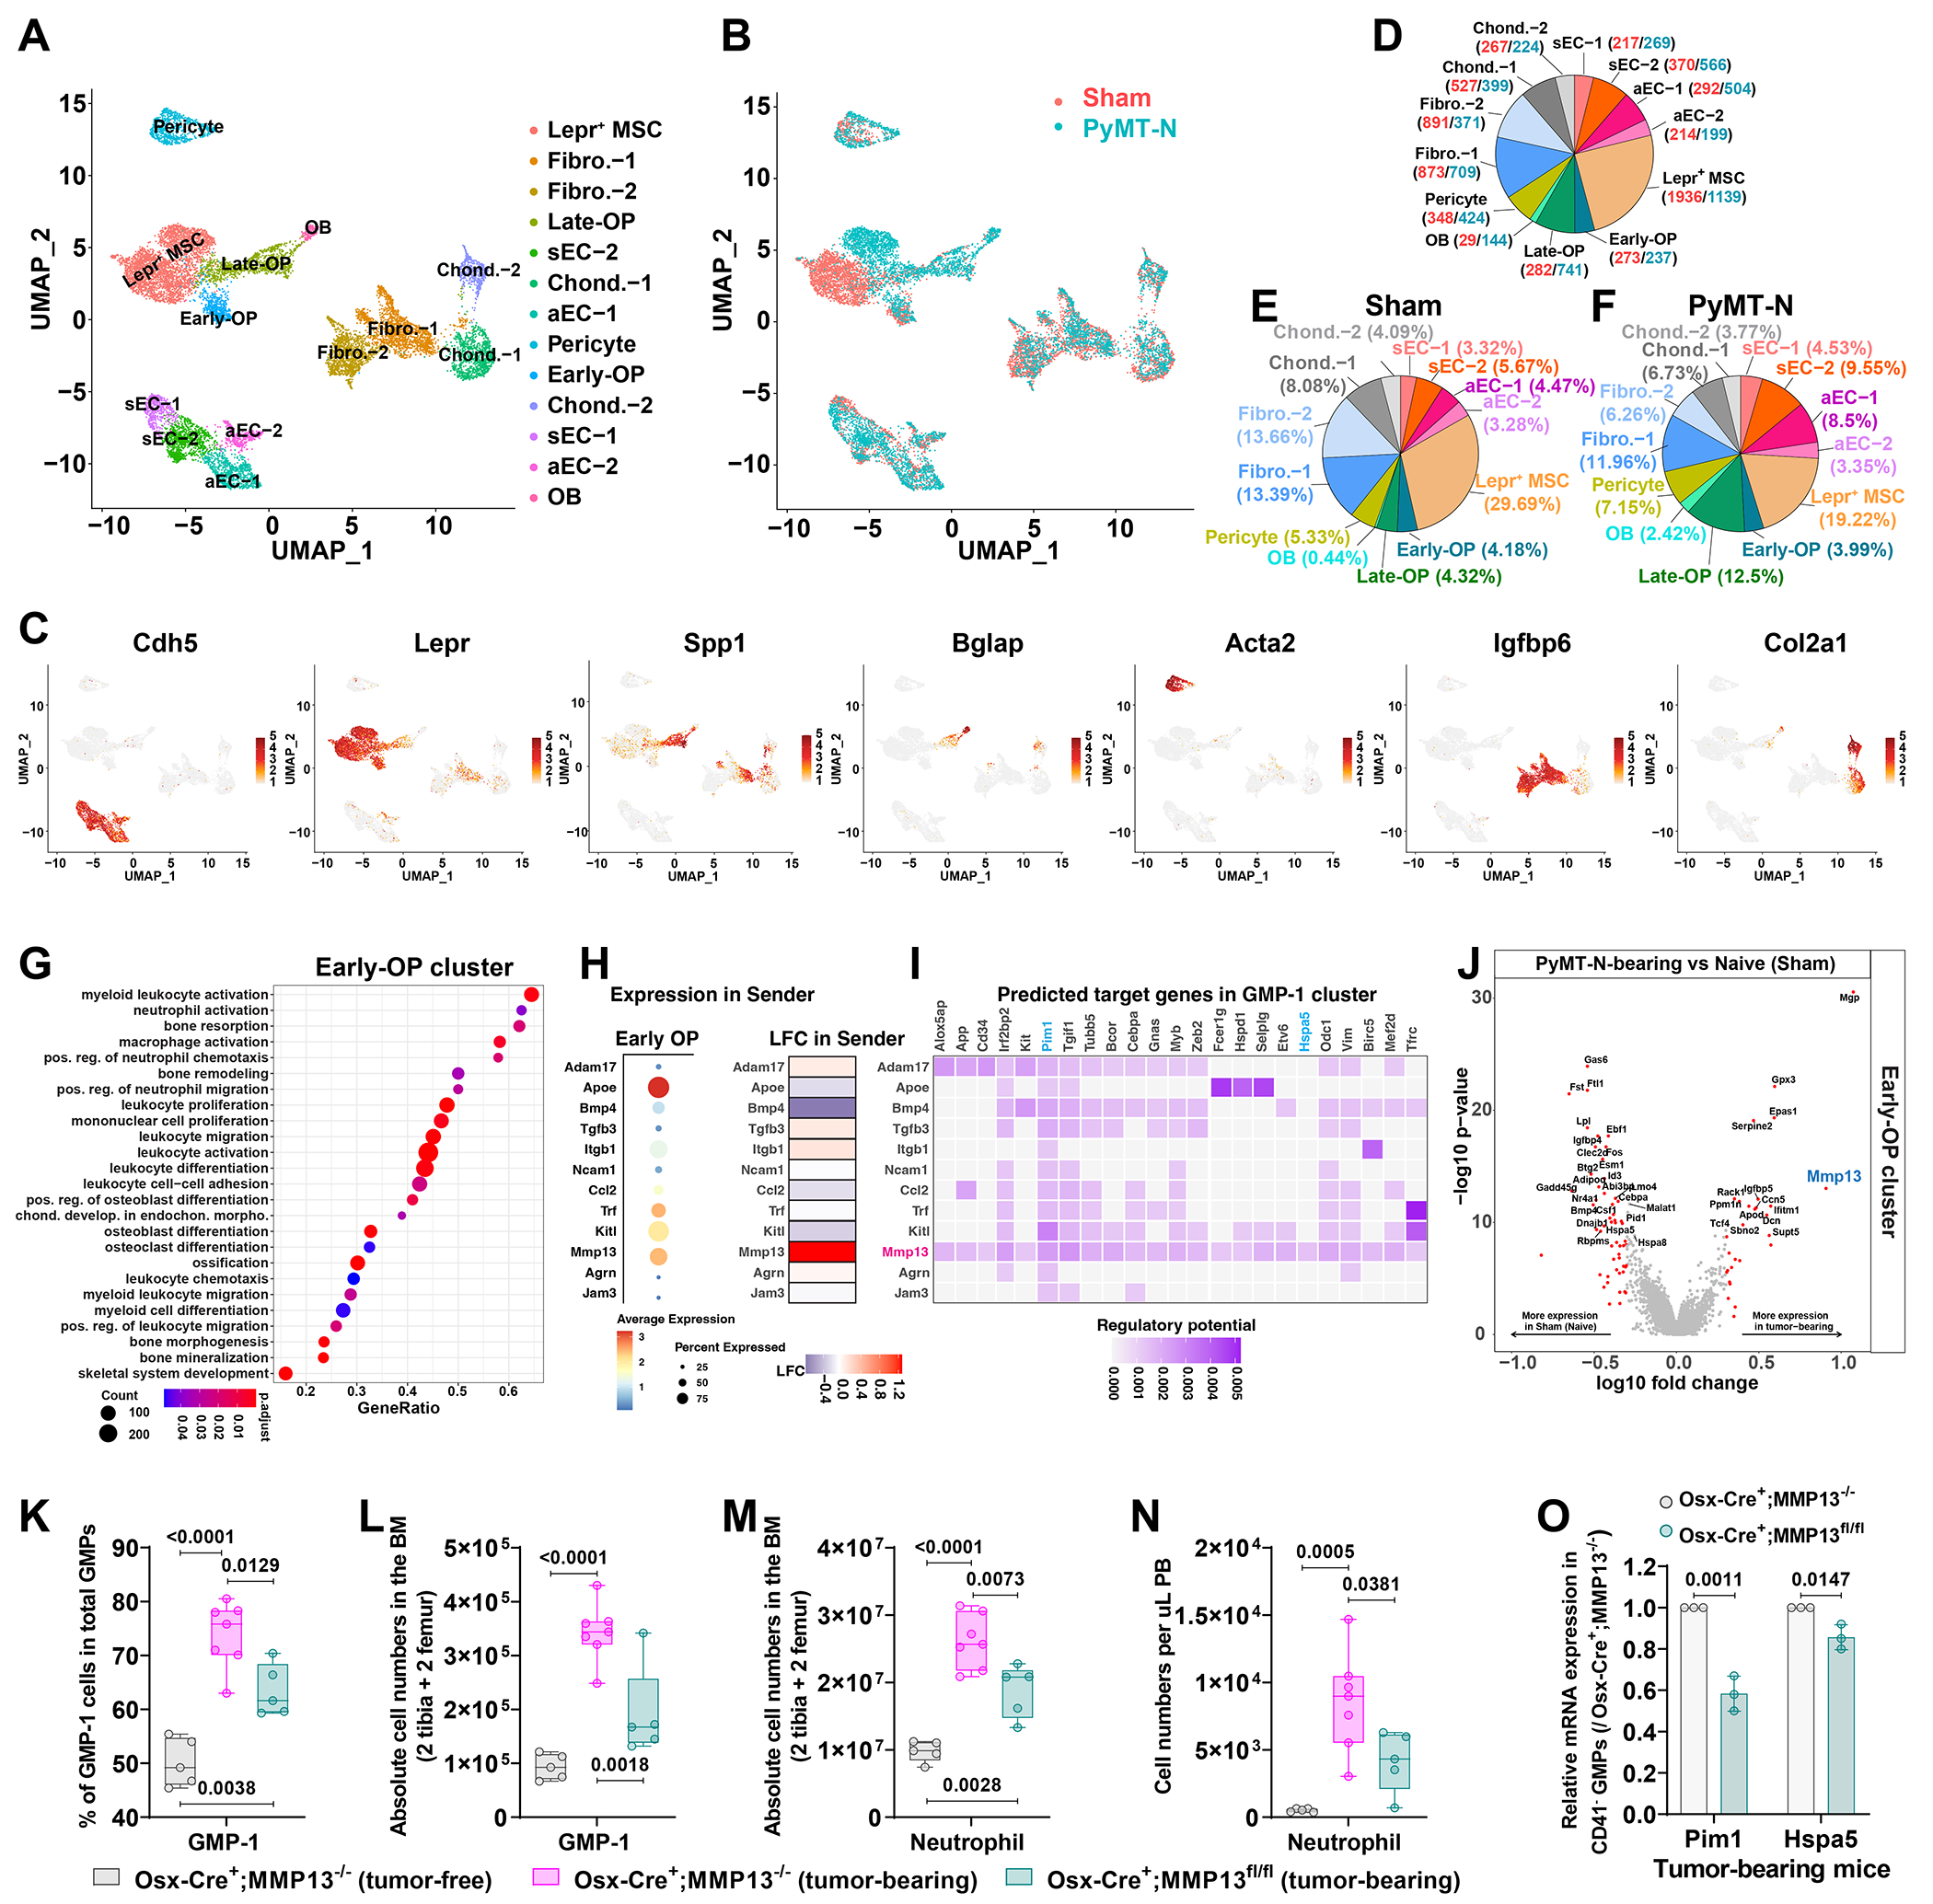
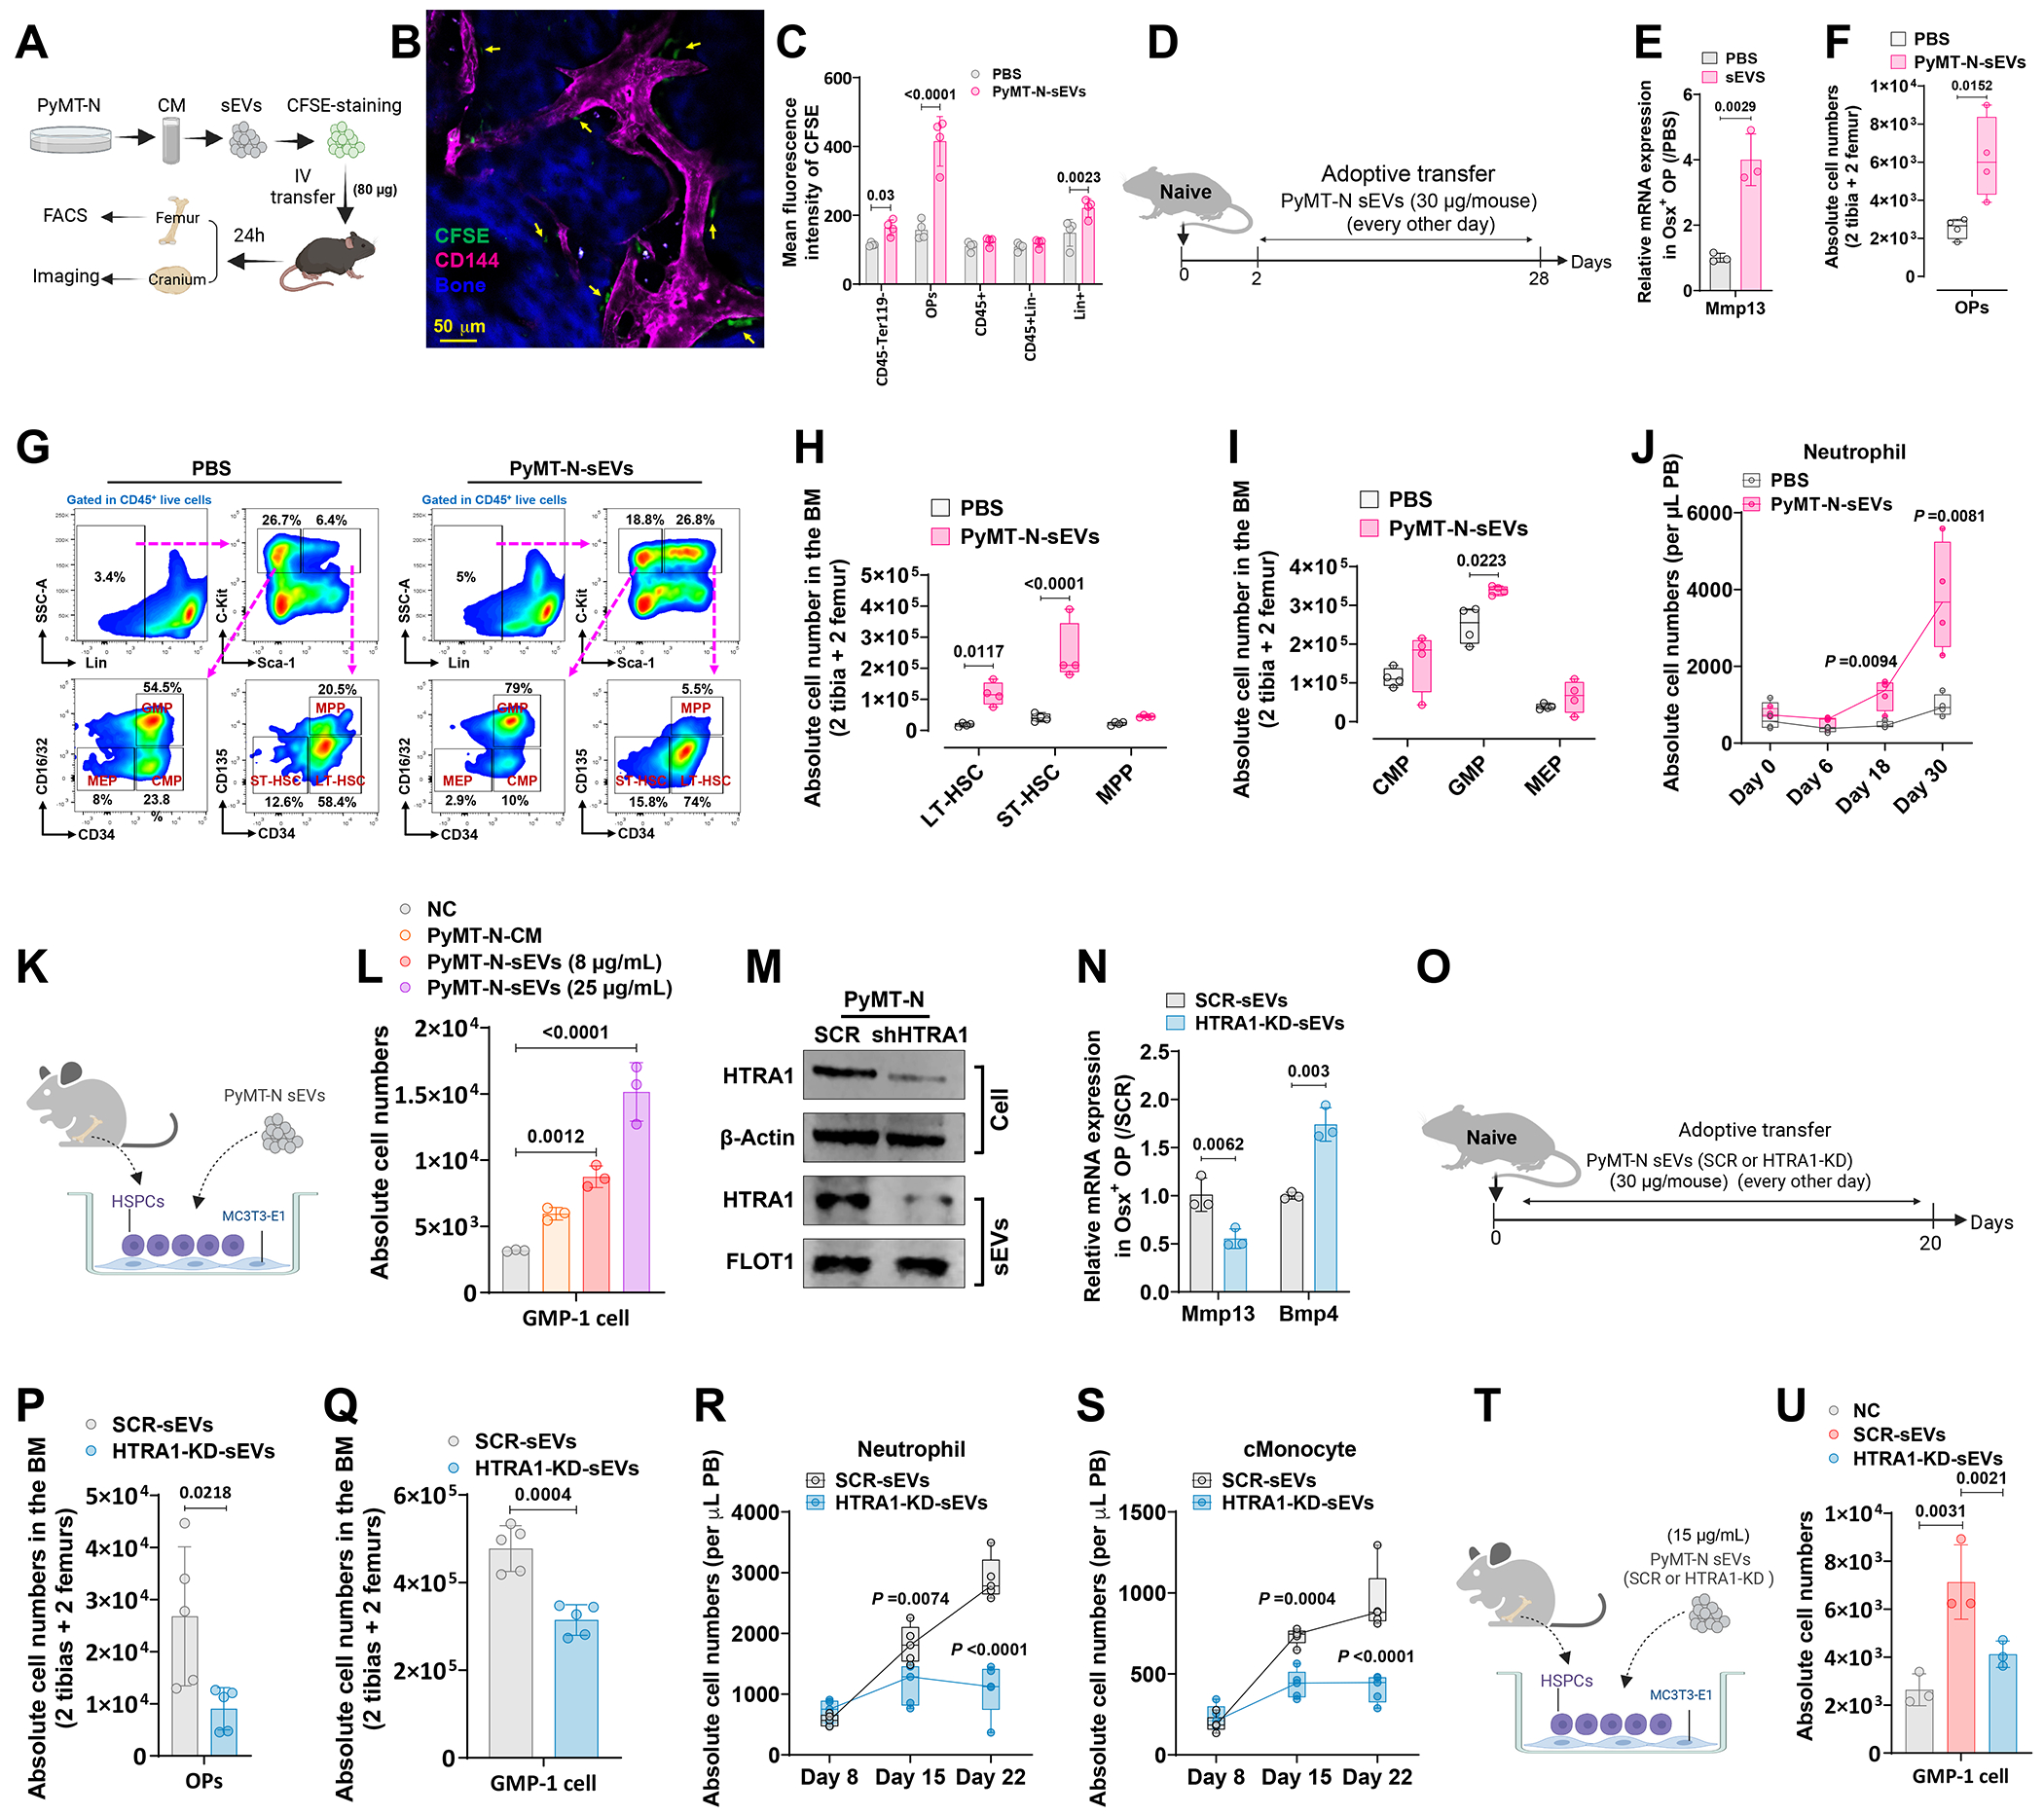
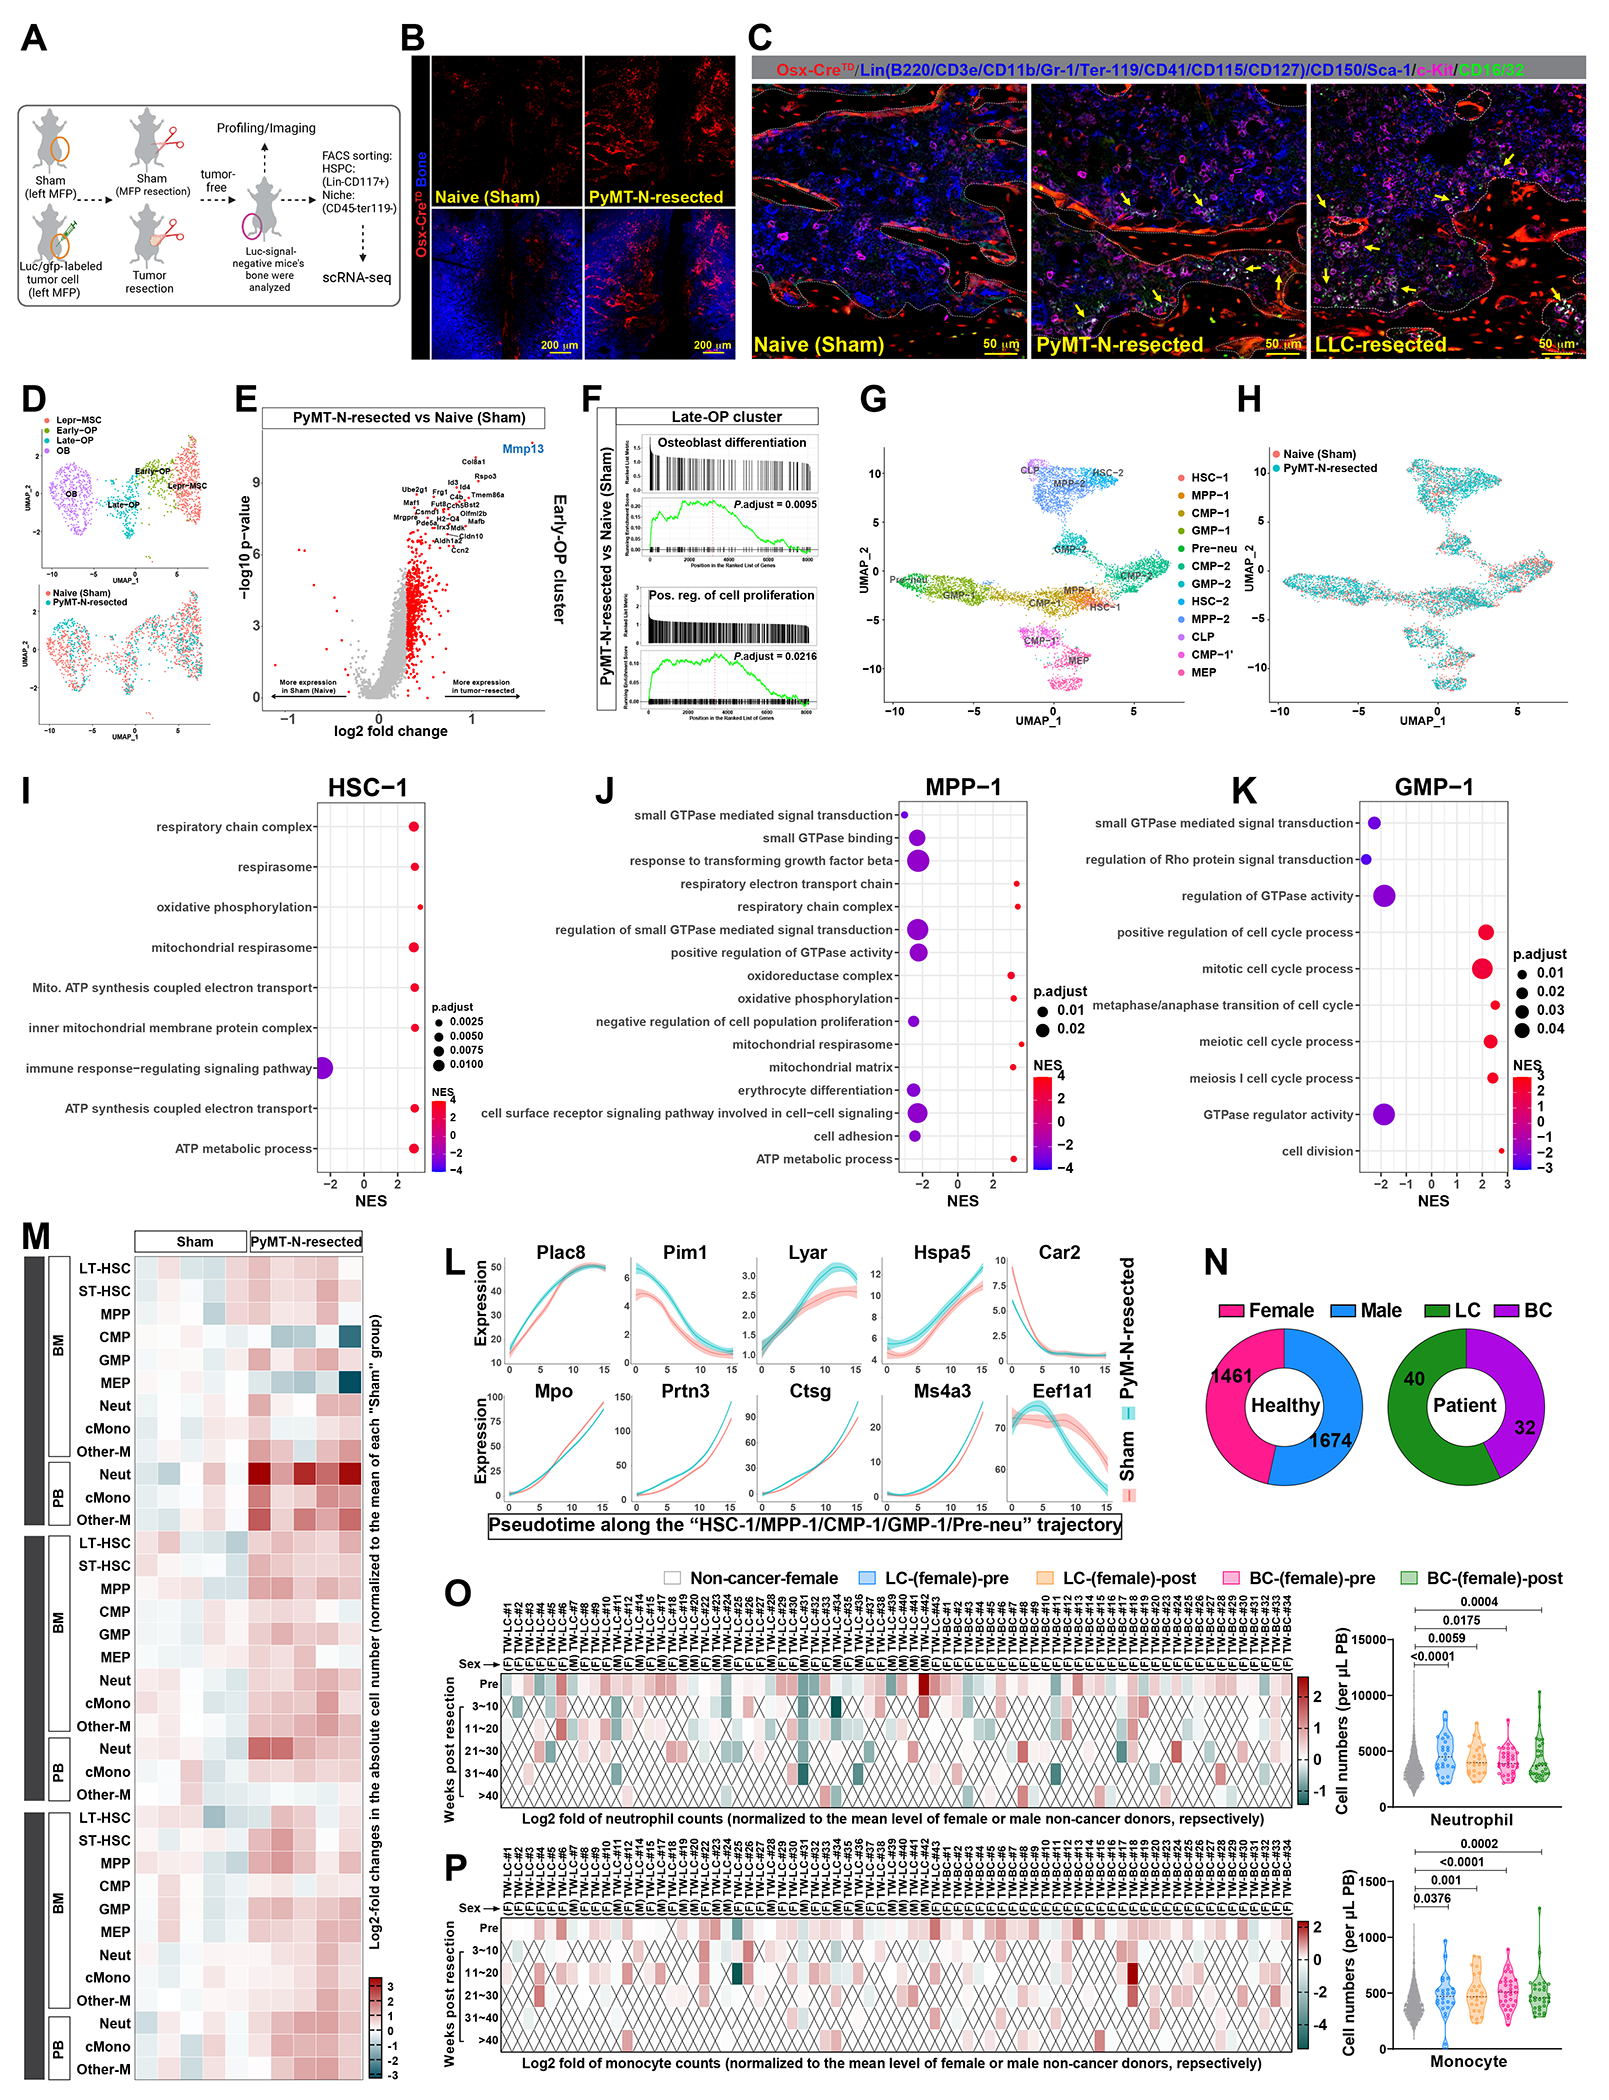
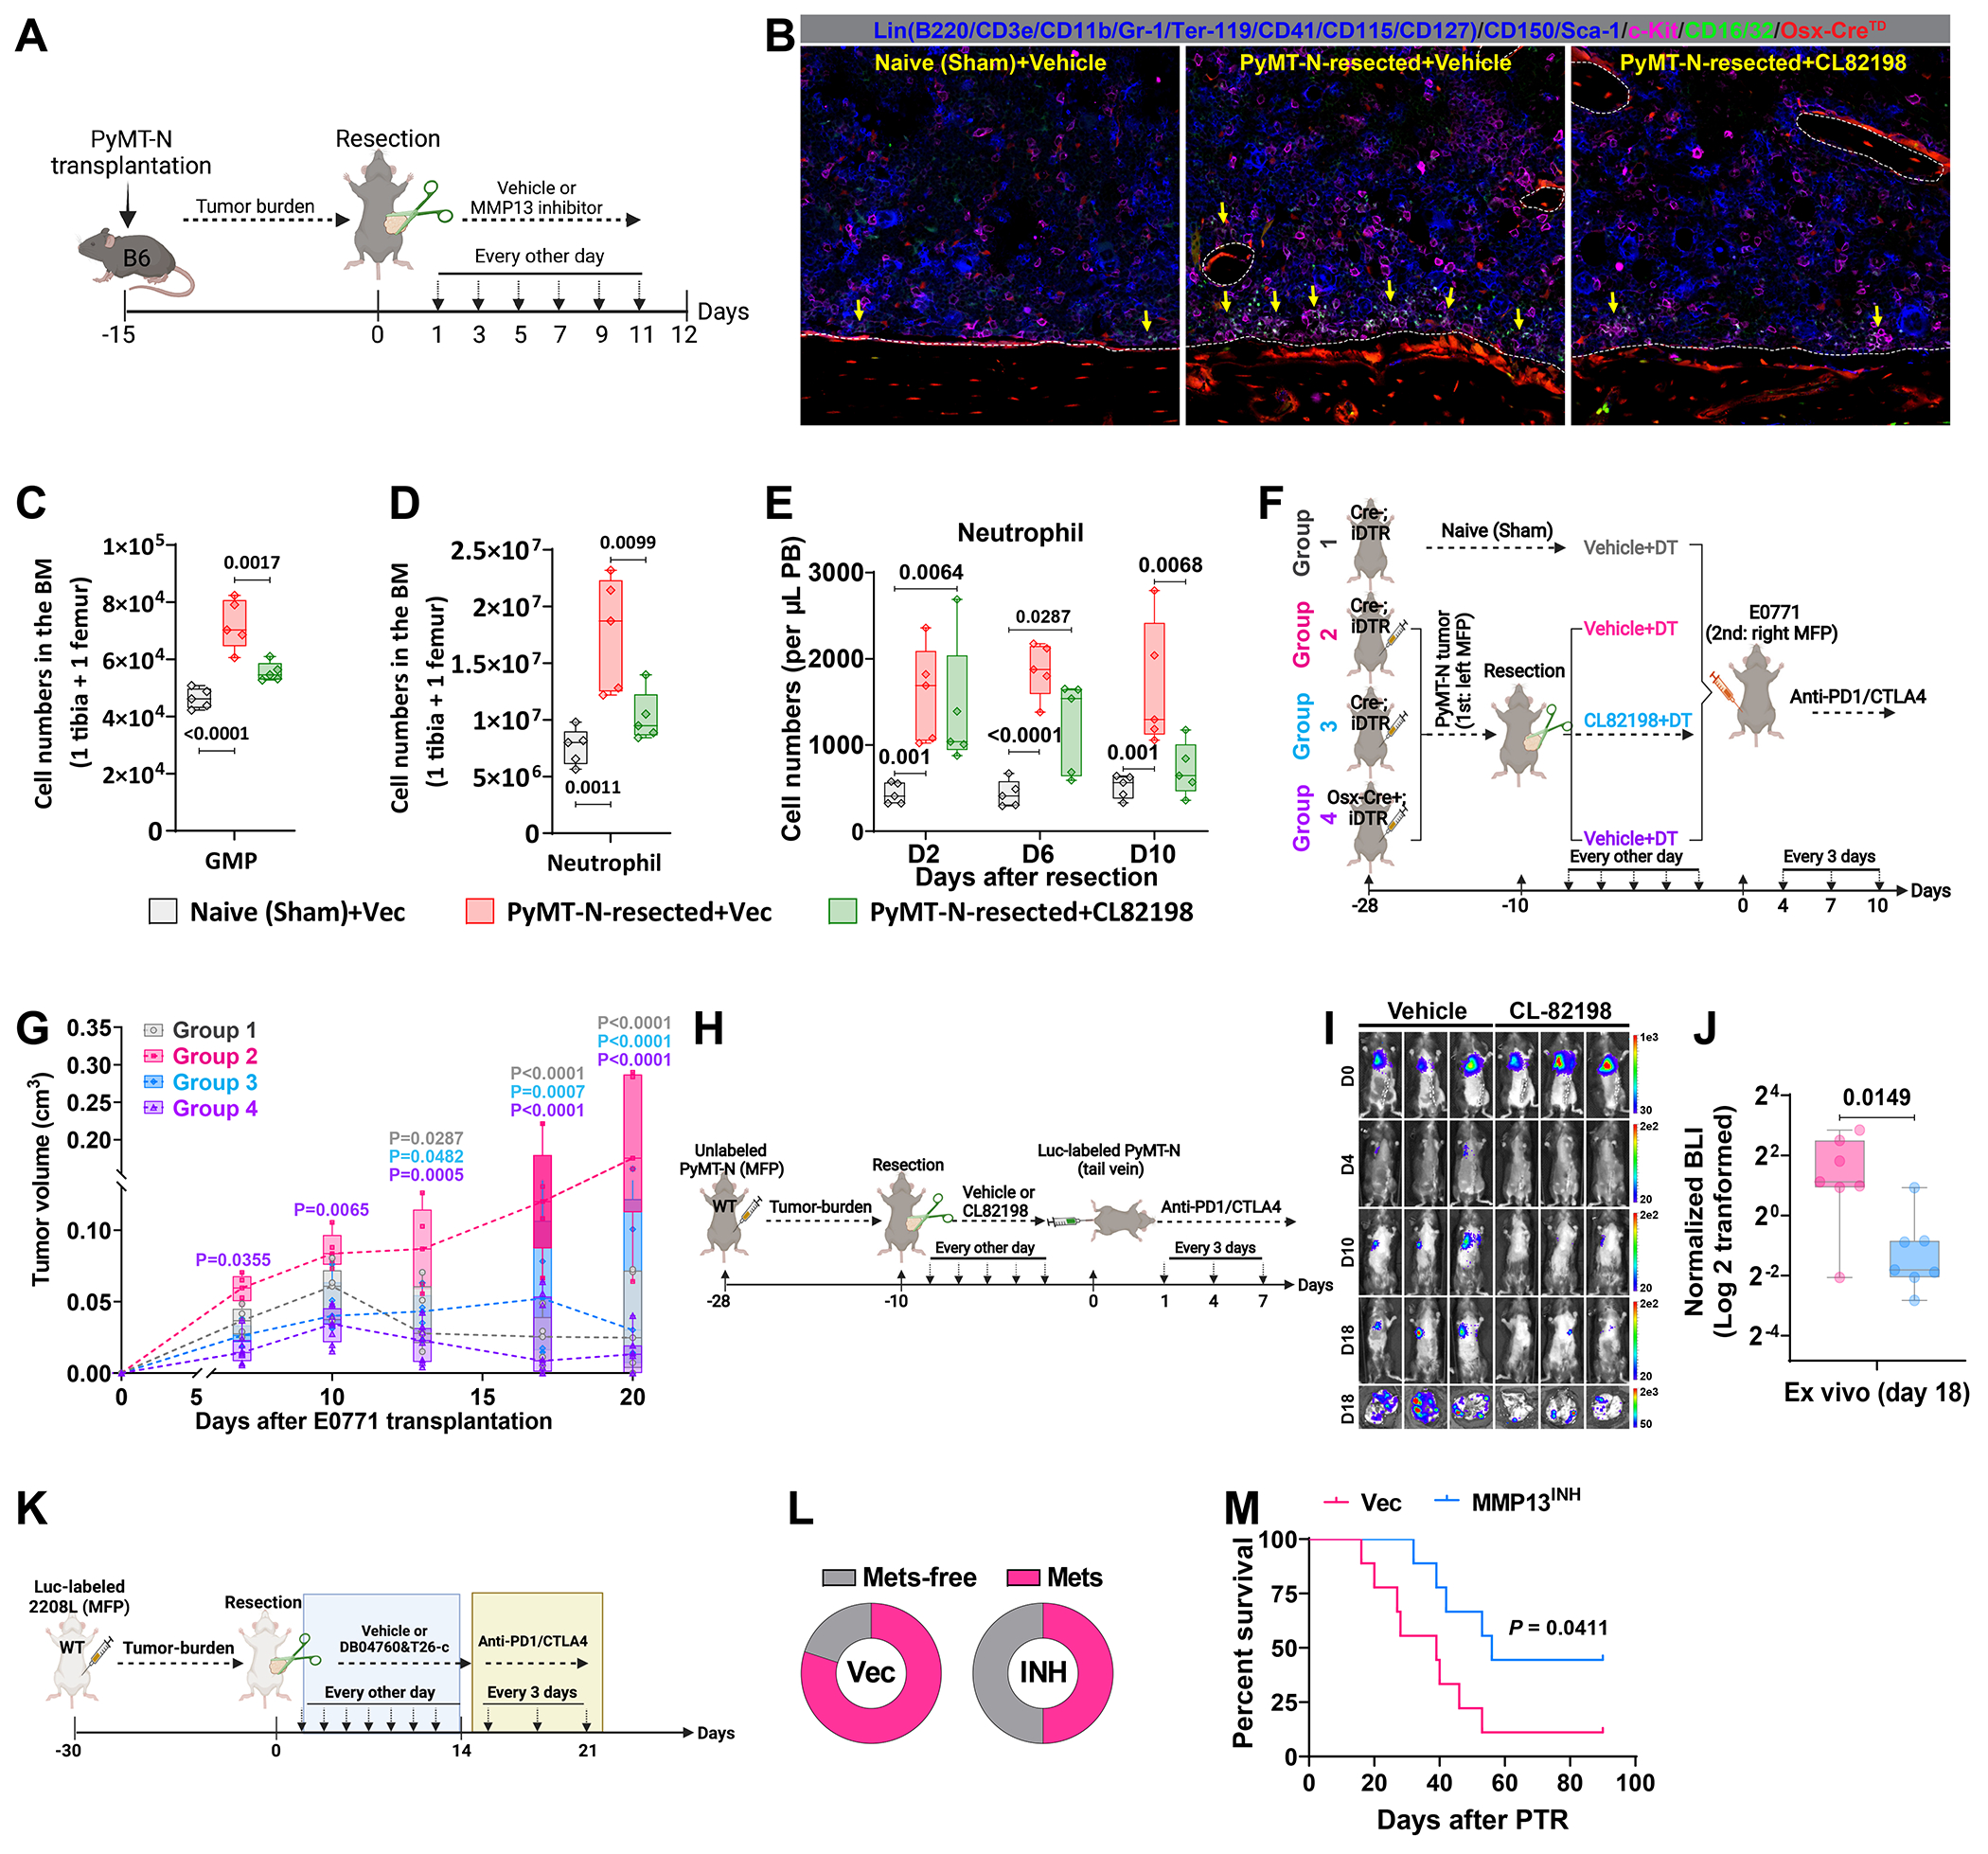
Remote tumors disrupt the bone marrow (BM) ecosystem (BME), eliciting the overproduction of BM-derived immunosuppressive cells. However, the underlying mechanisms remain poorly understood. Herein, we characterized breast and lung cancer-induced BME shifts pre- and post-tumor removal. Remote tumors progressively lead to osteoprogenitor (OP) expansion, hematopoietic stem cell dislocation, and CD41- granulocyte-monocyte progenitor (GMP) aggregation. The tumor-entrained BME is characterized by co-localization between CD41- GMPs and OPs. OP ablation abolishes this effect and diminishes abnormal myeloid overproduction. Mechanistically, HTRA1 carried by tumor-derived small extracellular vesicles upregulates MMP-13 in OPs, which in turn induces the alterations in the hematopoietic program. Importantly, these effects persist post-surgery and continue to impair anti-tumor immunity. Conditional knockout or inhibition of MMP-13 accelerates immune reinstatement and restores the efficacies of immunotherapies. Therefore, tumor-induced systemic effects are initiated by OP-GMP crosstalk that outlasts tumor burden, and additional treatment is required to reverse these effects for optimal therapeutic efficacy.

Keywords: MDSCs; bone marrow niches; cancer; hematopoiesis; hematopoietic stem/progenitor cells; immunotherapies; myelopoiesis; osteoprogenitor; scRNA-seq; systemic immunosuppression.


Conflict of interest statement

Declaration of interests The authors declare no competing interests.

Figures

Figure 1.
Figure 1.. Remote tumor burden disrupts spatial localization of HSPCs in the BM niches
(A) Change in absolute cell numbers of BM HSPCs from mice carrying NES tumors (red labels) or MES tumors (blue labels) compared with Sham mice. See also Figure S1A–S1G. (B-E) Flow cytometry analysis of hematopoietic cells in human PB. Healthy, n=35; TNBC, n=42. (F) Representative immunofluorescence (IF) staining of HSCs (Lin-CD41CD48CD150+, green arrows) in the femur. Vasculature (yellow); Megakaryocytes (green stars). n=4 mice. (G-H) Quantification of the distance of HSCs to vasculature (G, each dot represents one HSC) or the frequencies of HSC close to megakaryocytes (H). n=4 mice and 45 HSCs (per group) were quantified. (I) Representative IF staining of GMPs in the BM vascular and endosteal niches. Sca-1low sinusoidal ECs (purple dashed circle), megakaryocytes (white stars), endosteum surface (white dashed line), Sca-1hi arteriole ECs (yellow stars), and CD41 GMPs (yellow arrows). n=5 mice. (J) Quantification of CD41 GMP frequencies adhering to each blood vessel. n= 5 mice and 53 vessels (per group) were quantified. (K-L) Representative IF staining of lower magnification of CD41 GMP localization in the BM (K), and its distance to the endosteum (L). n=5 mice. (M-N) Representative flow cytometry analysis of BM GMP subpopulations based on CD41 expression, and their percentage among total GMPs. Sham, n=5; PyMT-N, n=4. Unpaired two-tailed Student’s t-test (C-E); One-way ANOVA with Dunnett’s multiple comparisons (G and J); Two-way ANOVA with Dunnett’s multiple comparisons (L, mean ± SD); Two-way ANOVA with Sidak’s multiple comparisons (N). See also Figure S1.
Figure 2.
Figure 2.. OPs expand during tumor burden and support CD41 GMPs expansion
(A) Representative cranium ex vivo imaging of Osx-CreTD OPs in the BM of tumor-bearing or Sham mice. n=3. (B) Representative IF staining of CD41 GMPs (yellow arrows) in the BM of tumor-bearing (tumor size: 0.2~0.3 cm3) or Sham Osx-CreTD transgenic mice. n=5. (C) DT administration in tumor-bearing Osx-CreTD;iDTR or Cre mice. Mice were fed with doxycycline water (Dox) to halt Osx-Cre expression and Dox was removed 2 weeks before tumor cell transplantation. (D-E) Representative flow cytometry analysis of BM GMPs of LLC (D; Cre, n=5, Cre+, n=4) or PyMT-N (E; Cre, n=8, Cre+, n=11) tumor-bearing iDTR mice after DT administration (day 18). (F-G) Representative flow cytometry analysis of BM CD41 GMPs of PyMT-N tumor-bearing iDTR mice after DT administration (day 18). Cre, n=8; Osx-cre+, n=9. (H) Representative IF staining of CD41 GMP clusters (yellow oval circles) close to the Osx+ endosteum (Red) in BM of tumor-bearing Osx-CreTD;iDTR mice after DT or PBS treatment (day 18). n=4 mice. (I-J) Flow cytometry analysis of myeloid subsets in the BM (I) or PB (J) of PyMT-N tumor-bearing iDTR mice after DT treatment (day 18). Cre, n=8; Osx-Cre+, n=11. Unpaired two-tailed Student’s t-test (D-E, G, I-J). See also Figure S2.
Figure 3.
Figure 3.. scRNA-seq reveals transcriptomic shifts in the “CD41 GMP” trajectory underlies pro-tumorigenic myelopoiesis
(A) scRNA-seq of the BM HSPCs and niche cells from PyMT-N tumor-bearing or Sham (naïve) mice. n=5 mice (per group) were pooled into one for FACS. (B-C) UMAP clustering of BM HSPCs with annotations (B) and cell of origin (C). (D) Cell numbers of HSPC clusters from PyMT-N-bearing (Cyan) or Sham mice (Red). (E) The expression distribution of representative marker genes in HSPC clusters. (F) Percentage of various HSPC subsets among total HSPCs in PyMT-N-bearing and Sham mice based on scRNA-seq data. (G-H) GSEA shows the dysregulated gene sets in the HSC or MPP-1 cluster of PyMT-N tumor-bearing mice (compared to Sham). (I) Plots show the expression of indicated genes as a function of pseudo time along the “CD41 GMP” trajectory. Shades indicate 95% confidence intervals. (J) GSEA shows the dysregulated gene sets in the GMP-1 cluster of PyMT-N tumor-bearing mice compared to Sham mice. (K) Proteomic analysis of granulocytes from the PB of TNBC patients (n=15). The protein level in each patient was normalized to the mean level of healthy donors. (L) Diagram of skewed hematopoietic differentiation trajectory during remote tumor burden. See also Figure S3.
Figure 4.
Figure 4.. scRNA-seq reveals enhanced osteogenic differentiation during tumor burden and MMP-13 in OPs mediates CD41 GMP expansion
(A-B) UMAP clustering of BM niche cells with annotations (A) or cell of origin (B). (C) The expression distributions of representative marker genes in BM niche cells. (D) Cell numbers of BM niche cell clusters from PyMT-N-bearing (Cyan) or Sham mice (Red). (E-F) Percentage of various BM niche cells among total niche in PyMT-N-bearing and Sham mice based on scRNA-seq data. (G) GSEA shows that indicated gene sets were enriched in the OP cluster of PyMT-N-bearing mice (compared to Sham). (H-I) NicheNet analysis of the intercellular communication between early-OP (sender cell) and GMP-1 cluster (receiver cell) based on the scRNA-seq data. Expression of indicated ligands in OP (H); Ligand-target matrix denotes the regulatory potential between OP-derived ligands and target genes from the GMP-1 cluster (I). (J) Volcano plots show the differential gene expression of OP cluster between PyMT-N-bearing and Sham mice. (K-N) Flow cytometry analysis of CD41 GMPs (GMP-1 cells) and neutrophils in the BM (K-M) or PB (N) of tumor-free (n=5) and PyMT tumor-bearing Osx-Cre+;Mmp13−/− (n=7) or Osx-Cre+;Mmp13fl/fl mice (n=5). (O) Relative mRNA expression of genes in CD41 GMPs from PyMT tumor-bearing Osx-Cre+;Mmp13−/− or Osx-Cre+;Mmp13fl/fl mice. n=3. One-way ANOVA with Tukey’s multiple comparisons (K-N); Multiple t-tests (O, mean ± SD). See also Figure S4.
Figure 5.
Figure 5.. Remote tumor-secreted HTRA1-containing sEVs induce MMP13 upregulation in OPs to disrupt BME
(A) Experimental design to examine the PyMT-N-sEVs uptake by BM in vivo. (B) Ex vivo imaging of cranium BM niche 24h after CFSE-labeled sEVs injection. CFSE+ cells in the endosteum (yellow arrows); Vasculature (purple). n=3 mice. (C) Flow cytometry analysis of CFSE signal in the femoral BM 24h after PyMT-N sEVs injection. n=4 mice. (D) In vivo adoptive transfer of PyMT-N-sEVs. (E) Relative mRNA expression of Mmp13 in OsxTD OPs of naive mice 3 weeks after PyMT-sEVs treatment. n=3. (F-I) Flow cytometry analysis of OPs and HSPCs in the BM of naïve mice after PyMT-N-sEVs injection (day 30). n=4. (J) Flow cytometry analysis of neutrophils in the PB during PyMT-N-sEVs treatment. n=4. (K-L) BM HSPCs were co-cultured with MC3T3-E1 cells and added PyMT-N-sEVs (or condition medium of PyMT-N cells) (K). Flow cytometry analysis of GMP-1 cell numbers 2 days after co-culture (L). n=3. (M) Representative western blotting images of HTRA1 levels from scrambled (SCR) or shHTRA1 PyMT-N cells or PyMT-N-secreted sEVs. FLOT1 is a marker of sEVs. (N) Relative mRNA expression of Mmp13 in OsxTD OPs of naive mice 3 weeks after treatment of SCR or HTRA1-KD PyMT-N sEVs. n=3. (O) In vivo adoptive transfer of SCR or HTRA1-KD PyMT-N-sEVs. (P-Q) Flow cytometry analysis of OPs and CD41 GMPs (GMP-1 cells) in the BM of naïve mice after PyMT-N-sEVs injection (day 22). n=5. (R-S) Flow cytometry analysis of myeloid cell numbers in the PB during treatment with SCR or HTRA1-KD PyMT-N-sEVs. n=5. (T-U) BM HSPCs were co-cultured with MC3T3-E1 and added sEVs isolated from scrambled or shHTRA1 PyMT-N cells (T). Flow cytometry analysis of GMP-1 cells 2 days after co-culture (U). n=3. Unpaired two-tailed Student’s t-test (C, E-F, P-O); One-way ANOVA with Dunnett’s multiple comparisons (L, U); Two-way ANOVA with Sidak’s multiple comparisons (H-J, N, R-S). Mean ± S.D. (C, E-F, L, P-O, U). See also Figure S5.
Figure 6.
Figure 6.. The tumor-induced systemic effects persist after tumor removal
(A) Experimental design to investigate the persistence of tumor-induced effects after tumor removal. See also STAR METHODS. (B-C) EX vivo imaging of OsxTD OPs in the cranium BM (B; n=3) and IF staining of GMP-1 cells (yellow arrows) in the femoral BM (C; n=4) of Naïve (Sham) or tumor-resected mice 16 days after resection. (D) UMAP clustering and annotation of osteogenic lineage from PyMT-N tumor-resected mice and Naïve (Sham) mice 28 days after resection. (E) Volcano plots show the differential gene expression of OP cluster between PyMT-N-resected and Sham mice. (F) GSEA shows that indicated gene sets were enriched in OP clusters of PyMT-N-tumor-resected mice (compared to Sham). (G-H) UMAP plot of BM HSPCs from PyMT-N-resected or Naïve (Sham) mice with color annotations of cell identity (G) and cell of origin (H). Day 28 after resection. (I-K) GSEA shows the upregulated or downregulated gene sets in the indicated HSPC clusters of PyMT-N tumor-resected mice compared to Naïve (Sham) mice. (L) Plots show the expression of indicated genes along the “CD41 GMP” trajectory of PyMT-N tumor-resected compared with Naïve (Sham) mice, shades indicating 95% confidence intervals. (M) Change in absolute cell numbers of indicated cell populations in the BM or PB at different time points after PyMT-N tumor resection. n=5. See also Figure S6E–S6G. (N) The number of non-cancer donors and patients. LC (Lung cancer), BC (Breast cancer). (O-P) Change in neutrophil (O) or monocyte (P) numbers in the PB of cancer patients pre-resection and post-resection (at multiple time points) compared to non-cancer donors. The mean neutrophil or monocyte number at all time points post-resection was calculated and compared to non-cancer donors (right panels). Data were analyzed by one-way ANOVA with Dunnett’s multiple comparisons test. Non-cancer-female, n=1461; LC-female, n=24; BC-female, n=32. See also Figure S6.
Figure 7.
Figure 7.. Targeting OP-reprogramming reverses tumor-induced BME changes and expedites anti-tumor immunity after tumor resection
(A) Experimental design of tumor resection followed by MMP-13 inhibitor administration. (B) Representative IF staining of GMP-1 cells (yellow arrows) in the BM of PyMT-N tumor-resected Osx-CreTD mice 10 days after MMP-13 inhibitor treatment. n=3. (C-E) Flow cytometry analysis of GMPs and neutrophils in the BM or PB of PyMT-N tumor-resected or Sham (naïve) mice 12 days (C-D) or 10 days (E) after resection plus inhibitor treatment. n=5. (F) Except for the sham-operated Cre;iDTR mice (no tumor burden, Group-1), PyMT-N cells were transplanted into the left-side MFP of Cre-;iDTR or Osx-Cre+;iDTR mice. MMP-13-inhibitor or DT was administrated after tumor resection for 10 days, followed by retransplantation of E0771 cells into right-side MFP and then treated with ICB. (G) Tumor growth curves show responses of E0771 tumors in mice from experiment (F) to ICB therapy. Group 1~3, n=5; Group 4, n=8. (H) Unlabeled PyMT-N cells were transplanted into the MFP. 18 days later, primary tumors were resected, and then MMP-13 inhibitors or Vehicles were administrated for 10 days, followed by tail vein injection of luciferase-labeled PyMT-N cells, and then treated with ICB. (I-J) Representative bioluminescent images (BLI) show lung metastasis progression in MMP-13 inhibitor or Vehicle-treated mice (I). Normalized BLI intensity is shown (J). n=7. (K) Luciferase-labeled 2208L cells were transplanted into the MFP. 30 days later, primary tumors were resected and then MMP-13-inhibitor or Vehicle was administrated for 7 doses, followed by treatment with ICB. (L-M) Incidence of spontaneous lung metastases (L) and the mice survival curves (M) after primary tumor resection in experiment (K), n=9. One-way ANOVA with Tukey’s multiple comparisons (C-D); Two-way ANOVA with Tukey’s multiple comparisons (E); Two-way ANOVA with Dunnett’s multiple comparisons compared to “Group-2” (G); Unpaired two-tailed Student’s t-test (J); Log-rank (Mantel-Cox) test (M). See also Figure S7.

References

    1. McAllister SS, and Weinberg RA (2014). The tumour-induced systemic environment as a critical regulator of cancer progression and metastasis. Nat Cell Biol 16, 717–727. 10.1038/ncb3015. - DOI - PMC - PubMed
    1. Kaplan RN, Riba RD, Zacharoulis S, Bramley AH, Vincent L, Costa C, MacDonald DD, Jin DK, Shido K, Kerns SA, et al. (2005). VEGFR1-positive haematopoietic bone marrow progenitors initiate the pre-metastatic niche. Nature 438, 820–827. 10.1038/nature04186. - DOI - PMC - PubMed
    1. Veglia F, Perego M, and Gabrilovich D (2018). Myeloid-derived suppressor cells coming of age. Nat Immunol 19, 108–119. 10.1038/s41590-017-0022-x. - DOI - PMC - PubMed
    1. Hoshino A, Costa-Silva B, Shen TL, Rodrigues G, Hashimoto A, Tesic Mark M, Molina H, Kohsaka S, Di Giannatale A, Ceder S, et al. (2015). Tumour exosome integrins determine organotropic metastasis. Nature 527, 329–335. 10.1038/naturel5756. - DOI - PMC - PubMed
    1. Peinado H, Aleckovic M, Lavotshkin S, Matei I, Costa-Silva B, Moreno-Bueno G, Hergueta-Redondo M, Williams C, Garcia-Santos G, Ghajar C, et al. (2012). Melanoma exosomes educate bone marrow progenitor cells toward a pro-metastatic phenotype through MET. Nat Med 18, 883–891. 10.1038/nm.2753. - DOI - PMC - PubMed

Publication types

MeSH terms

Substances