. 2023 May 4;30(5):665-676.e4.
doi: 10.1016/j.stem.2023.04.007.

IGFBP2 expressing midlobular hepatocytes preferentially contribute to liver homeostasis and regeneration

Affiliations

IGFBP2 expressing midlobular hepatocytes preferentially contribute to liver homeostasis and regeneration

Yu-Hsuan Lin et al. Cell Stem Cell. .

Abstract

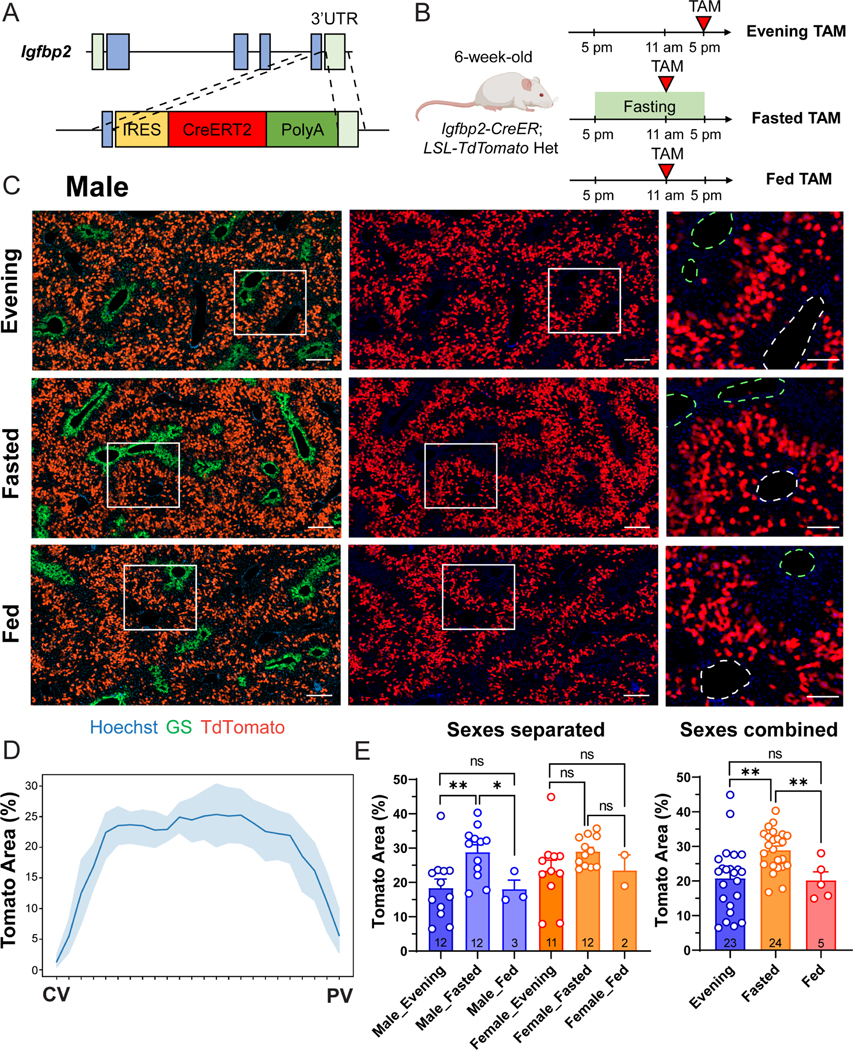
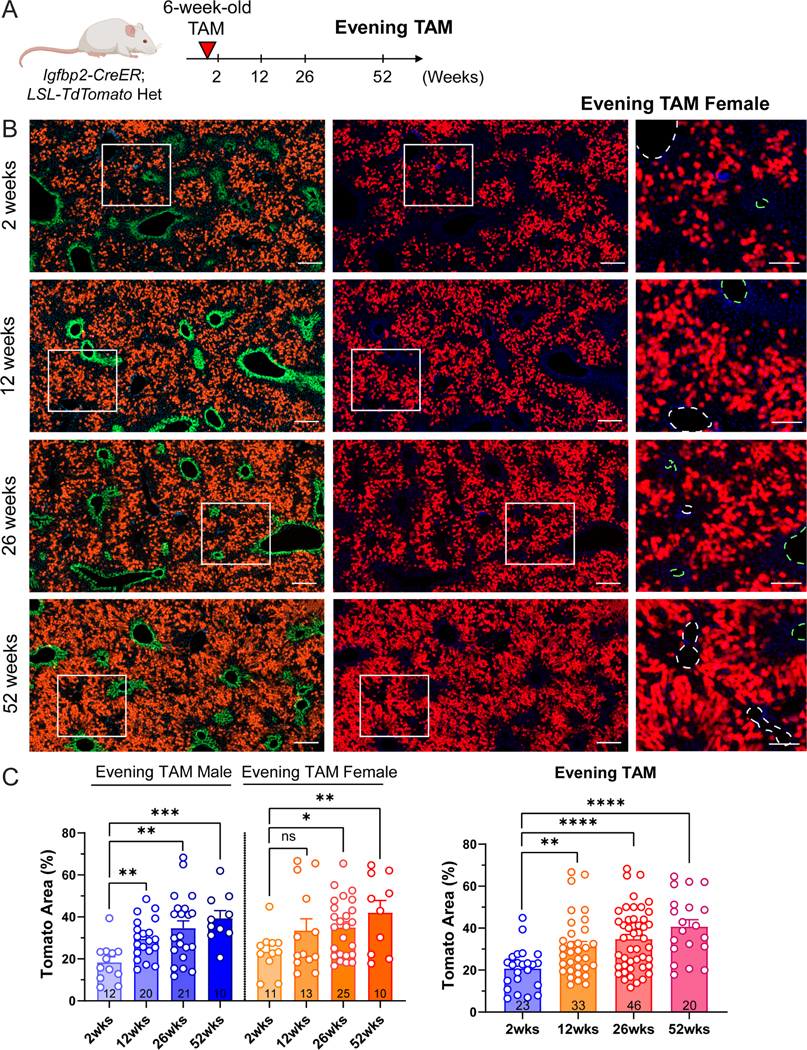
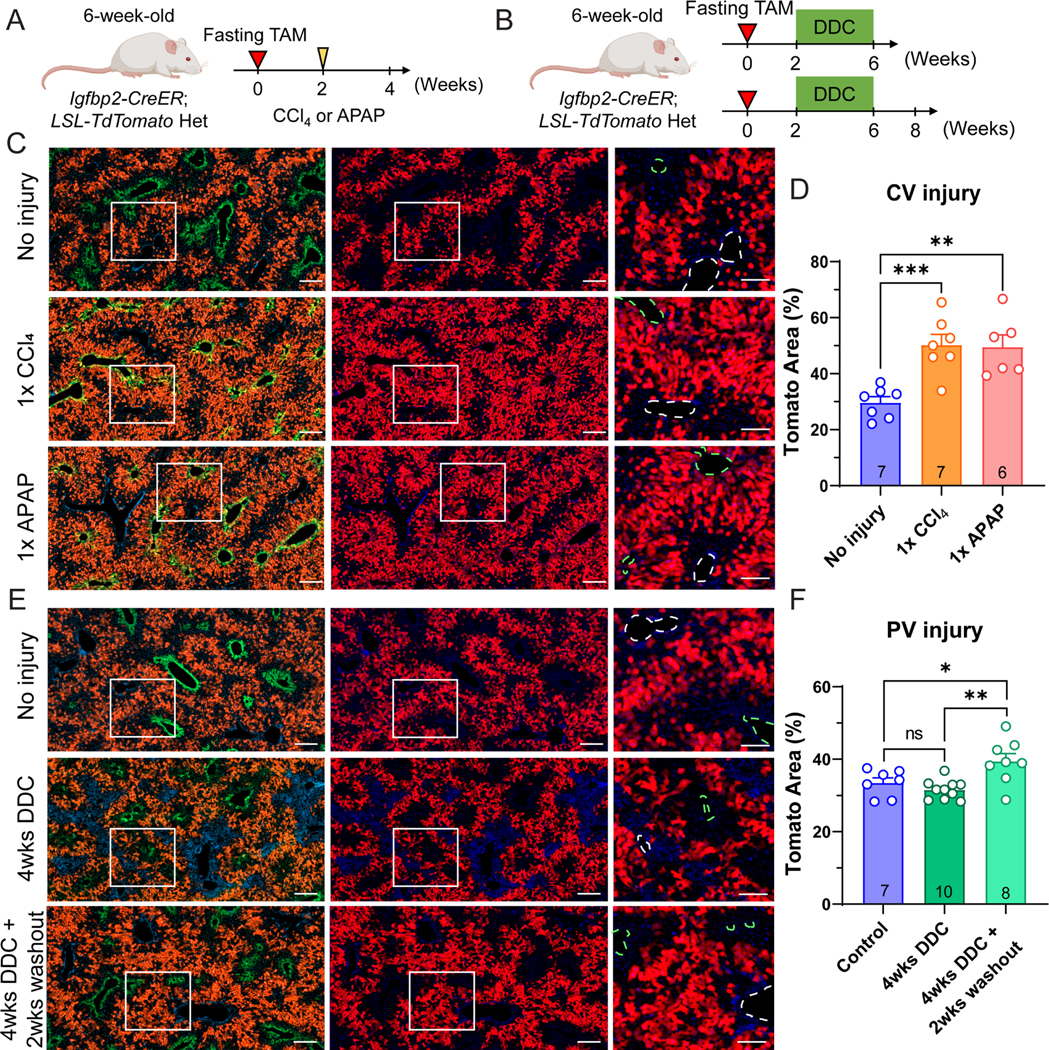
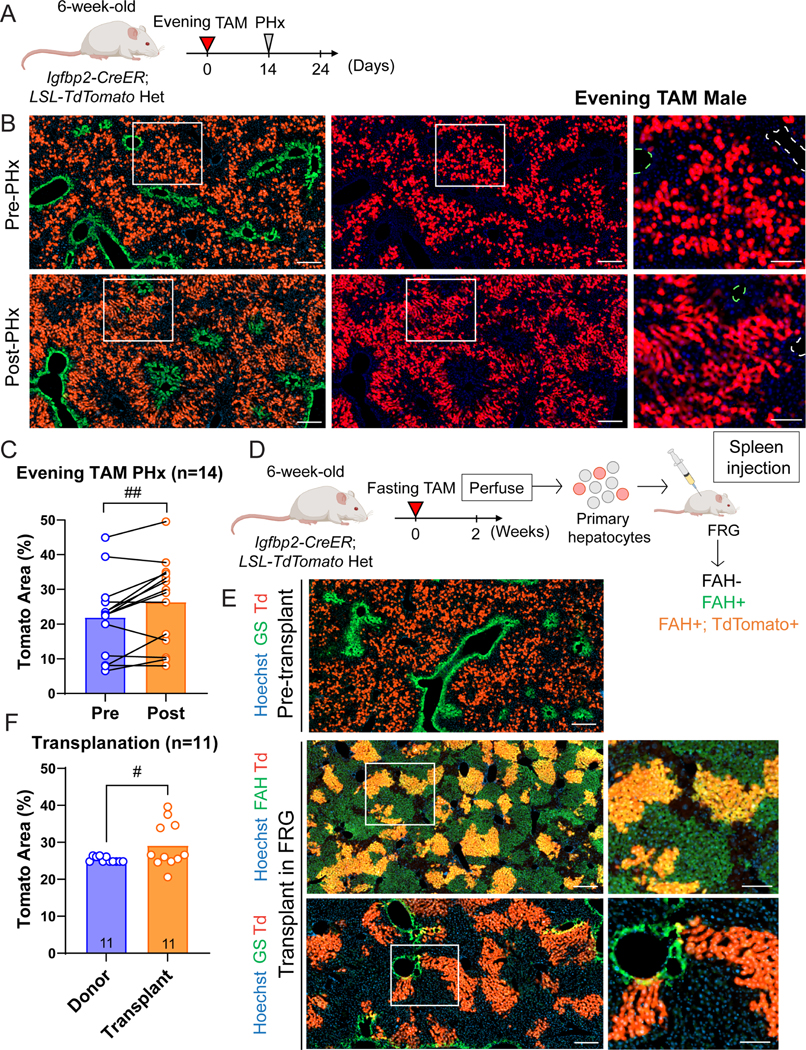
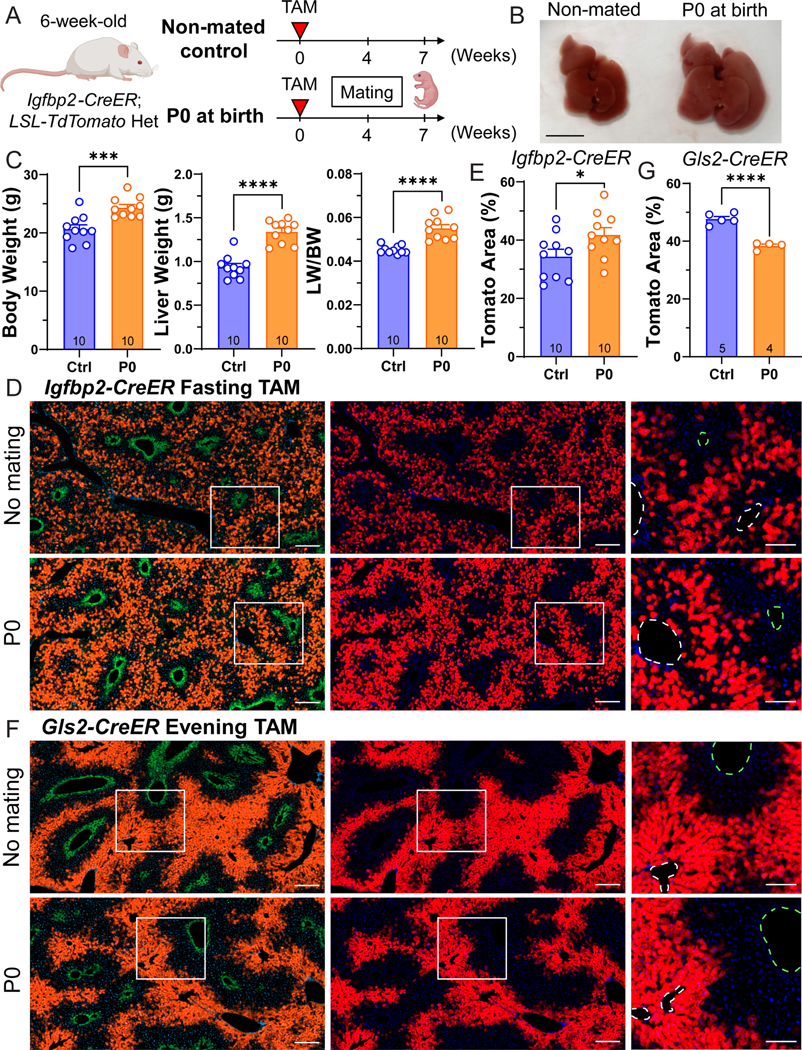
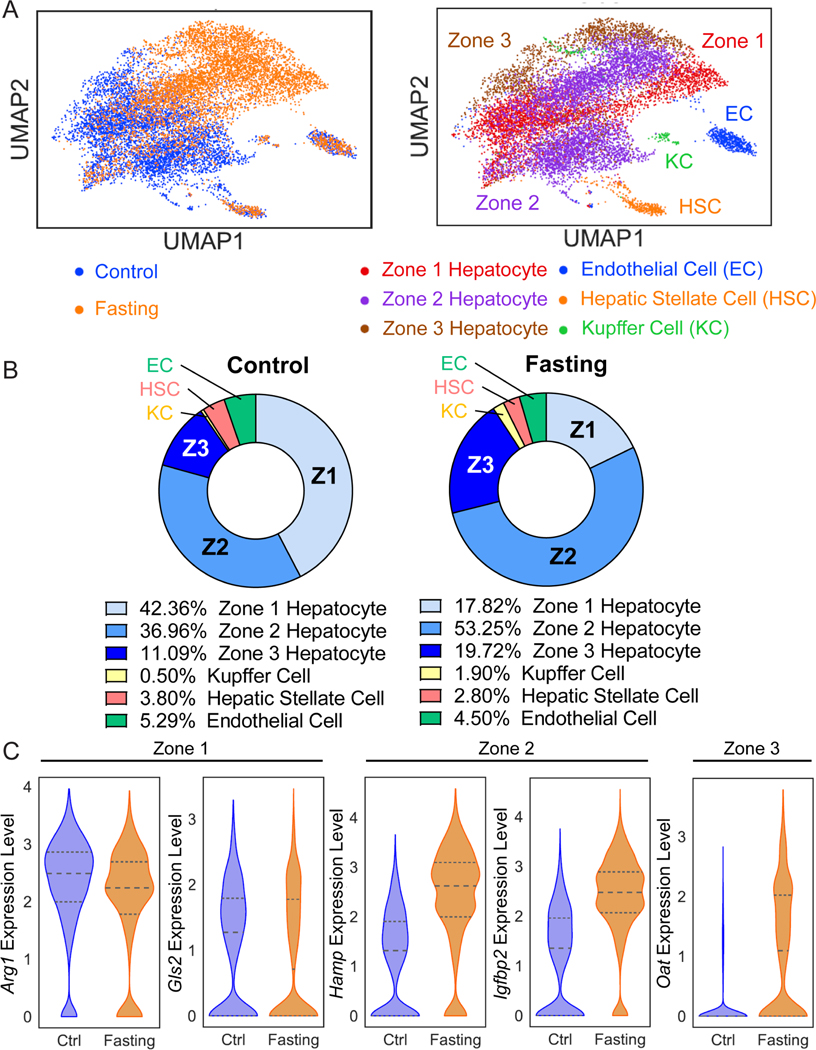
Although midlobular hepatocytes in zone 2 are a recently identified cellular source for liver homeostasis and regeneration, these cells have not been exclusively fate mapped. We generated an Igfbp2-CreER knockin strain that specifically labels midlobular hepatocytes. During homeostasis over 1 year, zone 2 hepatocytes increased in abundance from occupying 21%-41% of the lobular area. After either pericentral injury with carbon tetrachloride or periportal injury with 3,5-diethoxycarbonyl-1,4-dihydrocollidine (DDC), IGFBP2+ cells replenished lost hepatocytes in zones 3 and 1, respectively. IGFBP2+ cells also preferentially contributed to regeneration after 70% partial hepatectomy, as well as liver growth during pregnancy. Because IGFBP2 labeling increased substantially with fasting, we used single nuclear transcriptomics to explore zonation as a function of nutrition, revealing that the zonal division of labor shifts dramatically with fasting. These studies demonstrate the contribution of IGFBP2-labeled zone 2 hepatocytes to liver homeostasis and regeneration.

Keywords: lineage tracing; midlobular hepatocytes; regeneration; zonation; zone 2.


Conflict of interest statement

Declaration of interests H.Z. has a sponsored research agreement with Alnylam Pharmaceuticals, consults for Flagship Pioneering and Chroma Medicines, and serves on the SAB of Ubiquitix. These interests are not directly related to the contents of this paper.

Figures

Figure 1.
Figure 1.. The Igfbp2-CreER strain labels zone 2 hepatocytes in a nutrient-dependent manner.
A. Schema of the homology directed repair (HDR) construct used to generate the Igfbp2-CreER strain. B. Schema of three different tamoxifen administration approaches. C. Representative images of male Igfbp2-CreER; tdTomato het mouse livers two weeks after tamoxifen given at 100mg/kg intraperitoneally using different approaches. In magnified images, the green dashed circles represent CVs (marked by GS), and the white dashed circles represent PVs. Scale bar = 200 μm for cropped images and 100 μm for magnified images. D. The percent area labeled in Igfbp2-CreER mice given evening tamoxifen. E. The quantification of the Tomato+ areas of the three tamoxifen approaches. The right panel combines the data points from the two sexes shown in the left panel. The data points of evening and fasting tamoxifen are the same as in the 2-week timepoint in Figure 2C and S4D (n = 23, 24 and 5 mice for evening, fasted, and fed groups respectively). All data in this figure are presented as mean ± SEM. Significance is displayed as p < 0.05 (*), p < 0.01 (**), p < 0.001(***), and p < 0.0001 (****).
Figure 2.
Figure 2.. Zone 2 hepatocytes give rise to new hepatocytes during normal homeostasis.
A. Schema of evening tamoxifen lineage tracing experiment under normal homeostasis. B. Representative images of female evening tamoxifen lineage tracing over 2, 12, 26 and 52 weeks under homeostatic conditions. Scale bar = 200 μm for cropped images and 100 μm for magnified images. Slides were stained for GS (green). The green dashed circles represent CVs (marked by GS), and the white dashed circles represent PVs. C. Quantification of the Tomato area from B. The right panel combines the data points from two sexes shown in the left panel. The 2-week data points are the same as the evening timepoints in Figure 1E (n = 23, 33, 46 and 20 mice for 2, 12, 26 and 52 weeks). All data in this figure are presented as mean ± SEM. Significance is displayed as p < 0.05 (*), p < 0.01 (**), p < 0.001(***), and p < 0.0001 (****).
Figure 3.
Figure 3.. IGFBP2+ zone 2 cells regenerate after both pericentral and periportal injuries.
A. Schema of fasting tamoxifen males challenged with CCl4 or APAP. B. Schema of fasting tamoxifen males given 4 weeks of DDC diet. C. Representative images of fasting tamoxifen treated males without injury or two weeks after CCl4 or APAP injury. Scale bar = 200 μm for cropped images and 100 μm for magnified images. Slides were stained for GS (green). The green dashed circles represent CVs (marked by GS), and the white dashed circles represent PVs. D. Quantification of the Tomato area from C (n = 7, 7 and 6 mice for no injury, CCl4 and APAP, respectively). E. Representative images of fasting tamoxifen male without injury, after 4 weeks of DDC feeding, or after 4 weeks DDC plus a 2 week washout period with normal chow. Scale bar = 200 μm for cropped images and 100 μm for magnified images. Slides were stained for GS (green). The green dashed circles represent CVs (marked by GS), and white dashed circles represent PVs. F. Quantification of the Tomato area from E (n = 7, 10, and 8 mice for control diet, 4 weeks of DDC, and 4 weeks of DDC + 2 weeks of washout). All data in this figure are presented as mean ± SEM. Significance is displayed as p < 0.05 (*), p < 0.01 (**), p < 0.001(***), and p < 0.0001 (****).
Figure 4.
Figure 4.. Zone 2 hepatocytes labeled by Igfbp2-CreER contribute to liver regeneration and repopulation.
A. Schema of the Igfbp2-CreER lineage tracing experiment in the context of PHx. B. Representative images of evening tamoxifen male livers pre- and post-PHx. Scale bar = 200 μm for cropped images and 100 μm for magnified images. Slides were stained for GS (green). The green dashed circles represent CVs (marked by GS), and the white dashed circles represent PVs. C. Quantification of the Tomato area from B. Significance was assessed by paired t-tests (n = 14 mice). D. Schema of primary hepatocyte transplantation from Igfbp2-CreER mice into FRG mice. E. Representative images of pre-transplant donor livers and the post-transplant repopulated livers. Scale bar = 200 μm for cropped images and 100 μm for magnified images. In the donor livers, slides were stained for GS (green). In the transplanted FRG livers, slides were either stained for FAH (upper) or GS (lower). F. Quantification of the Tomato area from E. The percentage was quantified by taking the ratio of the Tomato area over the FAH area in the transplanted livers (n = 11 and 11 mice for the donors and recipients). The donor Tomato percentages were plotted as 11 individual data points coming from 2 donor mice. All data in this figure are presented as mean ± SEM. The statistical significance is displayed as # (p < 0.05), ## (p < 0.01) in the paired analysis.
Figure 5.
Figure 5.. Zone 2 cells contribute to liver expansion during pregnancy
A. Schema of the pregnancy lineage tracing experiment. Igfbp2-CreER mice were given tamoxifen at 6 weeks of age, and mated 4 weeks afterwards. The livers were harvested when the pups were born (P0) in the pregnancy group. B. Gross images of livers from control and pregnant mice. Scale bar, 1 cm. C. Body weight, liver weight, and liver-to-body weight ratios of non-mated controls (Ctrl) and the pregnant group collected at P0 (n = 10 and 10 for control and pregnant mice). D. Representative images of control and pregnant livers from Igfbp2-CreER mice. Scale bar = 200 μm for cropped images and 100 μm for magnified images. Slides were stained for GS (green). The green dashed circles represent CVs (marked by GS), and the white dashed circles represent PVs. E. Quantification of the Tomato area from D (n = 10 and 10 for control and pregnant mice). F. Representative images of control and pregnant livers from Gls2-CreER mice. Scale bar = 200 μm for cropped images and 100 μm for magnified images. Slides were stained for GS (green). The green dashed circles represent CVs (marked by GS), and the white dashed circles represent PVs. G. Quantification of the Tomato area from F (n = 5 control and 4 pregnant mice). All data in this figure are presented as mean ± SEM. Significance is displayed as p < 0.05 (*), p < 0.01 (**), p < 0.001(***), and p < 0.0001 (****).
Figure 6.
Figure 6.. snRNA-seq revealed significant transcriptomic and zonation changes in the fasted liver.
A. Uniform Manifold Approximation and Projection (UMAP) plots represent the clustering of two samples (left panel) and cell populations (right panel). Nuclei from two fed livers were combined and two fasted livers were combined for the snRNA-seq experiment. B. This pie chart indicates the proportions of each cell population in fed (left panel) and fasted livers (right panel). C. Gene expression of zonal markers (Zone 1: Arg1, Gls2; Zone 2: Hamp, Igfbp2; Zone 3: Oat) in fed and fasted livers.

Similar articles

Cited by

References

    1. Furuyama K, Kawaguchi Y, Akiyama H, Horiguchi M, Kodama S, Kuhara T, Hosokawa S, Elbahrawy A, Soeda T, Koizumi M, et al. (2011). Continuous cell supply from a Sox9-expressing progenitor zone in adult liver, exocrine pancreas and intestine. Nat. Genet. 43, 34–41. 10.1038/ng.722. - DOI - PubMed
    1. Font-Burgada J, Shalapour S, Ramaswamy S, Hsueh B, Rossell D, Umemura A, Taniguchi K, Nakagawa H, Valasek MA, Ye L, et al. (2015). Hybrid Periportal Hepatocytes Regenerate the Injured Liver without Giving Rise to Cancer. Cell 162, 766–779. 10.1016/j.cell.2015.07.026. - DOI - PMC - PubMed
    1. Wang B, Zhao L, Fish M, Logan CY, and Nusse R (2015). Self-renewing diploid Axin2(+) cells fuel homeostatic renewal of the liver. Nature 524, 180–185. 10.1038/nature14863. - DOI - PMC - PubMed
    1. Lin S, Nascimento EM, Gajera CR, Chen L, Neuhöfer P, Garbuzov A, Wang S, and Artandi SE (2018). Distributed hepatocytes expressing telomerase repopulate the liver in homeostasis and injury. Nature 556, 244–248. 10.1038/s41586-018-0004-7. - DOI - PMC - PubMed
    1. Sun T, Pikiolek M, Orsini V, Bergling S, Holwerda S, Morelli L, Hoppe PS, Planas-Paz L, Yang Y, Ruffner H, et al. (2020). AXIN2+ pericentral hepatocytes have limited contributions to liver homeostasis and regeneration. Cell Stem Cell 26, 97–107.e6. 10.1016/j.stem.2019.10.011. - DOI - PubMed

Publication types

Substances