. 2023 Jun 6;35(6):996-1008.e7.
doi: 10.1016/j.cmet.2023.04.012. Epub 2023 May 4.

The mitochondrial unfolded protein response regulates hippocampal neural stem cell aging

Affiliations

The mitochondrial unfolded protein response regulates hippocampal neural stem cell aging

Chih-Ling Wang et al. Cell Metab. .

Abstract

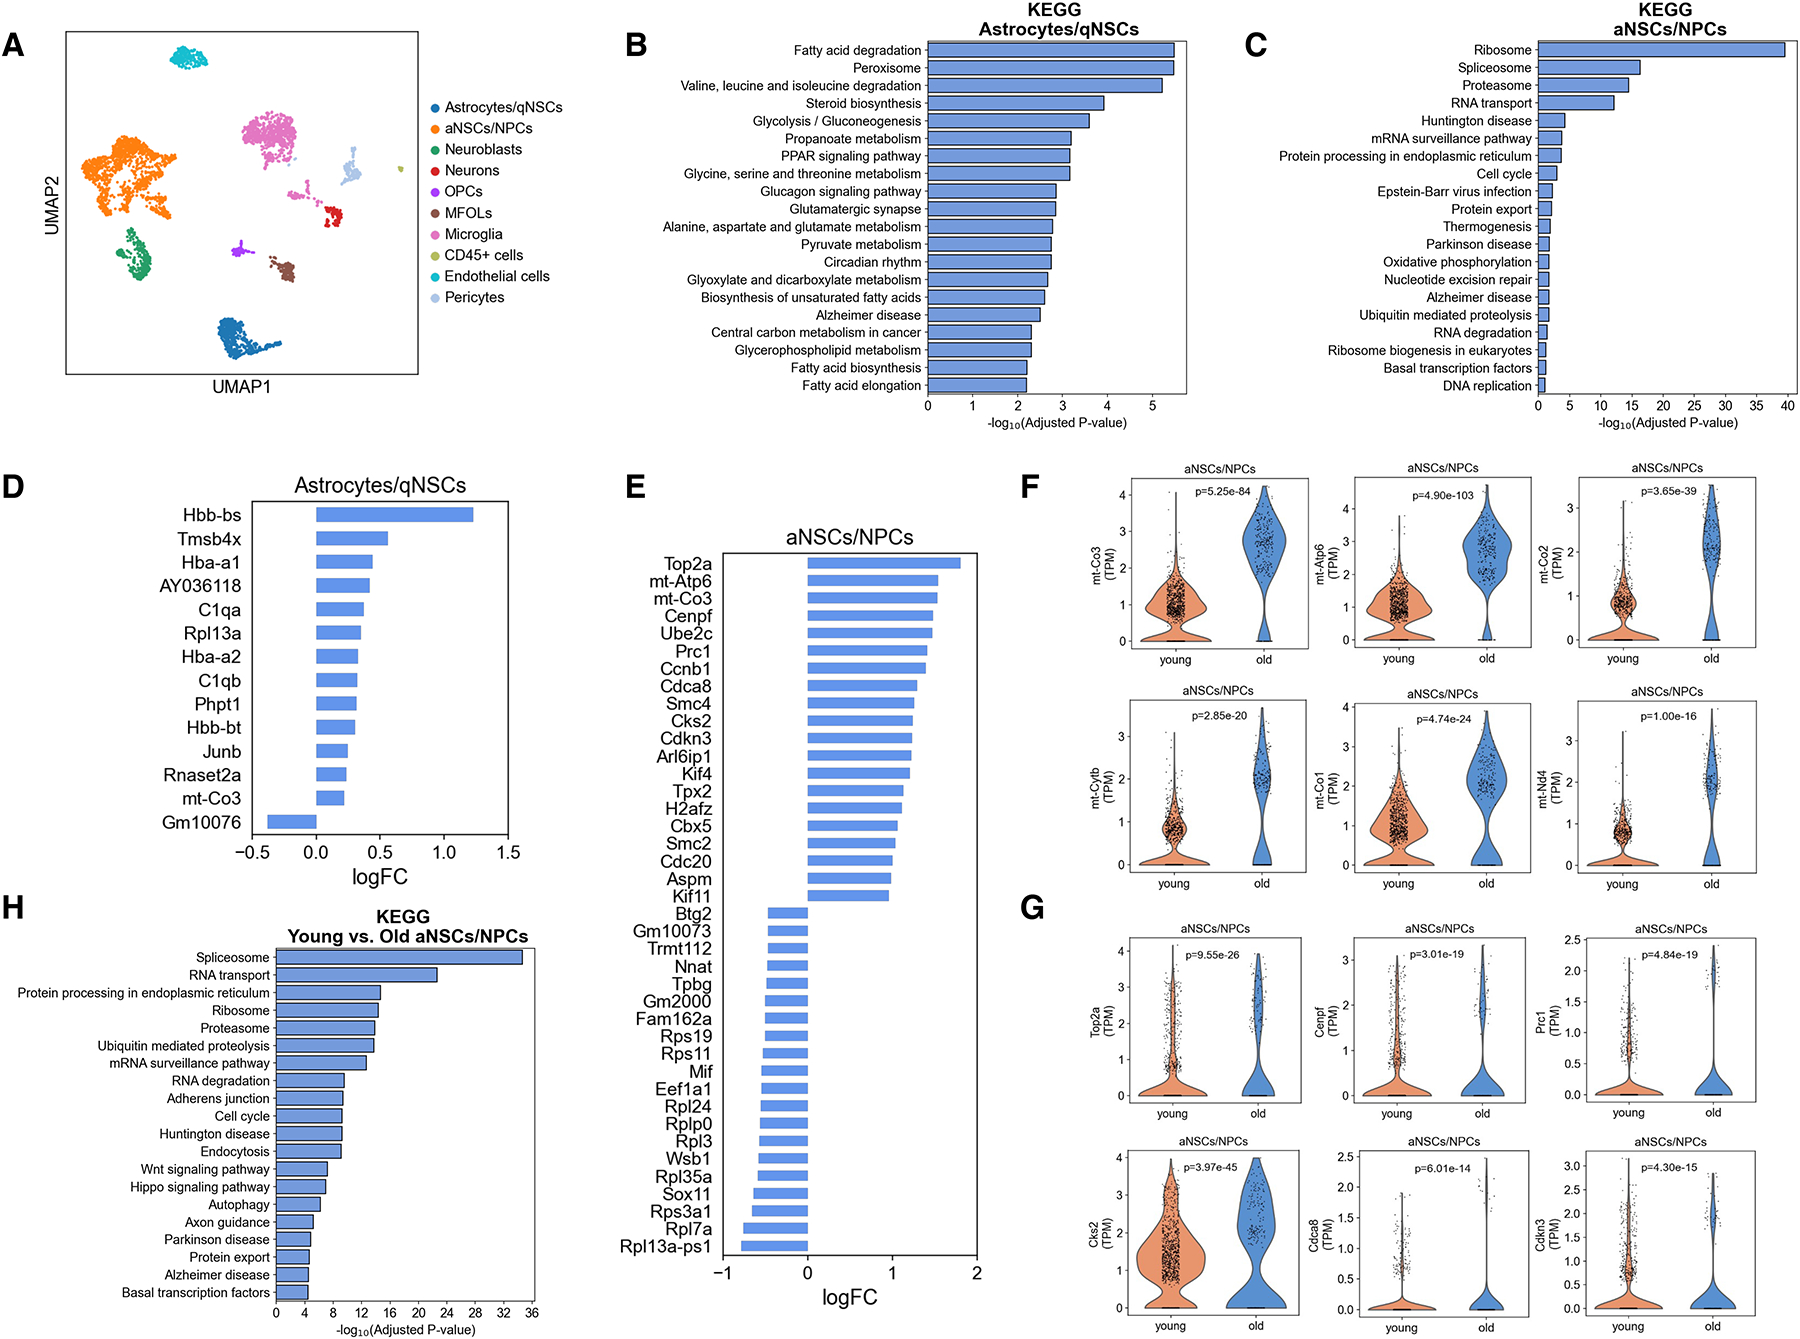
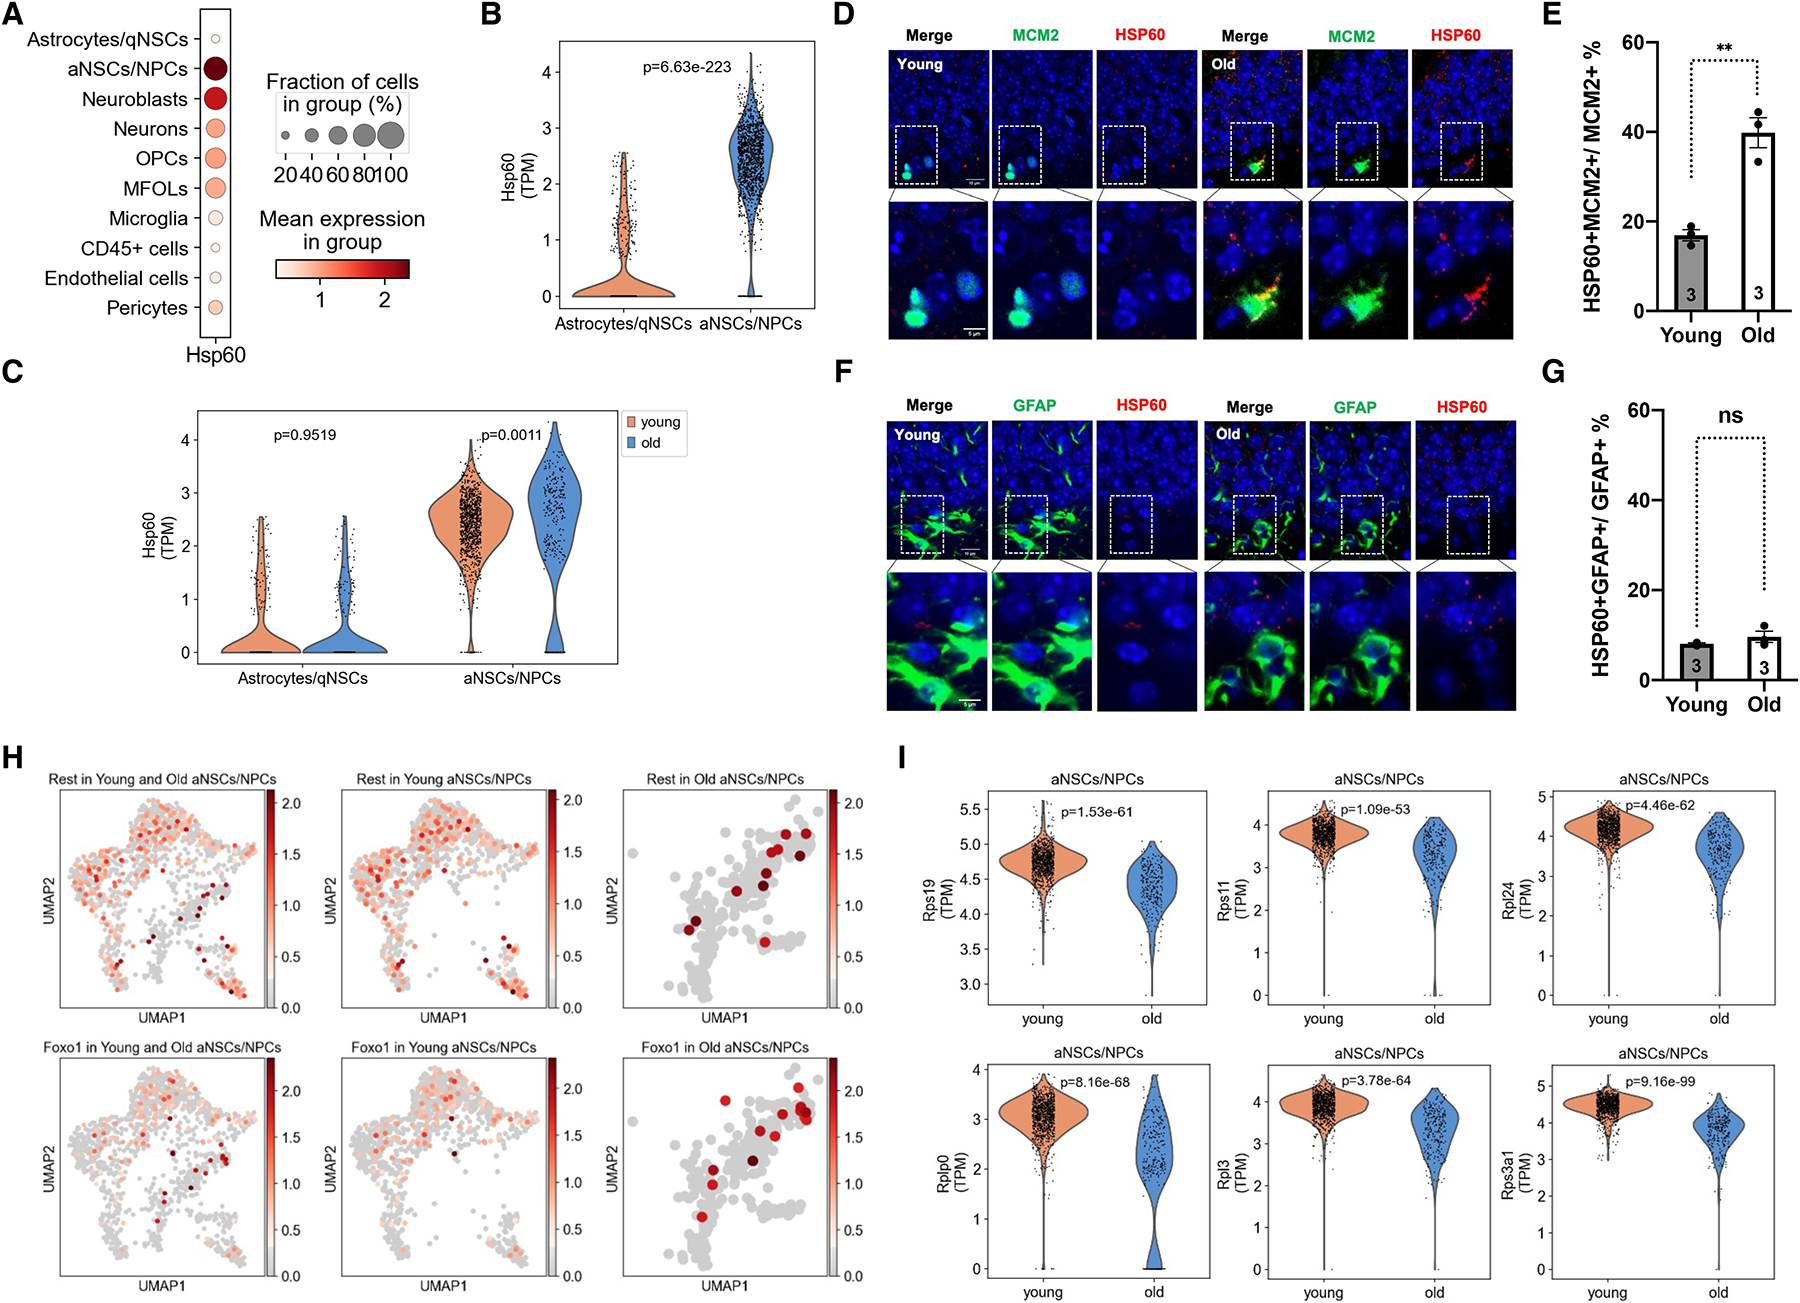
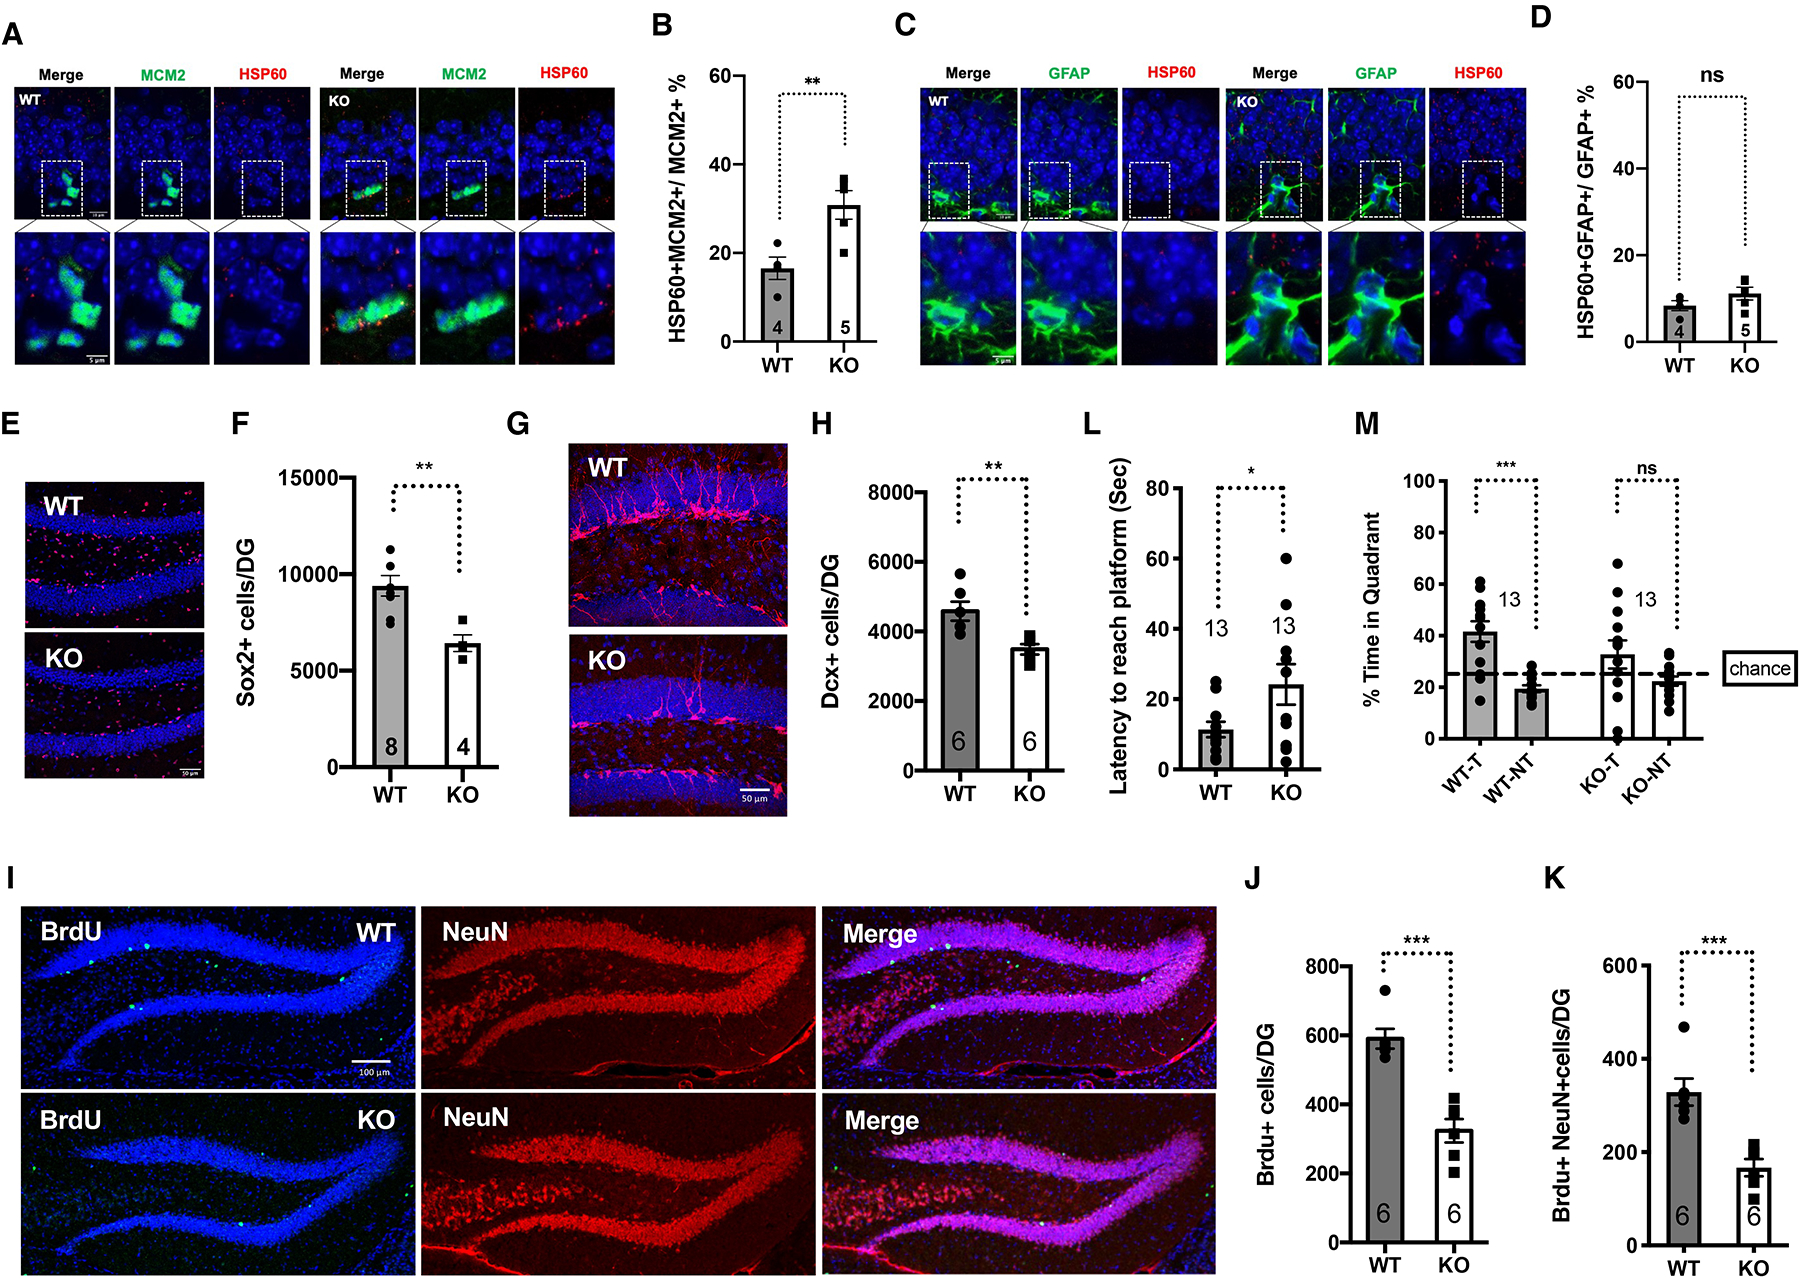
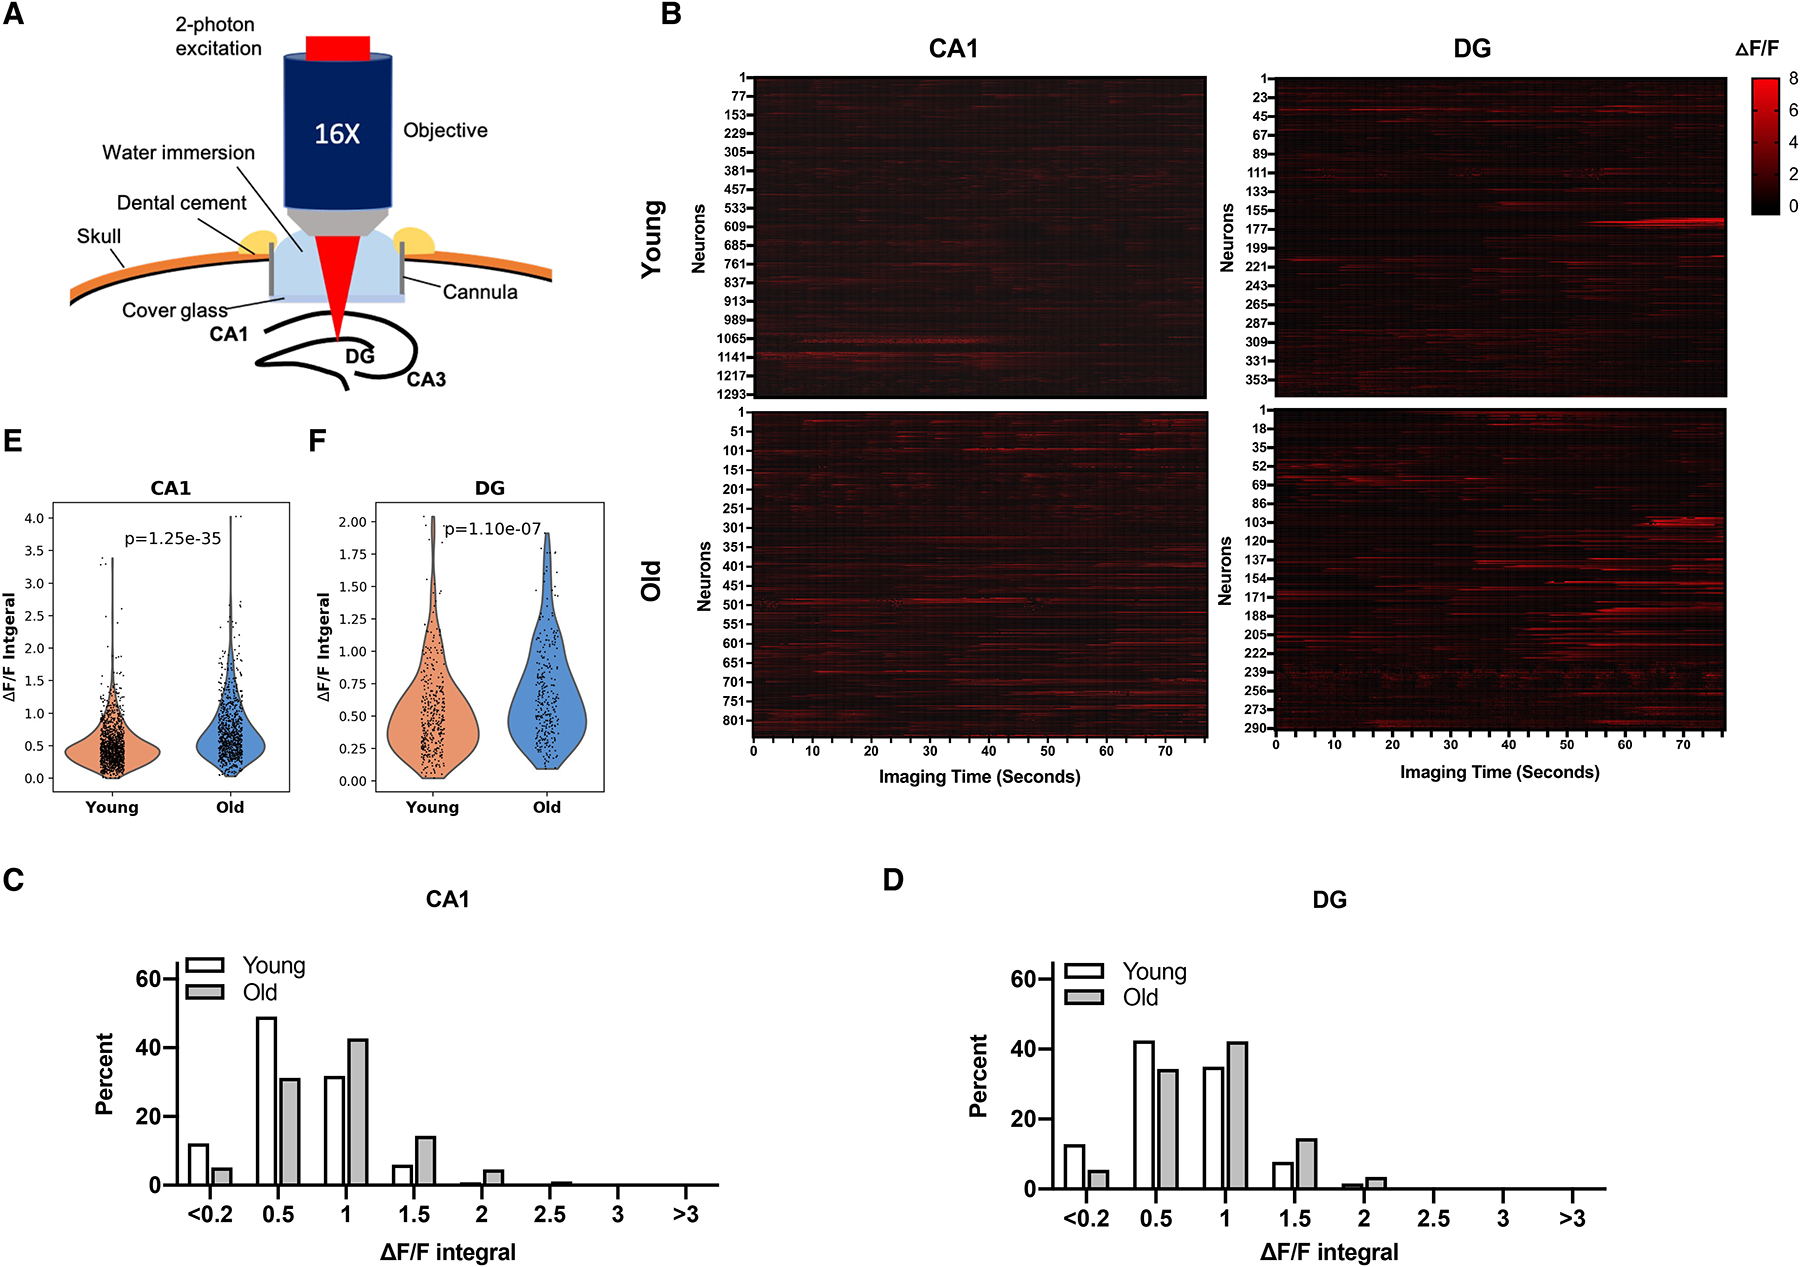
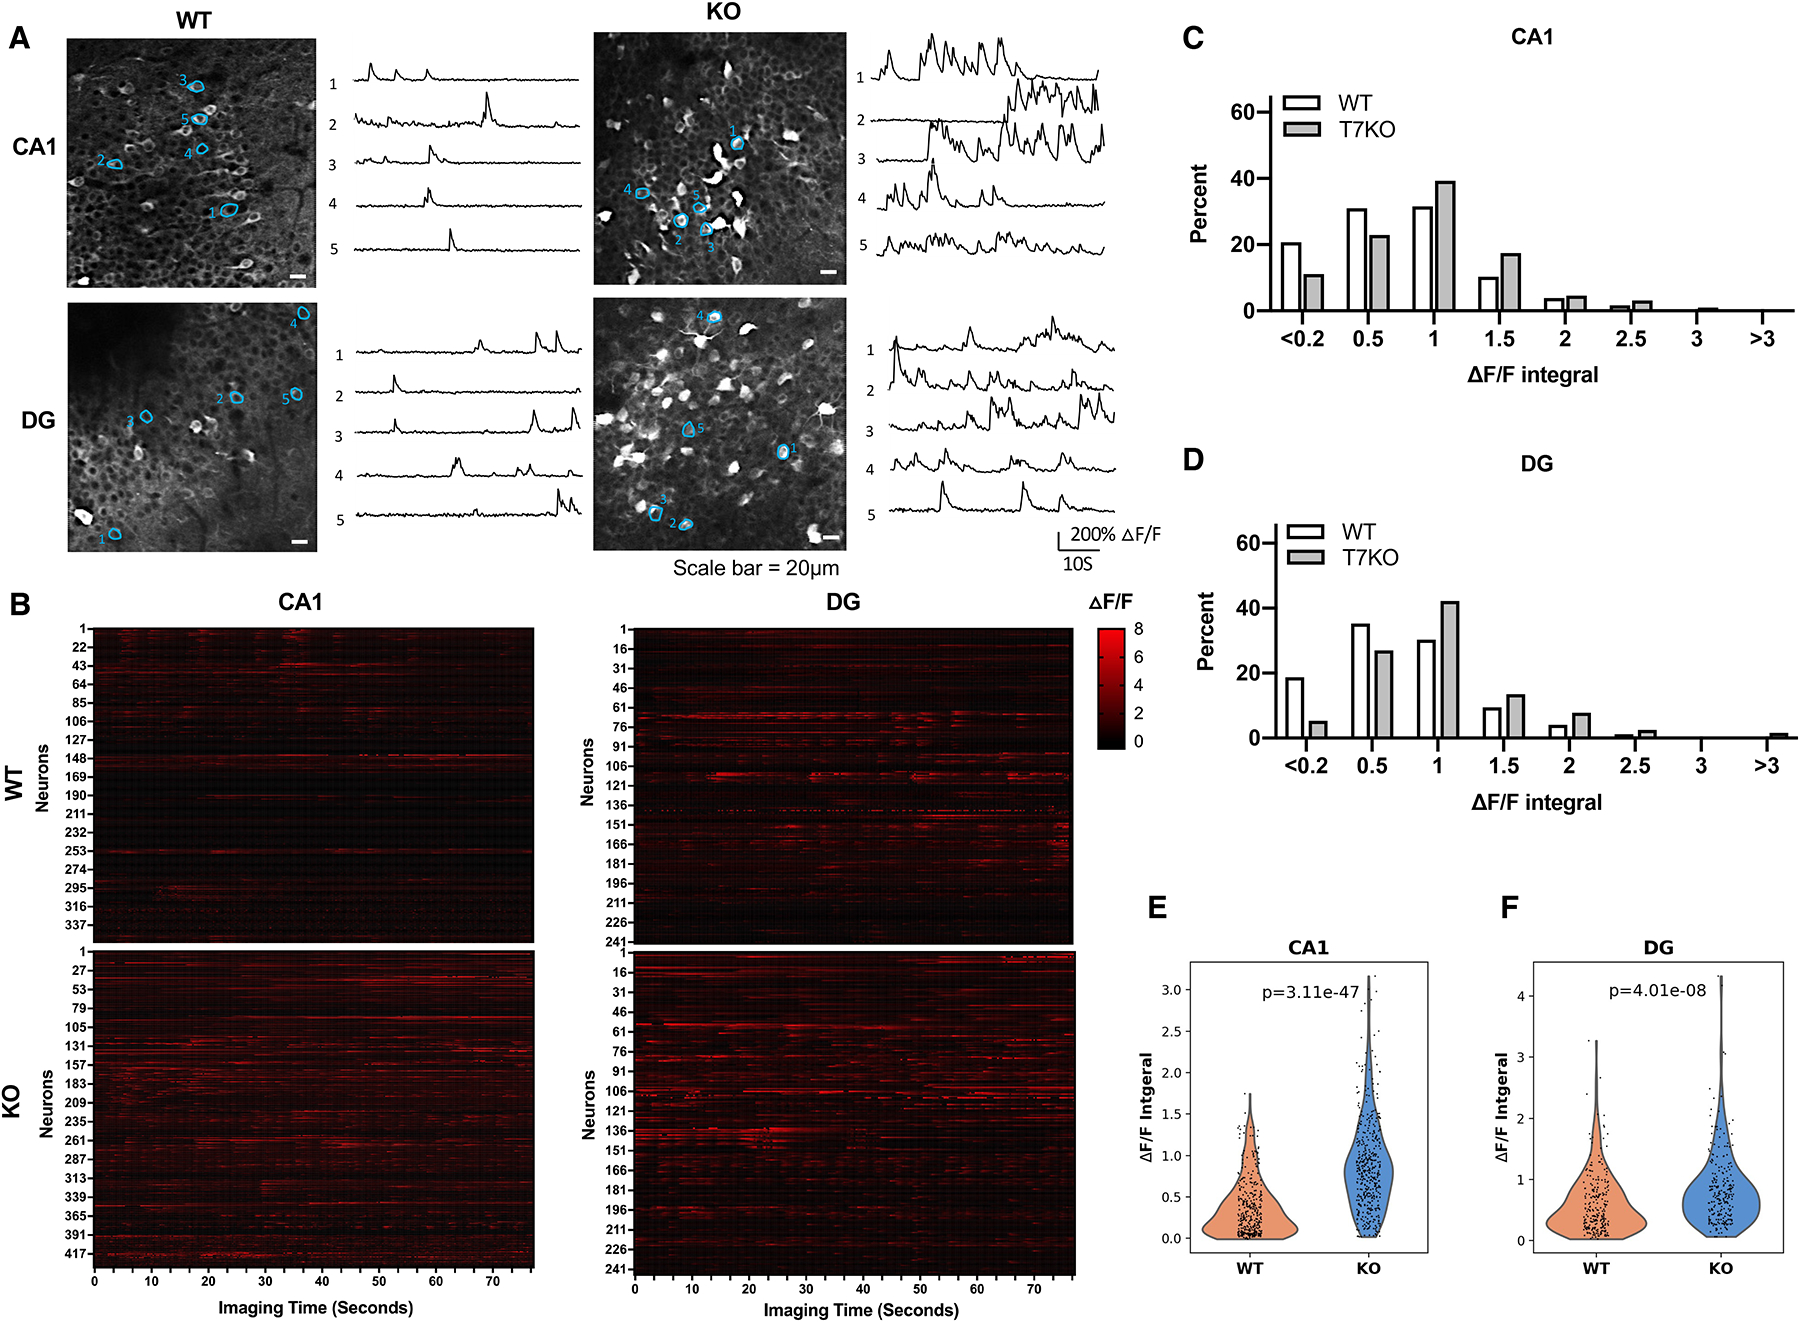
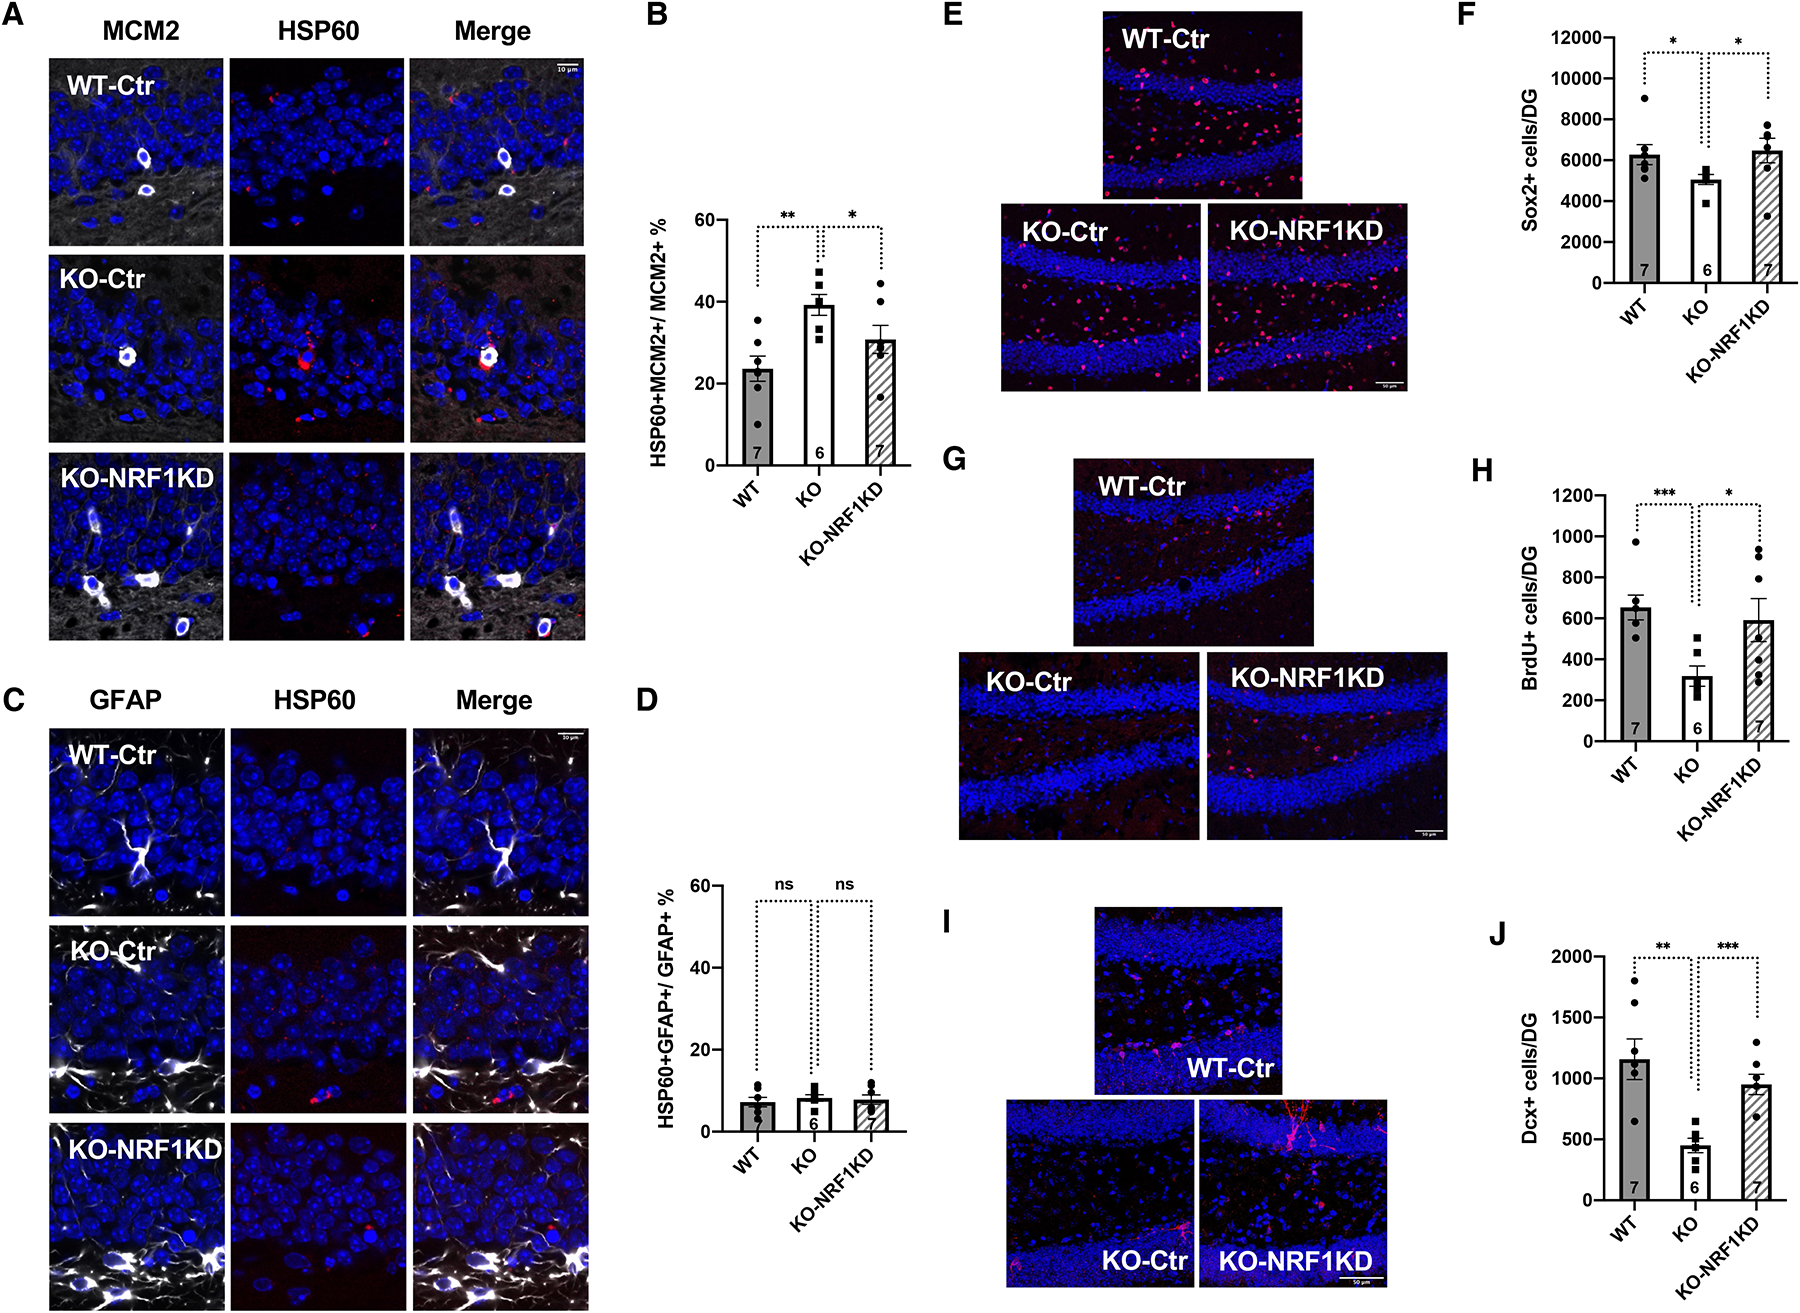
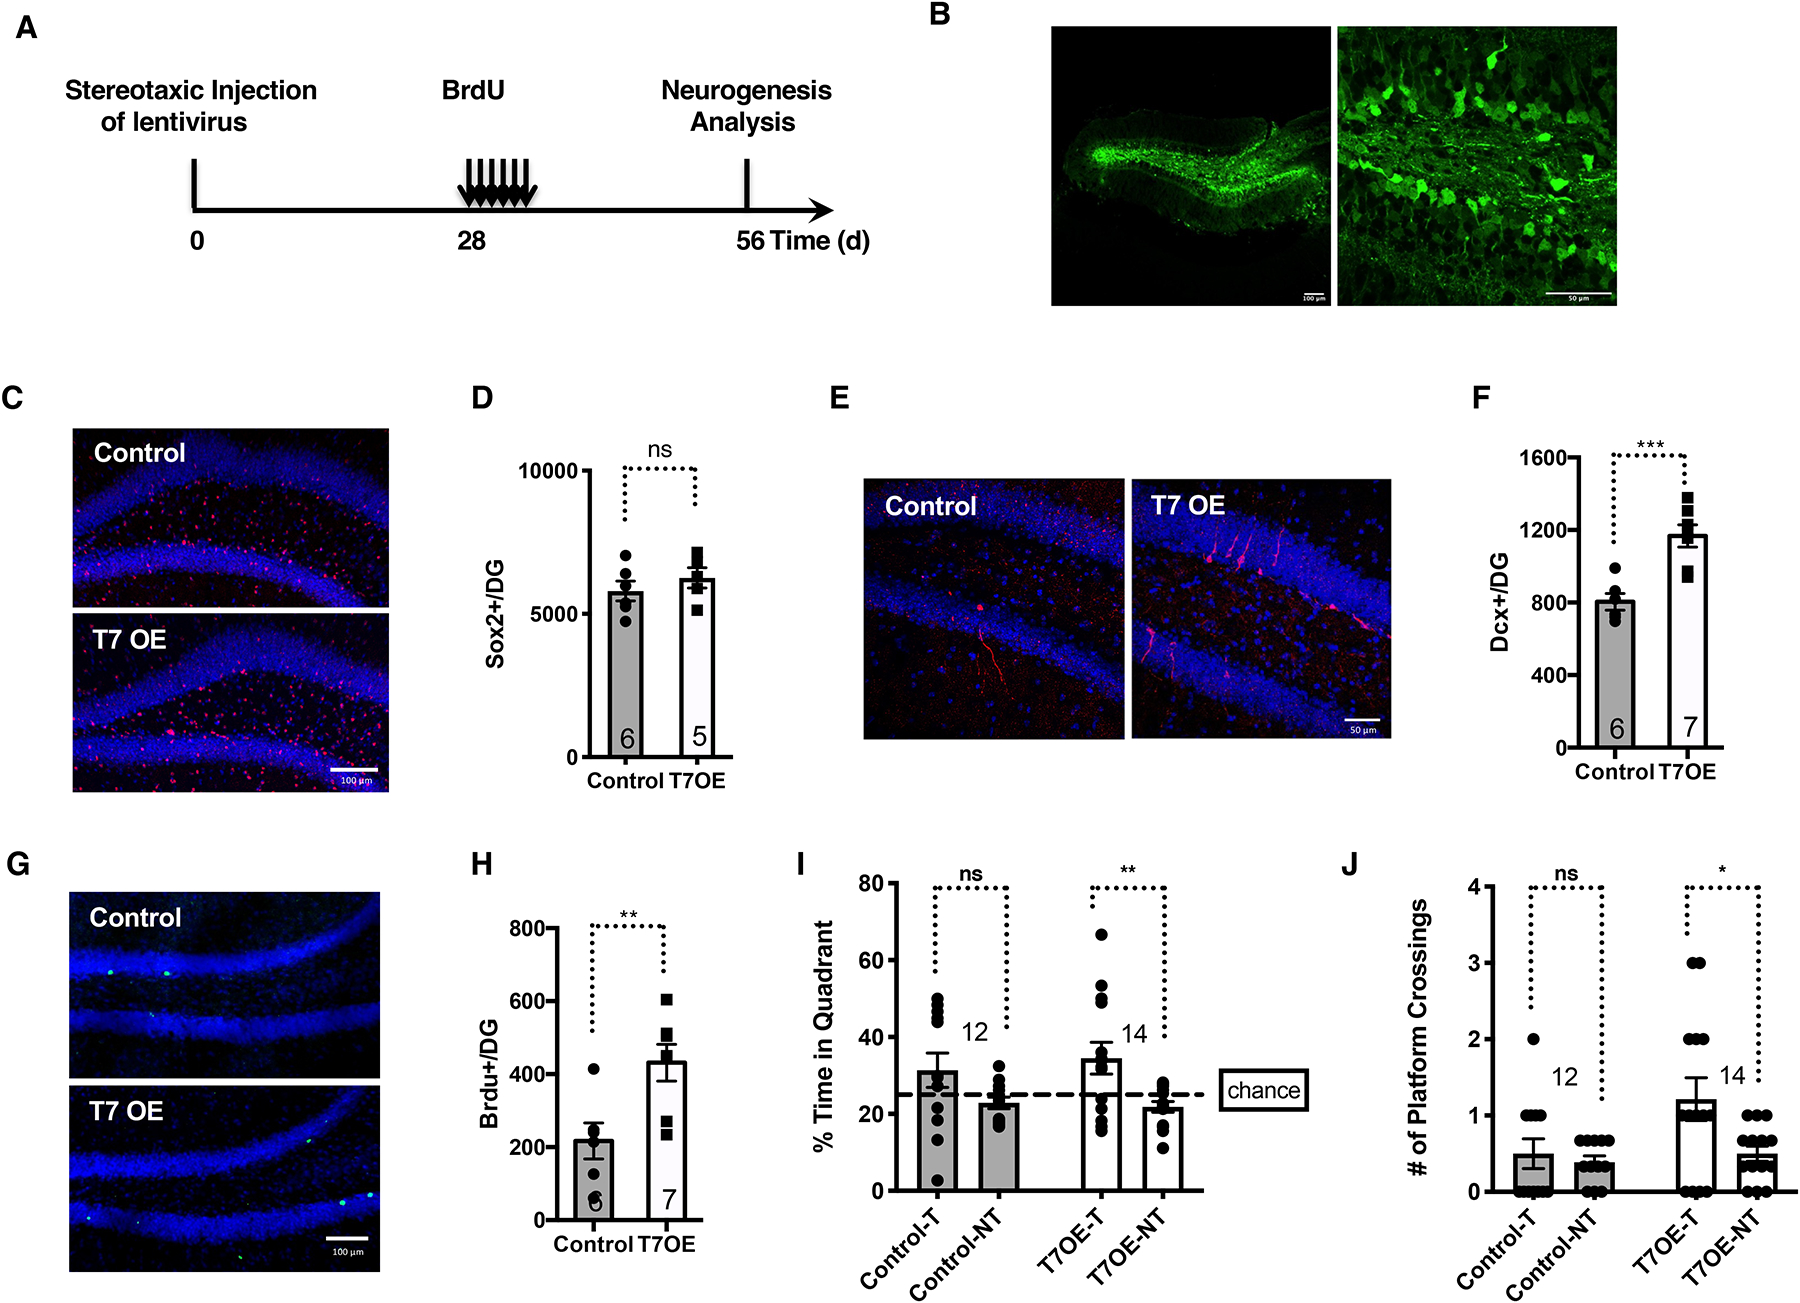
Aging results in a decline in neural stem cells (NSCs), neurogenesis, and cognitive function, and evidence is emerging to demonstrate disrupted adult neurogenesis in the hippocampus of patients with several neurodegenerative disorders. Here, single-cell RNA sequencing of the dentate gyrus of young and old mice shows that the mitochondrial protein folding stress is prominent in activated NSCs/neural progenitors (NPCs) among the neurogenic niche, and it increases with aging accompanying dysregulated cell cycle and mitochondrial activity in activated NSCs/NPCs in the dentate gyrus. Increasing mitochondrial protein folding stress results in compromised NSC maintenance and reduced neurogenesis in the dentate gyrus, neural hyperactivity, and impaired cognitive function. Reducing mitochondrial protein folding stress in the dentate gyrus of old mice improves neurogenesis and cognitive function. These results establish the mitochondrial protein folding stress as a driver of NSC aging and suggest approaches to improve aging-associated cognitive decline.

Keywords: SIRT1; SIRT2; SIRT3; SIRT6; SIRT7; cognitive aging; mitochondrial unfolded protein response; neural stem cell aging; sirtuin; stem cell aging.


Conflict of interest statement

Declaration of interests The authors declare no competing interests.

Figures

Figure 1.
Figure 1.
Aging results in increased mitochondrial and cell cycle gene expression in activated NSCs/NPCs of the dentate gyrus. A, Single-cell RNA-sequencing of the dentate gyrus of young (3 months old) and old (16 months old) male mice using the 10x Genomics Chromium platform. UMAP clustering of single cell transcriptomes (2463 cells from young and 1430 cells from old) colored by cell type (qNSCs: quiescent neural stem cells, aNSCs: activated neural stem cells, NPCs: neural progenitor cells, OPCs: oligodendrocyte progenitor cells, MFOLs: myelin-forming oligodendrocytes, and CD45+ cells: hematopoietic cells). n=4 mice/age. B, C, Pathway analysis for the biological functions of cluster-specific genes for astrocytes/quiescent NSCs (B) and activated NSCs/NPCs (C). D, E, Top 20 upregulated and top 20 downregulated genes in astrocytes/quiescent NSCs (D) and activated NSCs/NPCs (E) with age computed using MAST. Genes were classified as significant with a false-discovery rate less than 0.05. FC: fold change. F, Violin plots showing the expression of representative mitochondrial genes in activated NSCs/NPCs of the dentate gyrus of young (3 months old) and old (16 months old) mice. Each dot represents the gene expression levels in one cell. n=4 mice/age. Wilcoxon rank-sum test. G, Violin plots showing the expression of representative cell cycle genes in activated NSCs/NPCs of the dentate gyrus of young (3 months old) and old (16 months old) mice. Each dot represents the gene expression levels in one cell. n=4 mice/age. P values are false discovery rate-corrected, MAST differential expression test. H, Pathway analysis for the biological functions of differentially expressed genes in activated NSCs/NPCs in the dentate gyrus of young (3 months old) and old (16 months old) mice. See also Figure S1, Table S1, S2, S3.
Figure 2.
Figure 2.
Increased mitochondrial protein folding stress during NSC activation and aging in the dentate gyrus. A, Dot plot showing proportion of cells positive for HSP60 and log-normalized expression values of HSP60 in the cell clusters as indicated. B, C, Violin plots comparing log-normalized expression values of HSP60 in astrocytes/quiescent NSCs and activated NSCs/NPCs of young mice (B) and astrocytes/quiescent NSCs and activated NSCs/NPCs of young and old mice (C). Each dot represents the gene expression levels in one cell. Wilcoxon rank-sum test. D-G, Immunohistochemistry staining and quantification for HSP60 and MCM2 (D, E) and HSP60 and GFAP (F, G) in the dentate gyrus of young and old mice. Blue: DAPI. Red: HSP60. Green: MCM2 or GFAP. Scale bar: 10 μm (top). 5 μm (bottom). Error bars represent SE. **: p < 0.01. ns: p>0.05. Student’s t test. H, UMAP plots showing the expression of Rest and Foxo1 in activated NSCs/NPCs of the dentate gyrus of young (3 months old) and old (16 months old) mice. Each dot represents the gene expression levels in one cell. n=4 mice/age. I, Violin plots showing the differential expression of representative ribosomal proteins in activated NSCs/NPCs of the dentate gyrus of young (3 months old) and old (16 months old) mice. Each dot represents the gene expression levels in one cell. n=4 mice/age. Wilcoxon rank-sum test. See also Figure S2, S3, S4, S5, S6, Video S1, Table S4.
Figure 3.
Figure 3.
SIRT7 suppresses the mitochondrial protein folding stress and promotes NSC maintenance and cognition. Comparison of 3–5-month-old WT and SIRT7−/− mice. A-D, Immunohistochemistry staining and quantification of HSP60 and MCM2 (A, B) and HSP60 and GFAP (C, D) in the dentate gyrus. Blue: DAPI. Red: HSP60. Green: MCM2 or GFAP. Scale bar: 10 μm (top). 5 μm (bottom). E, F, Immunohistochemistry staining (E) and quantification (F) of Sox2-positive cells in the dentate gyrus. Blue: DAPI. Red: Sox2. Scale bar:50 μm. G, H, Immunohistochemistry staining (G) and quantification (H) of newly differentiated Doublecortin (Dcx)-positive neurons in the dentate gyrus. Blue: DAPI. Red: Dcx. Scale bar:50 μm. I-K, Immunohistochemistry staining (I) and quantification (J, K) of long-term BrdU-retaining cells in the dentate gyrus. Blue: DAPI. Green: BrdU. Red: NeuN. Scale bar:100 μm. L, M, Morris Water Maze test. Data shown are latency to reach the platform (L) and percent of time spent in the target and non-target quadrants (M) during probe testing for memory. T: target quadrant. NT: non-target quadrant. Error bars represent SE. *: p<0.05. **: p < 0.01. ***: p < 0.001. ns: p>0.05. Student’s t test. See also Figure S7, S8, S9, S10, Video S2.
Figure 4.
Figure 4.
Neural hyperactivity in the hippocampus of aged mice. A, Schematic illustration for two-photon imaging of the hippocampus. B-F, Young (3–5 months old) and old (16–18 months old) mice were subjected to stereotaxic injection in the dorsal dentate gyrus and CA1 with AAV1 expressing GCaMP6s and installation of a cranial window, and visualized using two-photon imaging. Data shown are raster plots of ΔF/F from all identified neurons (B), histograms of neural activity (integral of ΔF/F traces) (C, D), and violin plots of neural activity (Wilcoxon rank-sum test) (E, F). CA1, n= 1301 cells of 31 imaging area of six young mice and n=840 cells of 27 imaging area of four old mice; dentate gyrus, n=374 cells of 18 imaging area of four young mice and n=290 cells of 16 imaging area of four old mice. See also Figure S11.
Figure 5.
Figure 5.
SIRT7 suppresses neural hyperactivity. A-F, 4–6-month-old WT and SIRT7−/− mice were subjected to stereotaxic injection in the dorsal dentate gyrus and CA1 with AAV1 expressing GCaMP6s and installation of a cranial window, and visualized using two-photon imaging. Data shown are GCaMP6s fluorescence images and ΔF/F calcium transient traces of neurons (scale bar=20 μm) (A), raster plots of ΔF/F from all identified neurons (B), histogram distributions of neural activity (quantified as integral of ΔF/F traces) (C, D), and violin plots of neural activity (Wilcoxon rank-sum test) (E, F) of indicated brain regions. (CA1, n= 356 cells of 19 imaging areas of five WT mice and n=434 cells of 21 imaging areas of four SIRT7−/− mice; dentate gyrus, n=241 cells of 15 imaging areas of four WT mice and n=244 cells of 15 imaging areas of four SIRT7−/− mice). See also Figure S12.
Figure 6.
Figure 6.
SIRT7 promotes NSC maintenance by suppressing the mitochondrial protein folding stress. Comparison of 6–7-month-old WT and SIRT7−/− mice that were given stereotaxic injections of control lentivirus or lentivirus knocking down NRF1 into the dentate gyrus. A-D, Immunohistochemistry staining and quantification of MCM2 and HSP60 (A, B) and GFAP and HSP60 (C, D) in the dentate gyrus. Blue: DAPI. Red: HSP60. White: MCM2 or GFAP. Scale bar: 10 μm. E, F, Immunohistochemistry staining (E) and quantification (F) of Sox2-positive cells in the dentate gyrus. Blue: DAPI. Red: Sox2. Scale bar: 50 μm. G, H, Immunohistochemistry staining (G) and quantification (H) of long-term BrdU-retaining cells in the dentate gyrus. Blue: DAPI. Red: BrdU. Scale bar: 50 μm. I, J, Immunohistochemistry staining (I) and quantification (J) of newly differentiated Dcx-positive neurons in the dentate gyrus. Blue: DAPI. Red: Dcx. Scale bar: 50 μm. Error bars represent SE. *: p<0.05. **: p < 0.01. ***: p<0.001. ns: p>0.05. Student’s t test. See also Figure S13, S14, S15, Video S3.
Figure 7.
Figure 7.
SIRT7 overexpression in the dentate gyrus improves neurogenesis and cognitive function of aged brains. Comparison of 10-month-old mice that were given stereotaxic injections of control lentivirus or lentivirus expressing SIRT7 into the dentate gyrus. A, Schematic illustration of the experimental timeline. B, GFP expression in mice given stereotaxic injections of GFP lentivirus into the dentate gyrus. Scale bar: 100 μm (left) and 50 μm (right). C, D, Immunohistochemistry staining (C) and quantification (D) of Sox2-positive cells in the dentate gyrus. Blue: DAPI. Red: Sox2. Scale bar:100 μm. E, F, Immunohistochemistry staining (E) and quantification (F) of newly differentiated Dcx-positive neurons in the dentate gyrus. Blue: DAPI. Red: Dcx. Scale bar:50 μm. G, H, Immunohistochemistry staining (G) and quantification (H) of long-term BrdU-retaining cells in the dentate gyrus. Blue: DAPI. Green: BrdU. Scale bar:100 μm. I, J, Morris Water Maze test. Data shown are percent of time spent in the target and non-target quadrants (I) and the number of platform crossings in the target and non-target quadrants (J) during probe testing for memory. T: target quadrant. NT: non-target quadrant. Error bars represent SE. *: p<0.05. **: p < 0.01. ***: p < 0.001. ns: p>0.05. Student’s t test.

Comment in

References

    1. Lopez-Otin C, Blasco MA, Partridge L, Serrano M, and Kroemer G (2013). The hallmarks of aging. Cell 153, 1194–1217. 10.1016/j.cell.2013.05.039. - DOI - PMC - PubMed
    1. Vijg J, and Campisi J (2008). Puzzles, promises and a cure for ageing. Nature 454, 1065–1071. 10.1038/nature07216. - DOI - PMC - PubMed
    1. Costa-Mattioli M, and Walter P (2020). The integrated stress response: From mechanism to disease. Science 368. 10.1126/science.aat5314. - DOI - PMC - PubMed
    1. Zhou BB, and Elledge SJ (2000). The DNA damage response: putting checkpoints in perspective. Nature 408, 433–439. 10.1038/35044005. - DOI - PubMed
    1. Fang EF, Scheibye-Knudsen M, Chua KF, Mattson MP, Croteau DL, and Bohr VA (2016). Nuclear DNA damage signalling to mitochondria in ageing. Nat Rev Mol Cell Biol 17, 308–321. 10.1038/nrm.2016.14. - DOI - PMC - PubMed

Publication types