. 2023 May 25;186(11):2380-2391.e9.
doi: 10.1016/j.cell.2023.04.024. Epub 2023 Apr 21.

ESCRT recruitment to SARS-CoV-2 spike induces virus-like particles that improve mRNA vaccines

Affiliations

ESCRT recruitment to SARS-CoV-2 spike induces virus-like particles that improve mRNA vaccines

Magnus A G Hoffmann et al. Cell. .

Abstract

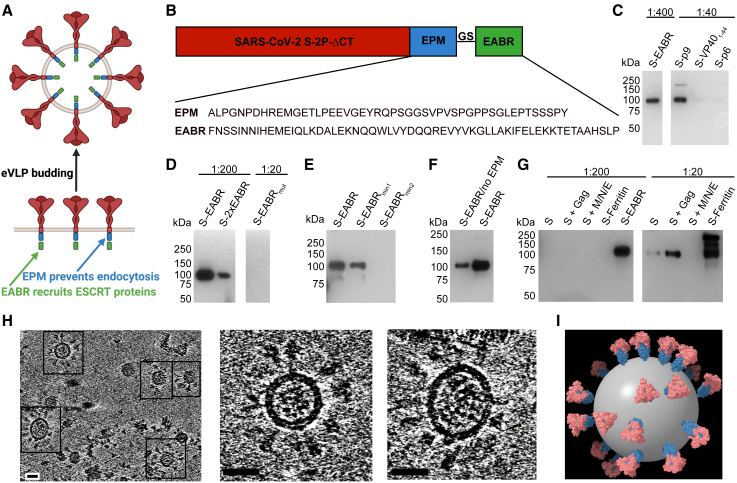
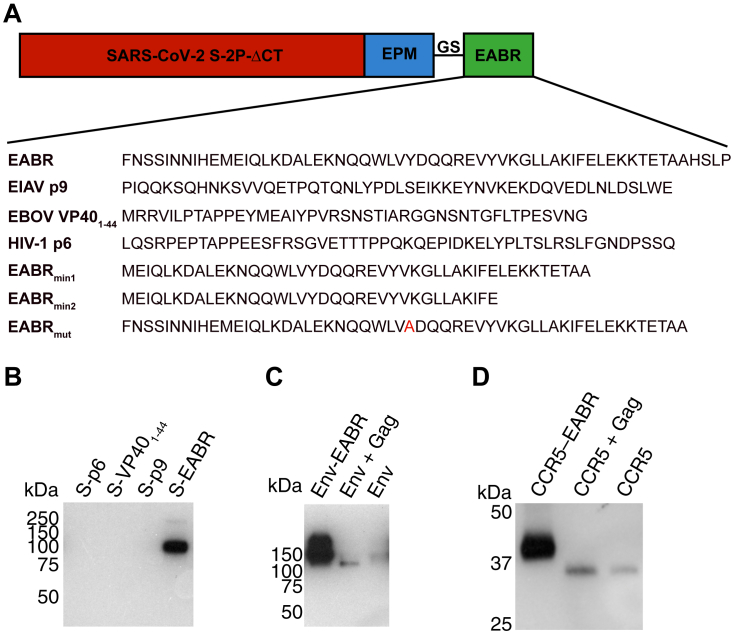
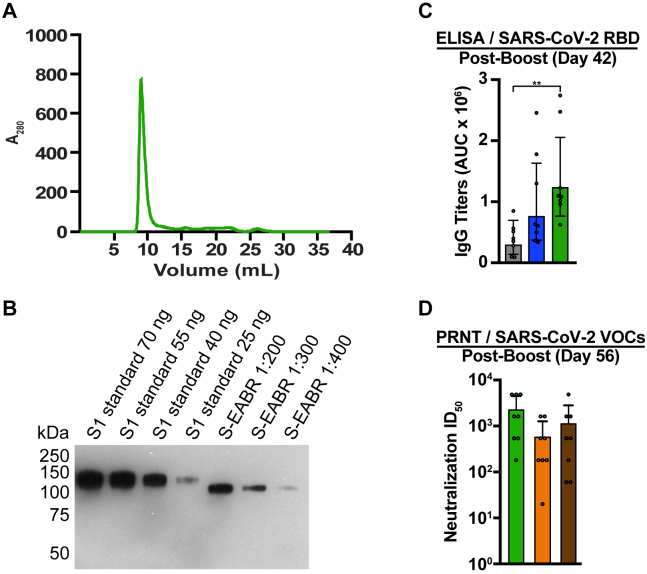
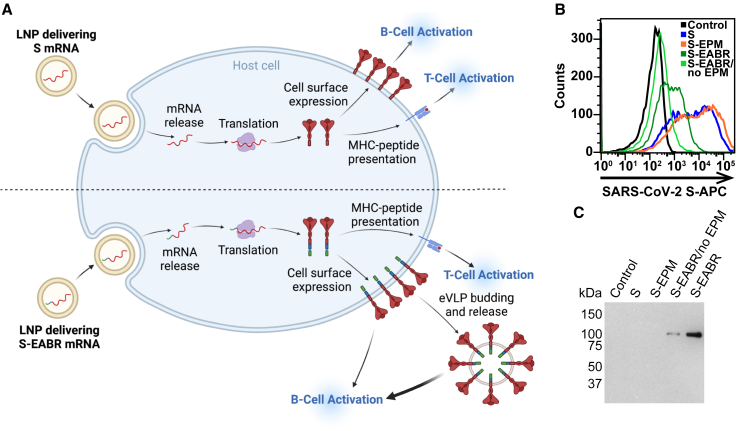
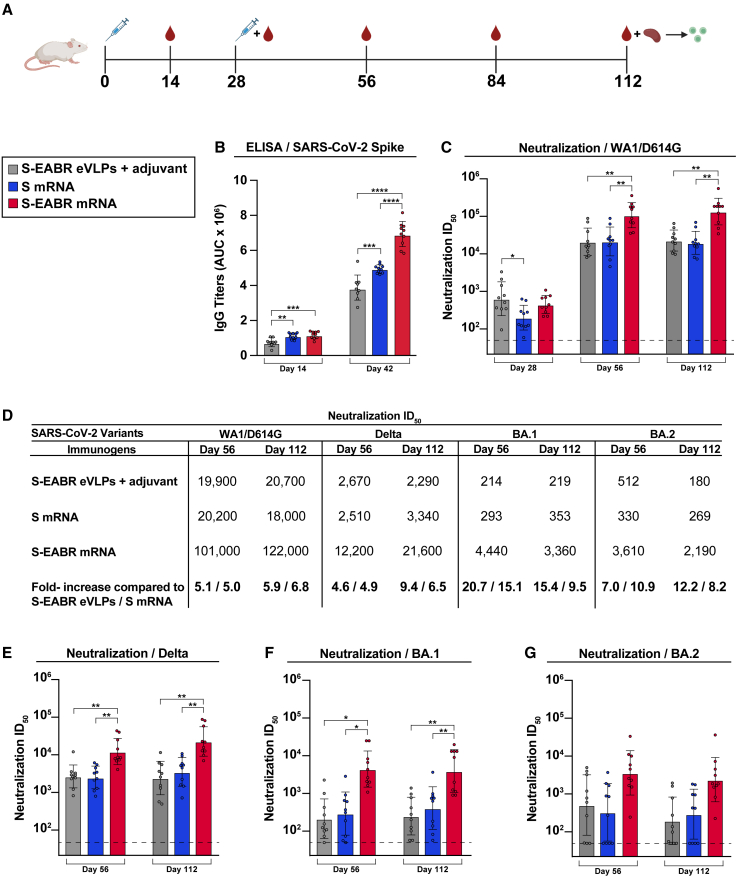
Prime-boost regimens for COVID-19 vaccines elicit poor antibody responses against Omicron-based variants and employ frequent boosters to maintain antibody levels. We present a natural infection-mimicking technology that combines features of mRNA- and protein nanoparticle-based vaccines through encoding self-assembling enveloped virus-like particles (eVLPs). eVLP assembly is achieved by inserting an ESCRT- and ALIX-binding region (EABR) into the SARS-CoV-2 spike cytoplasmic tail, which recruits ESCRT proteins to induce eVLP budding from cells. Purified spike-EABR eVLPs presented densely arrayed spikes and elicited potent antibody responses in mice. Two immunizations with mRNA-LNP encoding spike-EABR elicited potent CD8+ T cell responses and superior neutralizing antibody responses against original and variant SARS-CoV-2 compared with conventional spike-encoding mRNA-LNP and purified spike-EABR eVLPs, improving neutralizing titers >10-fold against Omicron-based variants for 3 months post-boost. Thus, EABR technology enhances potency and breadth of vaccine-induced responses through antigen presentation on cell surfaces and eVLPs, enabling longer-lasting protection against SARS-CoV-2 and other viruses.

Keywords: ESCRT; SARS-CoV-2; mRNA vaccines; nanoparticles.


Conflict of interest statement

Declaration of interests M.A.G.H. and P.J.B. are inventors on a US patent application filed by the California Institute of Technology that covers the EABR technology described in this work. W.J.M. and P.J.C.L. are employees of Acuitas Therapeutics, a company developing LNP delivery technology; P.J.C.L. holds equity in Acuitas Therapeutics.

Figures

None
Graphical abstract
Figure 1
Figure 1
EABR insertion into the cytoplasmic tail of membrane proteins results in eVLP budding and release (A) Schematic of membrane-bound SARS-CoV-2 S proteins on the cell surface containing cytoplasmic tail EPM and EABR insertions that induce budding of an eVLP comprising a lipid bilayer with embedded S proteins. (B) Sequence information for S-EABR construct. Top: the SARS-CoV-2 S protein (including a furin cleavage site, 2P stabilizing substitutions, the D614G substitution, and ΔCT, a cytoplasmic tail deletion) is fused to an EPM sequence, a (Gly)3Ser (GS) spacer, and an EABR sequence. EPM, endocytosis prevention motif; GS, (Gly)3Ser linker; EABR, ESCRT- and ALIX-binding region. Bottom: EPM and EABR sequence information. (C–G) Western blot analysis detecting SARS-CoV-2 S1 protein on eVLPs purified by ultracentrifugation on a 20% sucrose cushion from transfected Expi293F cell culture supernatants. (C) Cells were transfected with S-EABR, S-p9, S-VP401–44, or S-p6 constructs. The purified S-EABR eVLP sample was diluted 1:400 (left), while S-p9, S-VP401–44, and S-p6 samples were diluted 1:40 (right). Comparison of band intensities between lanes suggests that the S-EABR eVLP sample contained ∼10-fold higher levels of S1 protein than the S-p9 sample and >10-fold higher levels than the S-VP401–44 and S-p6 samples. (D) Cells were transfected with S-EABR, S-2xEABR (left), or S-EABRmut constructs (right). Purified S-EABR and S-2xEABR eVLP samples were diluted 1:200, while the S-EABRmut sample was diluted 1:20. (E) Cells were transfected with S-EABR, S-EABRmin1, or S-EABRmin2 constructs. Purified eVLP samples were diluted 1:200. (F) Cells were transfected with S-EABR/no EPM or S-EABR constructs. Purified eVLP samples were diluted 1:200. (G) Cells were transfected to express S alone, S plus the HIV-1 Gag protein, S plus the SARS-CoV-2 M, N, and E proteins, an S-ferritin fusion protein, or S-EABR. Purified eVLP samples were diluted 1:200 (left) or 1:20 (right). Comparison of band intensities between lanes suggests that the S-EABR eVLP sample contained >10-fold higher levels of S1 protein than S alone, S plus Gag, and S plus M, N, and E. (H) Computationally derived tomographic slices (8.1 nm) of S-EABR eVLPs derived from cryo-ET imaging of S-EABR eVLPs purified from transfected cell culture supernatants by ultracentrifugation on a 20% sucrose cushion and SEC. Left: representative eVLPs are highlighted in boxes. Middle and right: close ups of individual eVLPs. Scale bars, 30 nm. (I) Model of a representative S-EABR eVLP derived from a cryo-ET reconstruction (Video S1). Coordinates of an S trimer (PDB: 6VXX) were fit into protruding density on the best resolved half of an eVLP and the remainder of the eVLP was modeled assuming a similar distribution of trimers. The position of the lipid bilayer is shown as a 55-nm gray sphere. See also Figure S1 and Video S1.
Figure S1
Figure S1
Comparison of EABR-related sequence insertions in the cytoplasmic tail of SARS-CoV-2 S, related to Figure 1 (A) Top: schematic of different S-EABR constructs that were compared for their ability to induce eVLP assembly. EPM, endocytosis prevention motif; GS, (Gly)3Ser linker; EABR, ESCRT- and ALIX-binding region. Bottom: amino acid sequences of EABR portion of different constructs. (B) Western blot analysis of SARS-CoV-2 S1 protein levels on eVLPs purified by ultracentrifugation on a 20% sucrose cushion from transfected Expi293F cell culture supernatants. Cells were transfected with S-p6, S-VP401–44, S-p9, or S-EABR constructs. Purified eVLP samples were diluted 1:400. (C) Western blot analysis comparing HIV-1 EnvYU2 levels in eVLP samples purified from transfected Expi293F cell culture supernatants. Cells were transfected with plasmids encoding Env-EABR, Env plus HIV-1 Gag, or Env alone. Purified eVLP samples were diluted 1:200. (D) Western blot analysis comparing CCR5 levels in eVLP samples purified from transfected Expi293F cell culture supernatants. Cells were transfected with plasmids encoding CCR5-EABR, CCR5 plus HIV-1 Gag, or CCR5 alone. Purified eVLP samples were diluted 1:200. The migration difference between CCR5-EABR and CCR5 is due to addition of the EABR sequence (∼7 kDa) that increases its molecular mass.
Figure 2
Figure 2
Purified S-EABR eVLPs induce potent antibody responses in mice (A) Immunization schedule. C57BL/6 mice were immunized with soluble S (purified S trimer) (gray), S-mi3 (S trimer ectodomains covalently attached to mi3, a 60-mer protein nanoparticle) (blue), or S-EABR eVLPs (red). (B and C) ELISA and neutralization data from the indicated time points for antisera from individual mice (colored circles) presented as the geometric mean (bars) and standard deviation (horizontal lines). ELISA results are shown as area under the curve (AUC); neutralization results are shown as half-maximal inhibitory dilutions (ID50 values). Dashed horizontal lines correspond to the background values representing the limit of detection for neutralization assays. Significant differences between cohorts linked by horizontal lines are indicated by asterisks: p < 0.05; ∗∗p < 0.01; ∗∗∗p < 0.001. See also Figure S2.
Figure S2
Figure S2
Purified S-EABR eVLPs induce potent antibody responses in mice, related to Figure 2 (A) Size exclusion chromatogram of S-EABR eVLPs purified by ultracentrifugation on a 20% sucrose cushion. (B) Quantitative western blot comparing indicated amounts of SARS-CoV-2 S1 standards (lanes 1–4) and various dilutions of purified S-EABR eVLPs (lanes 5–7) to determine S protein concentrations in eVLP samples. The S1 standard protein (Sino Biological) was biotinylated and contained a polyhistidine tag, which resulted in a difference in apparent molecular weights for the S1 standards and the S-EABR construct. Band intensities of S1 standards and S-EABR eVLP sample dilutions were measured using ImageJ to determine S concentrations. (C) ELISA data from day 42 for antisera from individual mice (colored circles) immunized with soluble S (purified S trimer) (gray), S-mi3 (S trimer ectodomains covalently attached to mi3, a 60-mer protein nanoparticle) (blue), or S-EABR eVLPs (green). Results are shown as area under the curve (AUC) and presented as the geometric mean (bars) and standard deviation (horizontal lines). Significant differences between cohorts linked by horizontal lines are indicated by asterisks: p < 0.05; ∗∗p < 0.01. (D) PRNT assay results from day 56 for antisera from individual mice (colored circles) immunized with S-EABR eVLPs. Results against the SARS-CoV-2 WA1 (green), Beta (orange), and Delta (brown) variants are shown as TCID50 values and presented as the geometric mean (bars) and standard deviation (horizontal lines).
Figure 3
Figure 3
mRNA-mediated delivery of the S-EABR construct results in cell surface expression and eVLP assembly (A) Schematic comparison of mRNA-LNP delivery of S (as in COVID-19 mRNA vaccines) (top) versus delivery of an S-EABR construct (bottom). Both approaches generate S peptides displayed on class I MHC molecules for CD8+ T cell recognition and result in presentation of S antigens on cell surfaces. The S-EABR approach also results in budding and release of eVLPs displaying S antigens. (B) Flow cytometry analysis of SARS-CoV-2 S cell surface expression on HEK293T cells that were untransfected (black) or transfected with mRNAs encoding S (blue), S-EPM (orange), S-EABR (dark green), or S-EABR/no EPM (light green) constructs. (C) Western blot analysis of eVLPs purified by ultracentrifugation on a 20% sucrose cushion from supernatants from the transfected cells in (B). Purified eVLP samples were diluted 1:10.
Figure 4
Figure 4
mRNA-LNP encoding S-EABR eVLPs induce potent antibody responses in mice (A) Immunization schedule. BALB/c mice were immunized with purified S-EABR eVLPs (1 μg S protein) plus adjuvant (gray), 2 μg of mRNA-LNP encoding S (blue), or 2 μg of mRNA-LNP encoding S-EABR (red). On day 112, spleens were harvested from immunized mice for ELISpot analysis. (B) ELISA data from the indicated time points for antisera from individual mice (colored circles) presented as the geometric mean (bars) and standard deviation (horizontal lines). ELISAs evaluated binding of SARS-CoV-2 S trimers; results are shown as area under the curve (AUC). (C) Neutralization data from the indicated time points for antisera from individual mice (colored circles) presented as the geometric mean (bars) and standard deviation (horizontal lines). Neutralization results against SARS-CoV-2 WA1/D614G pseudovirus are shown as geometric mean half-maximal inhibitory dilutions (ID50 values). Dashed horizontal lines correspond to the background values representing the limit of detection for neutralization assays. (D) Neutralization data from indicated time points for antisera presented as ID50 values against SARS-CoV-2 WA1/D614G, Delta, Omicron BA.1, and Omicron BA.2 pseudoviruses. Bottom horizontal row shows the fold increases for geometric mean ID50 values for mice that received S-EABR mRNA-LNP compared with mice that received purified S-EABR eVLPs or S mRNA-LNP. (E–G) Neutralization data from the indicated time points for antisera from individual mice (colored circles) presented as the geometric mean (bars) and standard deviation (horizontal lines). Neutralization results against SARS-CoV-2 Delta (E), Omicron BA.1 (F), and Omicron BA.2 (G) pseudoviruses are shown as ID50 values. Dashed horizontal lines correspond to the background values representing the limit of detection for neutralization assays. Significant differences between cohorts linked by horizontal lines are indicated by asterisks: p < 0.05; ∗∗p < 0.01; ∗∗∗p < 0.001; ∗∗∗∗p < 0.0001.
Figure 5
Figure 5
mRNA-LNP encoding S-EABR eVLPs induce potent T cell responses in mice (A and B) ELISpot assay data for SARS-CoV-2 S-specific INF-γ (A) and IL-4 (B) responses of splenocytes from BALB/c mice that were immunized with purified S-EABR eVLPs (1 μg S protein) plus adjuvant (gray), 2 μg of mRNA-LNP encoding S (blue), or 2 μg of mRNA-LNP encoding S-EABR (red). Results are shown as spots per 3 × 105 cells (left) and mean spot sizes (right) for individual mice (colored circles) presented as the mean (bars) and standard deviation (horizontal lines). Significant differences between cohorts linked by horizontal lines are indicated by asterisks: p < 0.05; ∗∗p < 0.01; ∗∗∗p < 0.001; ∗∗∗∗p < 0.0001.

Update of

Comment in

References

    1. Corbett K.S., Edwards D.K., Leist S.R., Abiona O.M., Boyoglu-Barnum S., Gillespie R.A., Himansu S., Schäfer A., Ziwawo C.T., DiPiazza A.T., et al. SARS-CoV-2 mRNA vaccine design enabled by prototype pathogen preparedness. Nature. 2020;586:567–571. - PMC - PubMed
    1. Zheng C., Shao W., Chen X., Zhang B., Wang G., Zhang W. Real-world effectiveness of COVID-19 vaccines: a literature review and meta-analysis. Int. J. Infect. Dis. 2022;114:252–260. - PMC - PubMed
    1. Chen Y., Zhao X., Zhou H., Zhu H., Jiang S., Wang P. Broadly neutralizing antibodies to SARS-CoV-2 and other human coronaviruses. Nat. Rev. Immunol. 2023;23:189–199. - PMC - PubMed
    1. Polack F.P., Thomas S.J., Kitchin N., Absalon J., Gurtman A., Lockhart S., Perez J.L., Pérez Marc G., Moreira E.D., Zerbini C., et al. Safety and efficacy of the BNT162b2 mRNA Covid-19 vaccine. N. Engl. J. Med. 2020;383:2603–2615. - PMC - PubMed
    1. Baden L.R., El Sahly H.M., Essink B., Kotloff K., Frey S., Novak R., Diemert D., Spector S.A., Rouphael N., Creech C.B., et al. Efficacy and safety of the mRNA-1273 SARS-CoV-2 vaccine. N. Engl. J. Med. 2021;384:403–416. - PMC - PubMed

Publication types