. 2023 May;11(5):e006581.
doi: 10.1136/jitc-2022-006581.

Androgen receptor blockade resistance with enzalutamide in prostate cancer results in immunosuppressive alterations in the tumor immune microenvironment

Affiliations

Androgen receptor blockade resistance with enzalutamide in prostate cancer results in immunosuppressive alterations in the tumor immune microenvironment

Pengfei Xu et al. J Immunother Cancer. 2023 May.

Abstract

Background: Emerging data suggest that patients with enzalutamide-treated prostate cancer with increased programmed death-ligand 1 (PD-L1) expression may benefit from anti-PD-L1 treatment. Unfortunately, the Phase III IMbassador250 clinical trial revealed that the combination of atezolizumab (a PD-L1 inhibitor) and enzalutamide failed to extend overall survival in patients with castration-resistant prostate cancer (CRPC). However, the mechanisms underlying treatment failure remain unknown.

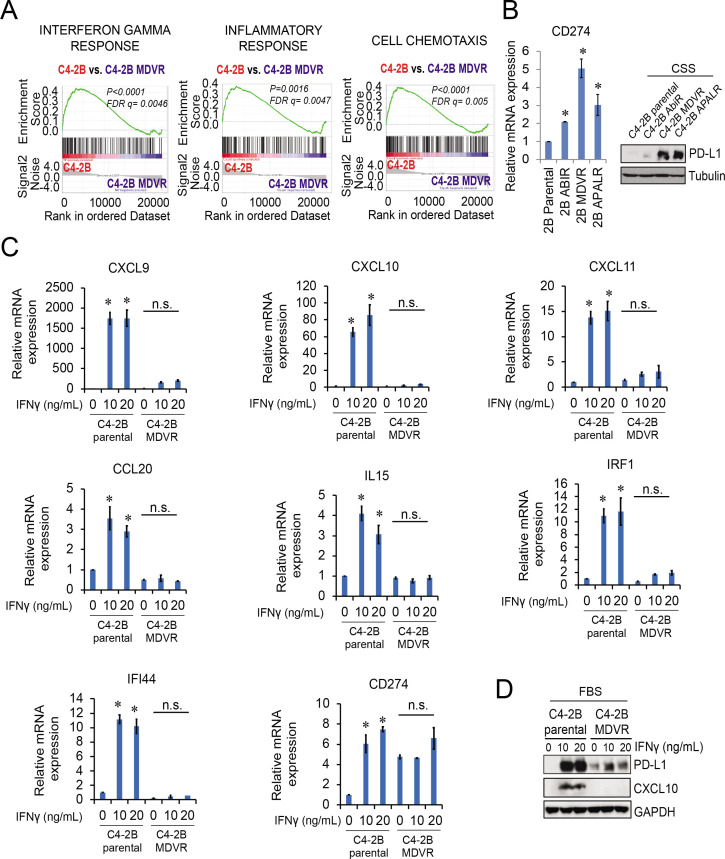
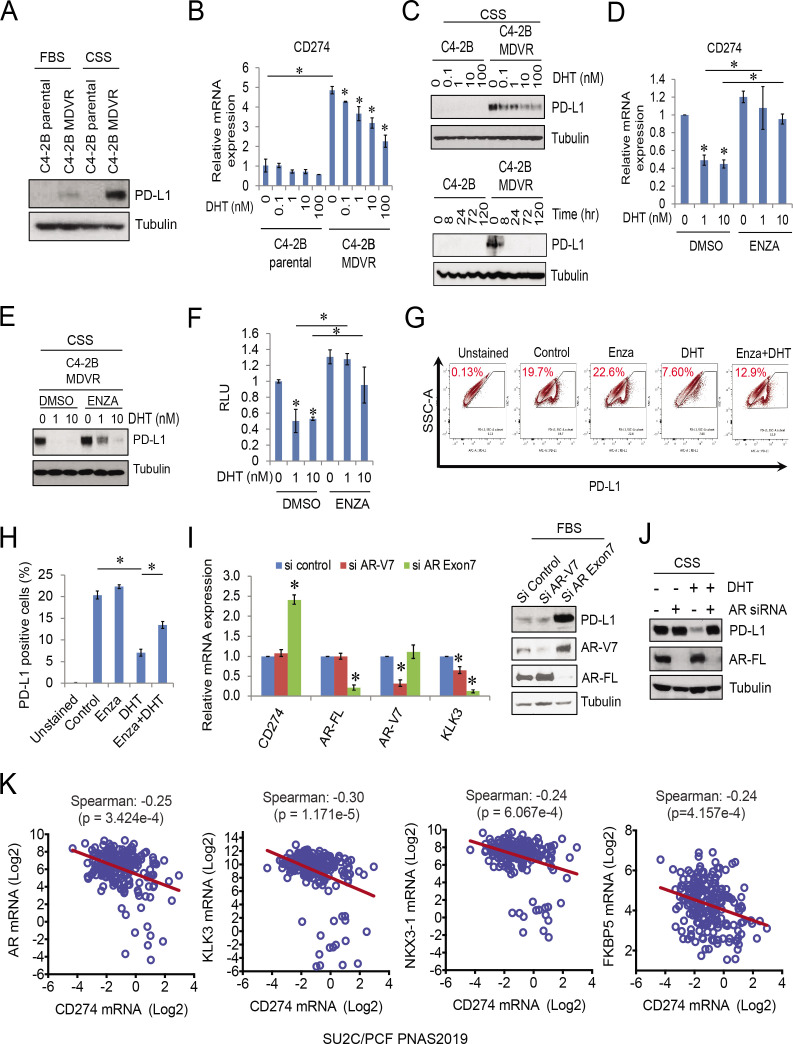
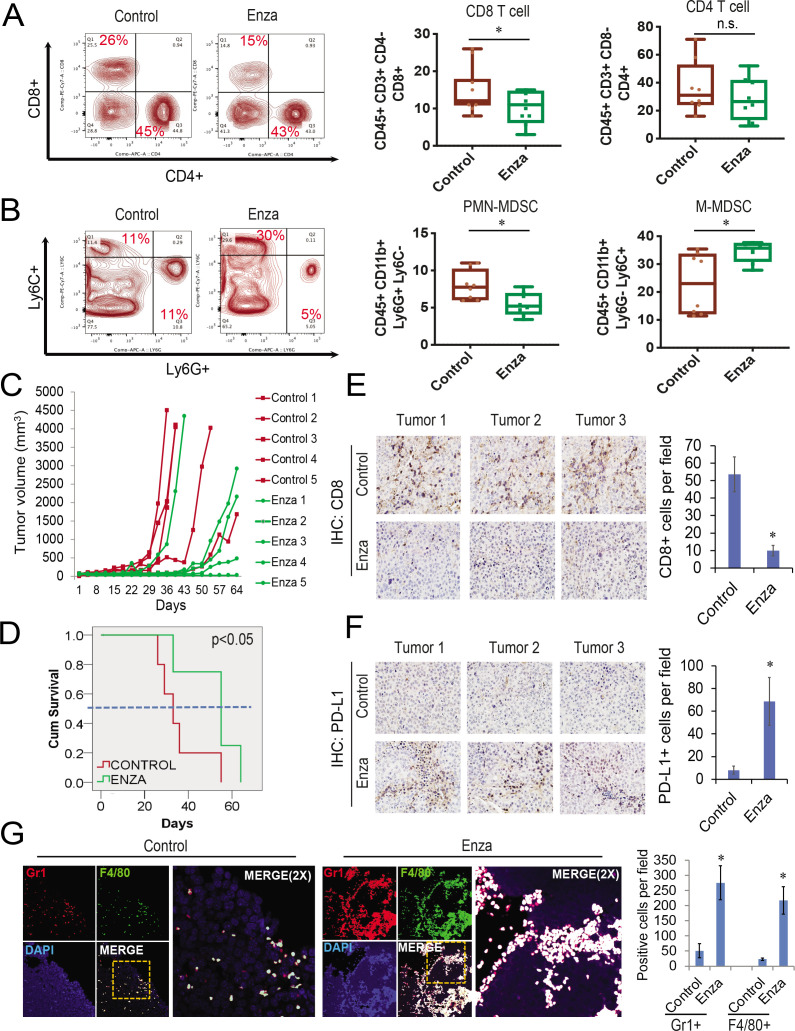
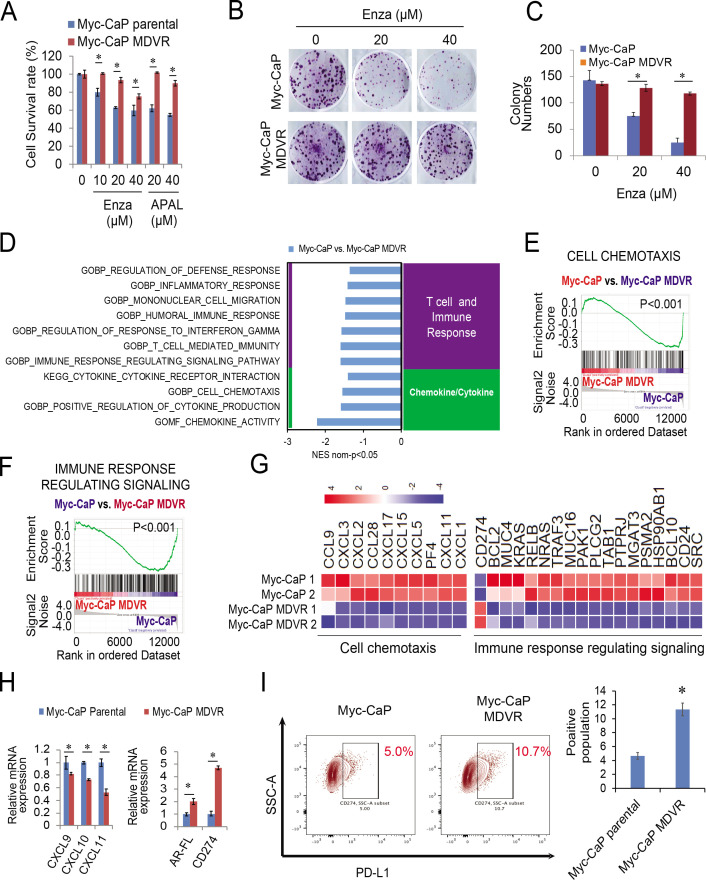
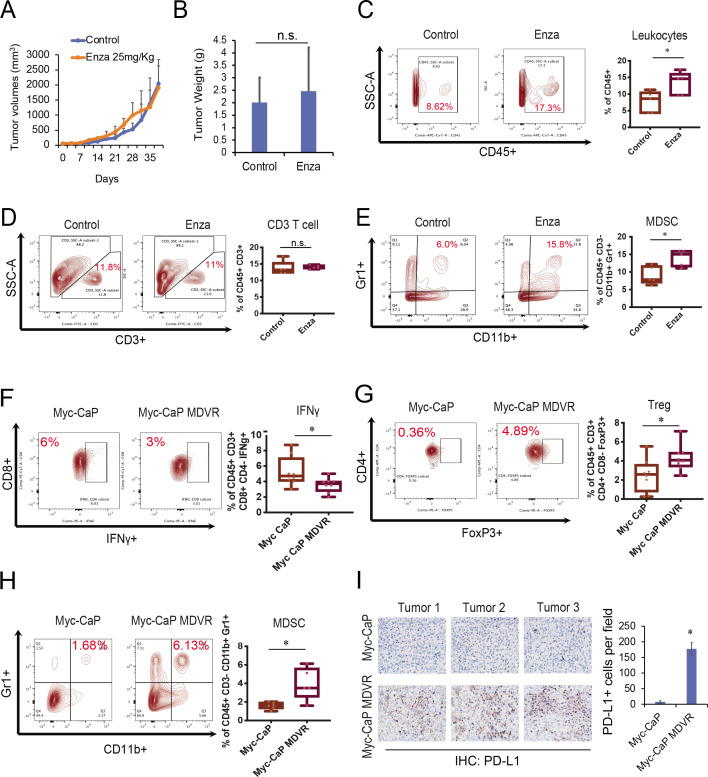
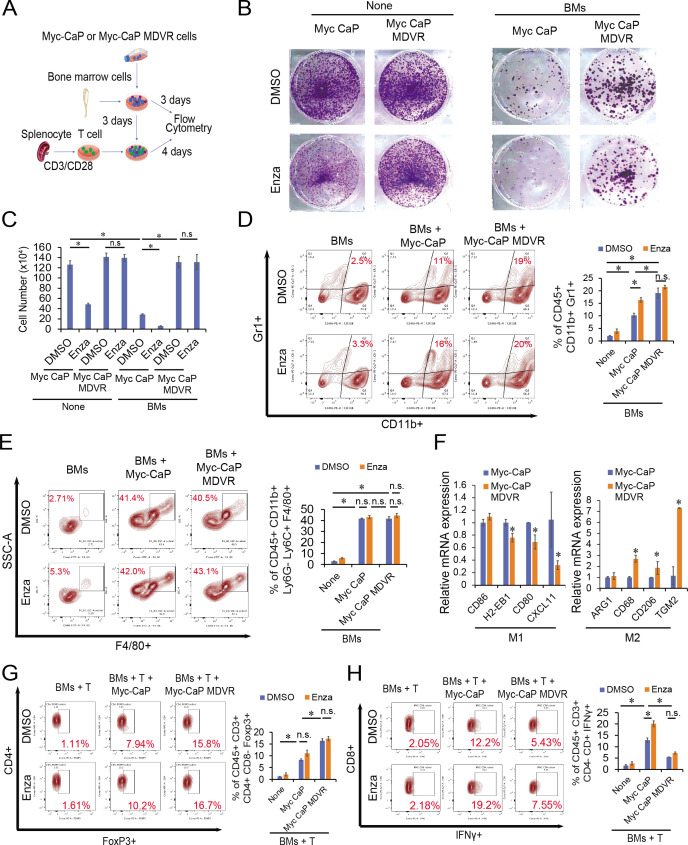
Methods: Human CRPC C4-2B cells and murine Myc-CaP cells were chronically exposed to increasing concentrations of enzalutamide and the cells resistant to enzalutamide were referred to as C4-2B MDVR and Myc-CaP MDVR, respectively. The mechanisms of action in drug-resistant prostate cancer cells were determined using RNA sequencing analyses, RNA interference, real-time PCR, western blotting, and co-culturing technologies. Myc-CaP and Myc-CaP MDVR tumors were established in syngeneic FVB mice, and tumor-infiltrating leukocytes were isolated after enzalutamide treatment. The stained immune cells were determined by flow cytometry, and the data were analyzed using FlowJo.

Results: Immune-related signaling pathways (interferon alpha/gamma response, inflammatory response, and cell chemotaxis) were suppressed in human enzalutamide-resistant prostate cancer cells. PD-L1 was overexpressed and negatively regulated by androgen receptor signaling in resistant cells and patient with CRPC cohorts. Enzalutamide treatment decreased CD8+ T-cell numbers but increased monocytic myeloid-derived suppressor cell (M-MDSC) populations and PD-L1 expression within murine Myc-CaP tumors. Similarly, chemotaxis and immune response-regulating signaling pathways were suppressed, and PD-L1 expression was also increased using enzalutamide-resistant Myc-CaP MDVR cells. Notably, MDSC populations were significantly increased in Myc-CaP MDVR orthotopic tumors compared with those in Myc-CaP parental tumors. Co-culturing bone marrow cells with Myc-CaP MDVR cells significantly promoted MDSC differentiation and shifted towards M2 macrophage skewing.

Conclusions: Our study suggests that immunosuppressive signaling can be promoted directly by enzalutamide-resistant prostate cancer cells and may be a potential means by which the efficacy of immune checkpoint inhibitors in enzalutamide-resistant prostate cancer is diminished.

Keywords: Drug Therapy, Combination; Immune Evation; Programmed Cell Death 1 Receptor; Prostatic Neoplasms; Tumor Microenvironment.


Conflict of interest statement

Competing interests: No, there are no competing interests.

Figures

Figure 1
Figure 1
Immunosuppressive signaling is activated in ARSI-resistant prostate cancer. (A) RNA sequencing data from C4-2B parental and C4-2B MDVR cells was analyzed using GSEA. The IFN-γ response, inflammatory response, and cell chemotaxis pathways showed suppression of a significant enrichment of immune-related signaling in C4-2B MDVR compared with the parental cells. (B) C4-2B ARSI-resistant cells, AbiR, MDVR, and ApalR, were examined for the PD-L1 mRNA and protein expression by RT-qPCR and western blotting, respectively. (C) C4-2B parental and MDVR cells were stimulated with IFN-γ (0, 10, 20 ng/mL) and total RNA extracted for RT-qPCR to assess the mRNA expression of several key genes (CXCL9, CXCL10, CXCL11, CCL20, IL15, CD274, IRF1 and IFI44) from the IFN-γ response and T-cell activation pathway. (D) Whole cell lysates from C4-2B parental and MDVR cells treated with IFNγ (0, 10, 20 ng/mL) for 3 days were collected and subjected to western blotting analysis for PD-L1 and CXCL10 protein expression. *p<0.05. ARSI, androgen receptor signaling inhibitor; CSS, charcoal-stripped FBS; FBS, fetal bovine serum; FDR, false discovery rate; GSEA, gene sets enrichment analysis; IFN, interferon; IL, interleukin; mRNA, messenger RNA; PD-L1, programmed death-ligand 1; RT-qPCR, quantitative real-time PCR.
Figure 2
Figure 2
AR negatively regulates expression of PD-L1 in enzalutamide-resistant prostate cancer. (A) C4-2B parental and MDVR cells were collected after grown in FBS and CSS growth media for 3 days and subjected to immunoblotting analysis using antibodies against PD-L1. (B) Total RNA extracted from C4-2B parental and MDVR cells treated with different doses (0, 0.1, 1, 10, or 100 nM) of DHT for 3 days and the level of PD-L1 expression was assessed by RT-qPCR. (C) Total cell lysates from C4-2B parental and MDVR cells after 3-day treatment with various concentrations (0, 0.1, 1, 10, or 100 nM) of DHT or 10 nM of DHT for different length of time (0, 8, 24, 72, or 120 hours) were immunoblotted with anti-PD-L1 antibodies. (D) C4-2B MDVR cells after DHT (0, 1, or 10 nM) treatment alone or with addition of enzalutamide (20 µM) for 3 days were examined for the PD-L1 RNA expression by RT-qPCR. (E) C4-2B MDVR cells were treated with DHT (0, 1, or 10 nM) in the absence or presence of enzalutamide (20 µM) for 3 days. The whole cell lysates were collected for western blot analysis probed for the PD-L1 protein expression. (F) C4-2B MDVR cells were transiently transfected with PD-L1-Luc (0.5 µg) followed by DHT alone or in combination with enzalutamide. Cell lysates were harvested 3 days after transfection and assayed for the luciferase activity. (G–H) C4-2B MDVR cells maintained in CS medium were treated with enzalutamide (20 µM) DHT (10 nM) or in combination for 3 days and the expression of surface PD- L1 was assessed by flow cytometric analysis. Percentage of PD-L1 positive cells were numerated in a figure format. Cells void of PD-L1 antibody were used as the unstained control. (I) Total RNA were extracted from C4-2B MDVR cells transfected with siControl, siAR-V7 or siAR-FL and the expression levels of CD274, AR-FL, AR-V7, and KLK3 were determined by RT-qPCR. A duplicate set of cells transfected with siControl, siAR-V7 or siAR-FL were harvested at the end of treatments and subjected to western blot analysis for PD-L1, AR-FL and AR-V7 protein levels. (J) Total lysates from C4-2B MDVR cells transfected with or without siAR-FL and treated with or without 10 nM DHT were examined for PD-L1 and AR protein expression by western blots. (K) Expression of AR, KLK3, NKX3-1, and FKBP5 were correlated with that of CD274 in SU2C/PCF patient cohort. *p<0.05. AR, androgen receptor; AR-FL, full-length AR; CSS, charcoal-stripped FBS; DHT, dihydrotestosterone; FBS, fetal bovine serum; mRNA, messenger RNA; PD-L1, programmed death-ligand 1; SU2C/PCF, Stand Up to Cancer/Prostate Cancer Foundation; RT-qPCR, quantitative real-time PCR.
Figure 3
Figure 3
Enzalutamide treatment affects tumor infiltrating cells in Myc-CaP tumors. (A–B) Tumor infiltrating cells from Myc-CaP tumors grown in FVB mice treated with vehicle only or enzalutamide (25 mg/kg, orally, 5 days/week) were isolated and incubated with fluorophores-conjugated antibodies to determine the CD4+ T cell (CD45+CD3+CD4+CD8), CD8+ T cell (CD45+CD3+CD4CD8+), PMN-MDSC (CD45+CD11b+Ly6G+Ly6Clow), and M-MDSC (CD45+CD11b+Ly6GLy6Chigh) using flow cytometry. The output histograms were analyzed by FlowJo software and the percentage of population between sublines were plotted. The gating strategy was shown in online supplemental figure 3. (C) FVB mice were injected with 0.5×10⁶ Myc-CaP cells subcutaneously and then treated with vehicle only or enzalutamide (25 mg/kg, orally, 5 days/week). Tumor progression was monitored by the measurement with a caliper biweekly to calculate tumor volumes. The tumor carried mouse was sacrificed when tumor volume reached around 4000 mm3. (D) Kaplan-Meier curves showing survival benefits of enzalutamide treatment in Myc-CaP tumors (tumor size >500 mm3 set up as end event). (E–F) IHC staining of representative tumor sections from the control or enzalutamide treatment groups (2 months treatment) with specific CD8 or PD-L1 antibodies. Numbers of CD8 or PD-L1 positive cells between the control and enzalutamide groups were counted in multiple fields and plotted. (G) Immunofluorescent staining of representative tumor sections from the control or enzalutamide treatment groups (2 months treatment) with specific Gr1 (red) and F4/80 (green) antibodies. All nuclei were stained with DAPI and the merged micrograms showed the compiled staining of Gr1, F4/80, and DAPI. Gr1 or F4/80 positive cells in multiple fields were numerated and compared between the control and enzalutamide groups. *p<0.05. IHC, immunohistochemistry; M-MDSC, monocytic myeloid-derived suppressor cell; PMN, Polymorphonuclear neutrophils; PMN-MDSC, polymorphonuclermyeloid-derived suppressor cell, PD-L1, programmed death-ligand 1.
Figure 4
Figure 4
Enzalutamide resistance causes the suppression of immune signaling pathways in Myc-CaP MDVR cells. (A) Myc-CaP parental and MDVR cells were treated with enzalutamide (0, 10, 20, 40 µM) and apalutamide (20, 40 µM) for 3 days and the cell viability was examined for the cell survival rate. (B–C) Myc-CaP parental and MDVR cells were treated with enzalutamide (20 and 40 µM) for clonogenic assays, and colony numbers were compared. (D) RNA extracted from Myc-CaP parental and MDVR cells were subjected to sequencing analysis followed by the GSEA to identify pathways enriched or downregulated between the two sublines. (E–F) Two representative enrichment plots of immune-related pathways by GSEA. (G) The heatmaps of cell chemotaxis and immune response regulating signaling were plotted using R. (H) Total RNA was isolated from Myc-CaP parental and MDVR cells and the gene expression of CXCL9, CXCL10 and CXCL11, AR, and PD-L1 were compared using RT-qPCR. (I) The population of Myc-CaP and Myc-CaP MDVR cells expressing PD-L1 on the surface was analyzed by flow cytometry. *p<0.05. GSEA, gene sets enrichment analysis; mRNA, messenger RNA; PD-L1, programmed death-ligand 1; RT-qPCR, quantitative real-time PCR.
Figure 5
Figure 5
MDSC populations are elevated in Myc-CaP MDVR tumors. (A) FVB mice were subcutaneously injected with 1×10⁶ of Myc-CaP MDVR cells and treated with vehicle only or enzalutamide (25 mg/kg, orally, 5 days per week). Tumor progression was monitored by biweekly measurement and represented by tumor volumes versus days post injections. (B) Tumor weights at the end of the experiment. (C–E) Tumor infiltrating cells were isolated and incubated with fluorophores-conjugated antibodies to determine the total leukocytes (CD45+), total T cells (CD45+CD3+), and MDSC (CD45+CD3-GD11b+Gr1+) population using flow cytometry. The output histograms were analyzed by FlowJo software and the percentage of population between sublines were plotted. (F–H) Tumor infiltrating cells from Myc-CaP and Myc-CaP MDVR orthotopic tumors were isolated respectively and incubated with fluorophores-conjugated antibodies to determine the IFN-γ from CD8+ T cells, Treg cells, and MDSC (CD45+CD3-GD11b+Gr1+) population using flow cytometry. The output histograms were analyzed by FlowJo software and the percentage of population between sublines were plotted. (I) IHC staining of PD-L1 in three representative Myc-CaP parental and MDVR tumors. PD-L1 positive cells were counted and compared. *p<0.05. IFN, interferon; IHC, immunohistochemistry; PD-L1, programmed death-ligand 1; Treg, regulatory T cell.
Figure 6
Figure 6
MDSC and macrophage differentiation are regulated by Myc-CaP MDVR cells. (A) Scheme shows the preparation of tumor (Myc-CaP and Myc-CaP MDVR), BMs (from bone marrow flush) and T (from spleen) cells to constitute the co-culture admixture. (B–C) Myc-CaP parental and MDVR cells were alone or co-cultured with BMs in the absence or presence of enzalutamide and incubated for 4 days for clonogenic staining and cell survival (by cell counting). (D) The control and enzalutamide-treated BMs and tumor co-cultured admixtures were analyzed by flow cytometry for MDSC (CD45+CD11b+Gr1+) populations. The percentage of the MDSC population was compared. (E) BMs alone or co-cultured with Myc-CaP parental or Myc-CaP MDVR cells treated with or without enzalutamide were gated for macrophage differentiation. The percentage of the macrophage population was compared. (F) Total RNA extracted from RAW264.7 co-cultured with Myc-CaP parental or MDVR cells in the absence or presence of enzalutamide for 5 days were assessed for the expression of M1 markers (CD80, CD86, H2-EB1, and CXCL11) and M2 markers (CD68, CD206, ARG1, and TGM2) by RT-qPCR. (G) Admixtures of BMs and T cells co-cultured with Myc-CaP parental or Myc-CaP MDVR cells with or without enzalutamide treatment were profiled for Treg (CD45+CD3+CD4+CD8-Foxp3+) cell populations by flow cytometry. Percentages of Treg cell populations in admixtures were plotted for comparison. (H) The CD8+ T cells were further gated for IFN-γ expression. Percentages of IFN-γ+ in CD8+ cells populations in respective admixtures were plotted for comparison. *p<0.05. BMs, bone marrow cells; IFN, interferon; RT-qPCR, quantitative real-time PCR; Treg, regulatory T cell.

References

    1. Society AC . Facts & figures. Atlanta Ga: American Cancer Society, 2022.
    1. Siegel RL, Miller KD, Fuchs HE, et al. . Cancer statistics, 2022. CA Cancer J Clin 2022;72:7–33. 10.3322/caac.21708 - DOI - PubMed
    1. Scher HI, Fizazi K, Saad F, et al. . Increased survival with enzalutamide in prostate cancer after chemotherapy. N Engl J Med 2012;367:1187–97. 10.1056/NEJMoa1207506 - DOI - PubMed
    1. Watson PA, Arora VK, Sawyers CL. Emerging mechanisms of resistance to androgen receptor inhibitors in prostate cancer. Nat Rev Cancer 2015;15:701–11. 10.1038/nrc4016 - DOI - PMC - PubMed
    1. Marcus L, Lemery SJ, Keegan P, et al. . Fda approval summary: pembrolizumab for the treatment of microsatellite instability-high solid tumors. Clin Cancer Res 2019;25:3753–8. 10.1158/1078-0432.CCR-18-4070 - DOI - PubMed

Publication types

MeSH terms

LinkOut - more resources