. 2023 May 5;14(1):2602.
doi: 10.1038/s41467-023-38097-1.

KK-LC-1 as a therapeutic target to eliminate ALDH+ stem cells in triple negative breast cancer

Affiliations

KK-LC-1 as a therapeutic target to eliminate ALDH+ stem cells in triple negative breast cancer

Jiawen Bu et al. Nat Commun. .

Abstract

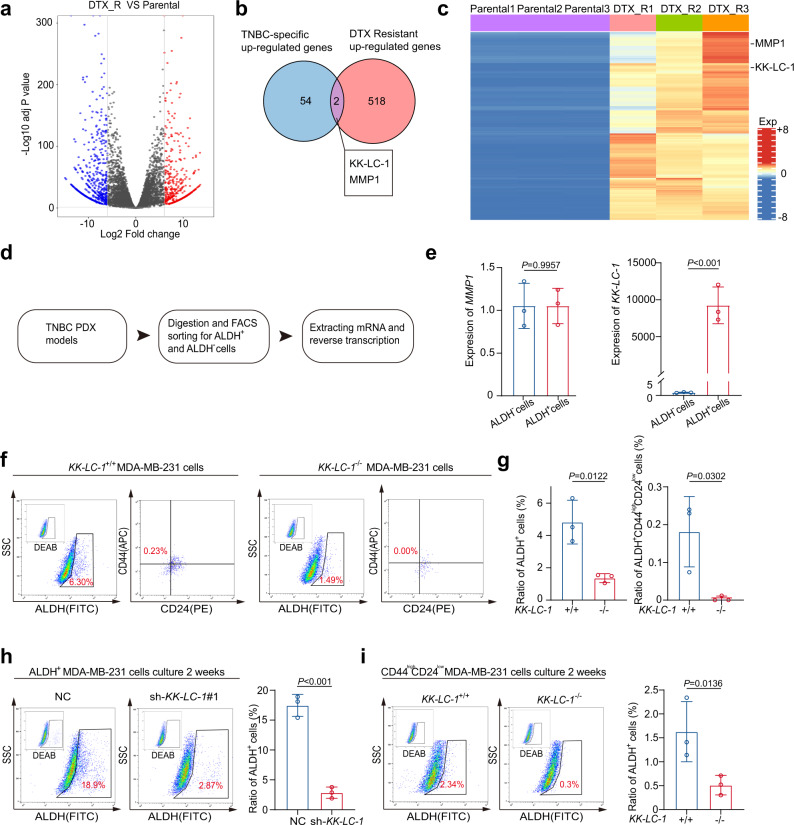
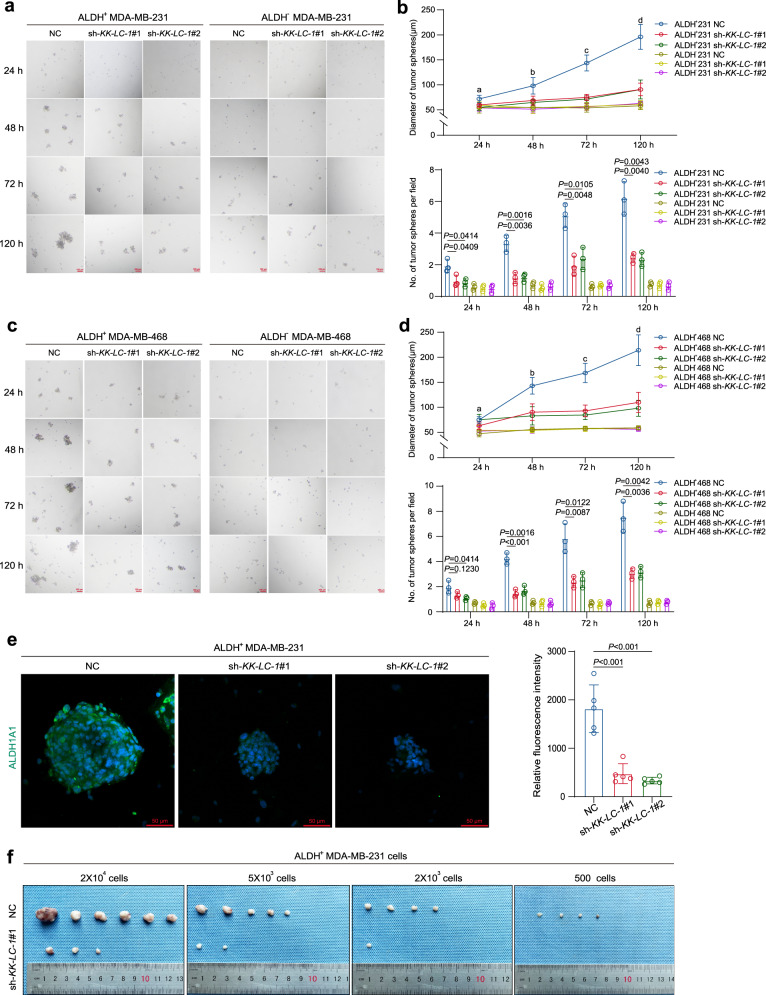
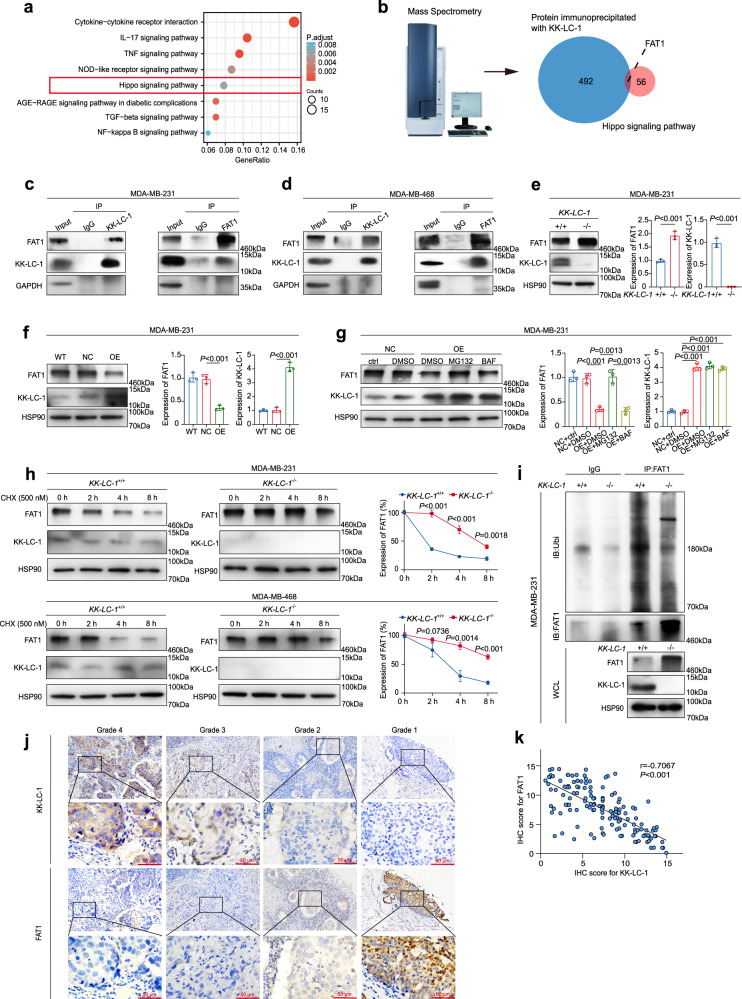
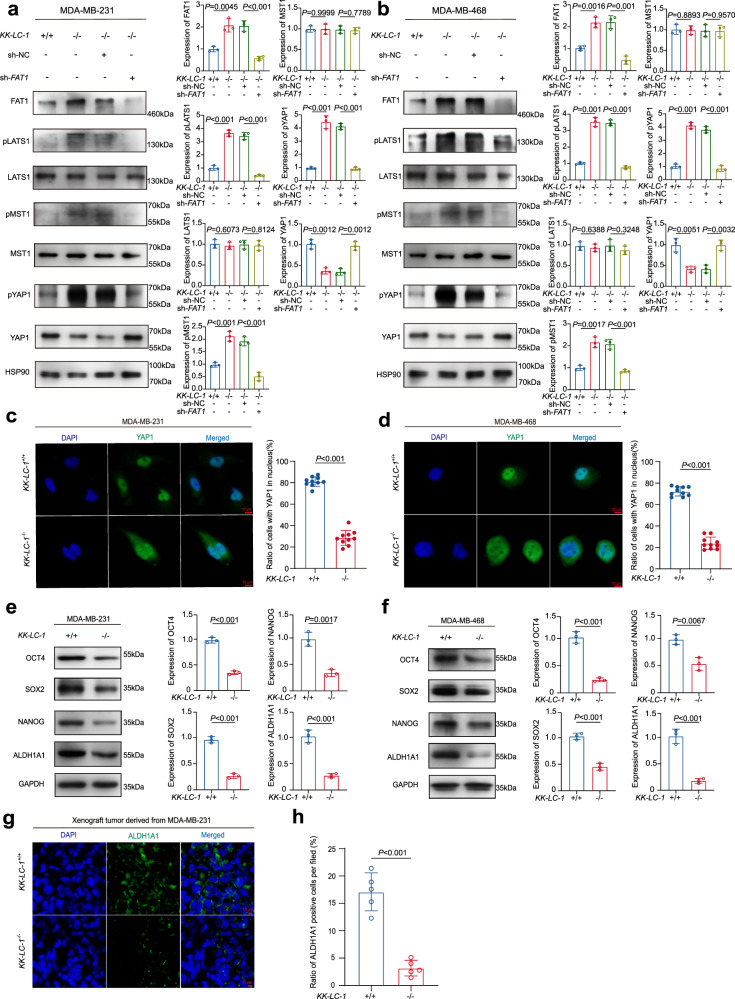
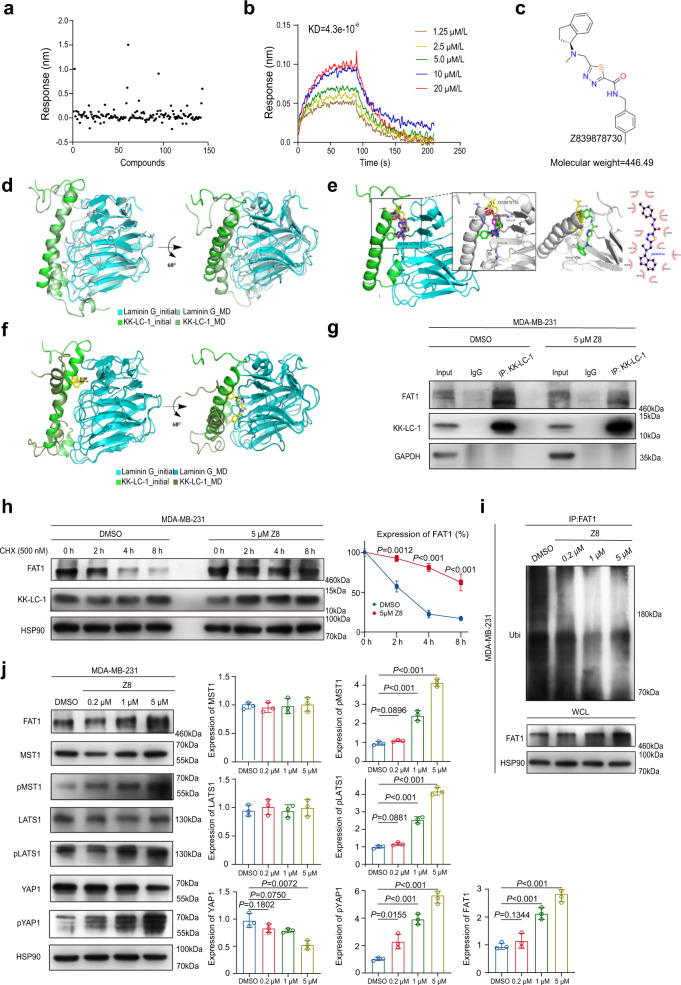
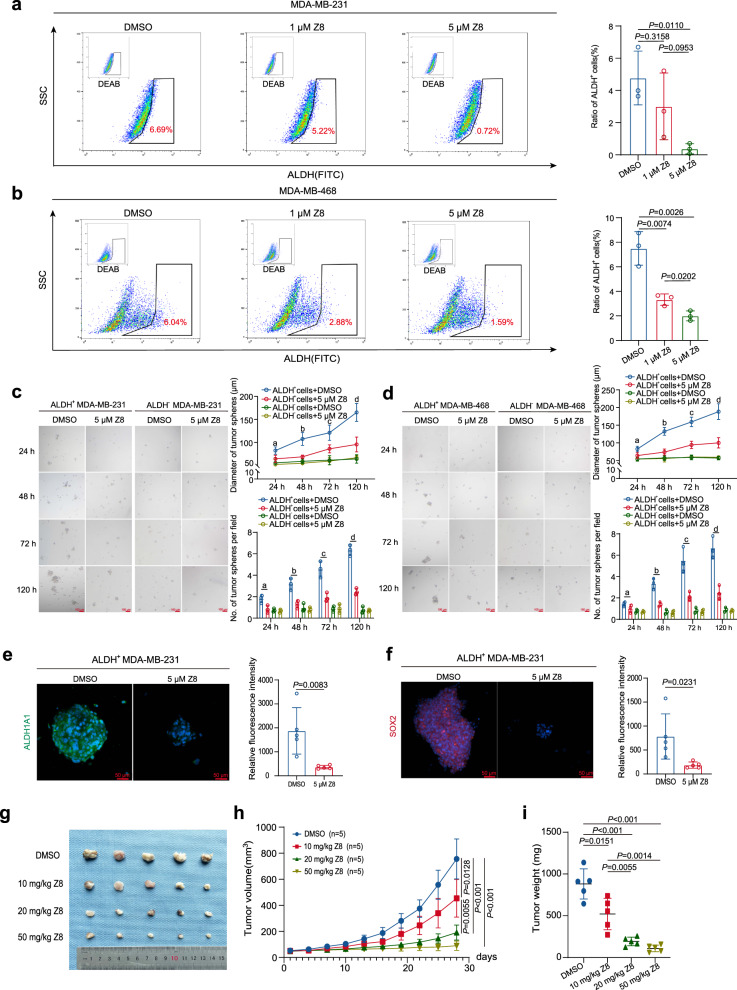
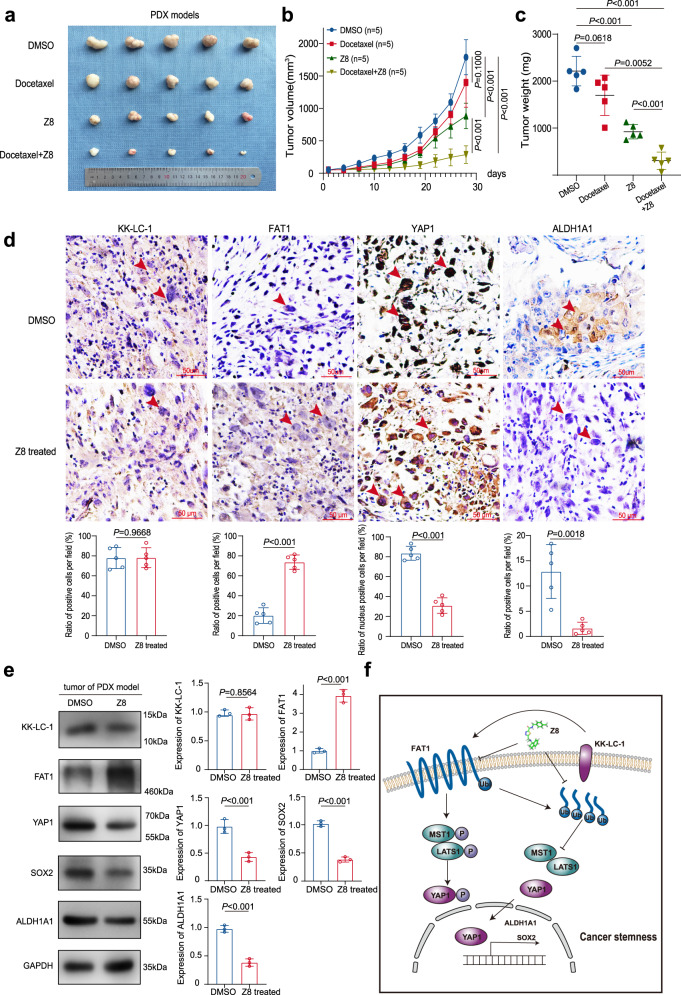
Failure to achieve complete elimination of triple negative breast cancer (TNBC) stem cells after adjuvant therapy is associated with poor outcomes. Aldehyde dehydrogenase 1 (ALDH1) is a marker of breast cancer stem cells (BCSCs), and its enzymatic activity regulates tumor stemness. Identifying upstream targets to control ALDH+ cells may facilitate TNBC tumor suppression. Here, we show that KK-LC-1 determines the stemness of TNBC ALDH+ cells via binding with FAT1 and subsequently promoting its ubiquitination and degradation. This compromises the Hippo pathway and leads to nuclear translocation of YAP1 and ALDH1A1 transcription. These findings identify the KK-LC-1-FAT1-Hippo-ALDH1A1 pathway in TNBC ALDH+ cells as a therapeutic target. To reverse the malignancy due to KK-LC-1 expression, we employ a computational approach and discover Z839878730 (Z8) as an small-molecule inhibitor which may disrupt KK-LC-1 and FAT1 binding. We demonstrate that Z8 suppresses TNBC tumor growth via a mechanism that reactivates the Hippo pathway and decreases TNBC ALDH+ cell stemness and viability.


Conflict of interest statement

The authors declare no competing interests.

Figures

Fig. 1
Fig. 1. KK-LC-1 regulated the proportion, self-renewal, and generation of ALDH+ cells in TNBC.
a Volcano plot showing up-regulated genes in docetaxel-resistant MDA-MB-231 cells (DTX_R) compared to their parental cells (Parental) (Log2 Fold change > 6, adj P value < 0.05, P values were determined using moderated t-statistic, adj P-value was calculated using Benjamini and Hochberg’s method and tails were two-sided). b Up-regulated genes in docetaxel-resistant MDA-MB-231 cells were intersected with the up-regulated genes in TNBC,. Expression levels of two genes were significantly higher in docetaxel-resistant MDA-MB-231 cells. c Heatmap showing expression of the two highly expressed genes. d Schematic showing the identification and isolation of primary ALDH+ and ALDH- cells. e Among the two highly expressed genes, KK-LC-1 had the highest expression in ALDH+ cells compared to ALDH cells and was selected as a potential candidate that may regulate ALDH+ cells in TNBC; data are presented as mean ± SD from three biologically independent experiments, statistical significance was determined using Student’s t-test and was two-sided. f, g: KK-LC-1 knockout significantly reduced the proportion of ALDH+ cells and ALDH+CD44highCD24low cells in MDA-MB-231 cells; data are presented as mean ± SD from three biologically independent experiments and statistical significance was determined using Student’s t-test and was two-sided. h The proportion of ALDH+ cells was significantly lower in ALDH+ sh-KK-LC-1#1 cells compared to ALDH+ NC cells after 2 weeks in culture; data are presented as mean ± SD from three biologically independent experiments, statistical significance was determined using Student’s t-test and was two-sided. i A significantly higher proportion of ALDH+ cells was derived from CD44highCD24low KK-LC-1+/+ MDA-MB-231 compared to CD44highCD24low KK-LC-1−/− MDA-MB-231 cells after 2 weeks in culture; data are presented as mean ± SD from three biologically independent experiments, statistical significance was determined using Student’s t-test and was two-sided. Source data are provided as a Source data file.
Fig. 2
Fig. 2. KK-LC-1 regulated TNBC ALDH+ cell tumorsphere formation capacity and tumorgenicity.
a Sphere formation of ALDH+ MDA-MB-231 cells and ALDH MDA-MB-231 cells transduced with sh-KK-LC-1#1, sh-KK-LC-1#2, and negative control (NC) lentivirus at various time points, red scale bars indicate 100 μm. b Diameter and number of spheres formed by ALDH+ MDA-MB-231 cells and ALDH- MDA-MB-231 cells transduced with sh-KK-LC-1#1, sh-KK-LC-1#2 and negative control (NC) lentivirus at various time points; data are presented as mean ± SD from three biologically independent experiments. Regarding the diameter of the spheres, ‘a’ indicates P = 0.0712 when ALDH+ MDA-MB-231 sh-KK-LC-1#1 compared to ALDH+ MDA-MB-231 NC and P = 0.0415 when ALDH+ MDA-MB-231 sh-KK-LC-1#2 compared to ALDH+ MDA-MB-231 NC at 24 h time point, ‘b’ indicates P = 0.0525 when ALDH+ MDA-MB-231 sh-KK-LC-1#1 compared to ALDH+ MDA-MB-231 NC and P = 0.0297 when ALDH+ MDA-MB-231 sh-KK-LC-1#2 compared to ALDH+ MDA-MB-231 NC at 48 h time point, ‘c’ indicates P = 0.0021 when ALDH+ MDA-MB-231 sh-KK-LC-1#1 compared to ALDH+ MDA-MB-231 NC and P = 0.0019 when ALDH+ MDA-MB-231 sh-KK-LC-1#2 compared to ALDH+ MDA-MB-231 NC at 72 h time point, ‘d’ indicates P = 0.0028 when ALDH+ MDA-MB-231 sh-KK-LC-1#1 compared to ALDH+ MDA-MB-231 NC and P = 0.0043 when ALDH+ MDA-MB-231 sh-KK-LC-1#2 compared to ALDH+ MDA-MB-231 NC at 120 h time point, statistical significance was determined using Student’s t-test and was two-sided. c: Sphere formation of ALDH+ MDA-MB-468 cells and ALDH- MDA-MB-468 cells transduced with sh-KK-LC-1#1, sh-KK-LC-1#2 and negative control (NC) lentivirus at various time points, red scale bars indicate 100 μm. d: Diameter and number of spheres formed by ALDH+ MDA-MB-468 cells and ALDH- MDA-MB-468 cells transduced with sh-KK-LC-1#1, sh-KK-LC-1#2 and negative control (NC) lentivirus at various time points; data are presented as mean ± SD from three biologically independent experiments. Regarding to the diameter of the spheres, ‘a’ indicates P = 0.1089 when ALDH+ MDA-MB-468 sh-KK-LC-1#1 compared to ALDH+ MDA-MB-468 NC and P = 0.9846 when ALDH+ MDA-MB-468 sh-KK-LC-1#2 compared to ALDH+ MDA-MB-468 NC at 24 h time point, ‘b’ indicates P = 0.0178 when ALDH+ MDA-MB-468 sh-KK-LC-1#1 compared to ALDH+ MDA-MB-468 NC and P = 0.0137 when ALDH+ MDA-MB-468 sh-KK-LC-1#2 compared to ALDH+ MDA-MB-468 NC at 48 h time point, ‘c’ indicates P = 0.0043 when ALDH+ MDA-MB-468 sh-KK-LC-1#1 compared to ALDH+ MDA-MB-468 NC and P = 0.0023 when ALDH+ MDA-MB-468 sh-KK-LC-1#2 compared to ALDH+ MDA-MB-468 NC at 72 h time point, ‘d’ indicates P = 0.0008 when ALDH+ MDA-MB-468 sh-KK-LC-1#1 compared to ALDH+ MDA-MB-468 NC and P = 0.0044 when ALDH+ MDA-MB-468 sh-KK-LC-1#2 compared to ALDH+ MDA-MB-468 NC at 120 h time point, statistical significance was determined using Student’s t-test and was two-sided. e Immunofluorescence staining showing the difference in ALDH1A1 protein expression in spheres formed by ALDH+ MDA-MB-231 cells transduced with sh-KK-LC-1#1, sh-KK-LC-1#2 and negative control (NC) lentivirus, red scale bars indicate 50 μm; data are presented as mean ± SD from five randomized views and this experiment was performed independently for 3 times, statistical significance was determined using Student’s t-test and was two-sided. f Representative tumors formed by ALDH+ MDA-MB-231 cells transduced with sh-KK-LC-1#1 and negative control (NC) lentivirus in tumor propagation assay, n = 6 mice in each group. Source data are provided as a Source data file.
Fig. 3
Fig. 3. KK-LC-1 regulated FAT1 protein stability in TNBC.
a Differential gene enrichment analysis showed that the Hippo pathway was one of the top signaling pathways altered in KK-LC-1−/− MDA-MB-231 cells and KK-LC-1+/+ MDA-MB-231 cells, P values were determined using enrichKEGG function and adj P values were calculated using Benjamini and Hochberg’s method. b FAT1 was identified as a high-confidence interacting protein with KK-LC-1. c Co-immunoprecipitation suggested direct molecular interaction between KK-LC-1 and FAT1 proteins in MDA-MB-231 cells, this experiment was performed 3 times independently with similar results. d Co-immunoprecipitation suggested direct molecular interaction between KK-LC-1 and FAT1 proteins in MDA-MB-468 cells, this experiment was performed 3 times independently with similar results. e: Western blotting showing FAT1 and KK-LC-1 protein levels in KK-LC-1−/− MDA-MB-231 cells and KK-LC-1+/+ MDA-MB-231 cells, data are presented as mean ± SD from three biologically independent experiments, statistical significance was determined using Student’s t-test and was two-sided. f Western blotting showing FAT1 and KK-LC-1 protein levels in MDA-MB-231 cells overexpressing KK-LC-1, negative controls, and parental MDA-MB-231 cells; data are presented as mean ± SD from three biologically independent experiments, statistical significance was determined using Student’s t-test and was two-sided. g Western blotting showing the effects of MG-132, bafilomycin, and overexpression of KK-LC-1 on FAT1 protein levels in MDA-MB-231 cells; data are presented as mean ± SD from three biologically independent experiments, statistical significance was determined using Student’s t-test and was two-sided. h Western blotting showing degradation of FAT1 protein in KK-LC-1−/− MDA-MB-231 cells, KK-LC-1−/− MDA-MB-468 cells, KK-LC-1+/+ MDA-MB-231 cells and KK-LC-1+/+ MDA-MB-468 cells; data are presented as mean ± SD from three biologically independent experiments, statistical significance was determined using Student’s t-test at each time point and was two-sided. i Immunoprecipitation showing ubiquitination of FAT1 protein in KK-LC-1−/− MDA-MB-231 cells and KK-LC-1+/+ MDA-MB-231 cells, this experiment was performed 3 times independently with similar results. j Immunohistochemistry staining showing KK-LC-1 and FAT1 protein expression in TNBC tissue, n = 144 clinical samples, red scale bars indicate 50 μm. k Correlation between KK-LC-1 and FAT1 protein levels in TNBC tissue; n = 144 clinical samples, data are analyzed using Pearson correlation, r = −0.7067, P < 0.0001. Source data are provided as a Source data file.
Fig. 4
Fig. 4. KK-LC-1 knockout maintained the Hippo pathway in an active state via FAT1.
a Western blotting showing FAT1, LATS1, pLATS1, MST1, pMST1, YAP1, and pYAP1 protein levels in KK-LC-1+/+ MDA-MB-231 cells, KK-LC-1−/− MDA-MB-231 cells, KK-LC-1−/− MDA-MB-231 cells transduced with negative control lentivirus and KK-LC-1−/− MDA-MB-231 cells transduced with sh-FAT1 lentivirus; data are presented as mean ± SD from three biologically independent experiments, statistical significance was determined using Student’s t-test and was two-sided. b Western blotting showing FAT1, LATS1, pLATS1, MST1, pMST1, YAP1, and pYAP1 protein levels in KK-LC-1+/+ MDA-MB-468 cells, KK-LC-1−/− MDA-MB-468 cells, KK-LC-1−/− MDA-MB-468 cells transduced with negative control lentivirus and KK-LC-1−/− MDA-MB-468 cells transduced with sh-FAT1 lentivirus; data are presented as mean ± SD from three biologically independent experiments, statistical significance was determined using Student’s t-test and was two-sided. c Immunofluorescence showing the distribution of YAP1 protein in KK-LC-1−/− MDA-MB-231 cells and KK-LC-1+/+ MDA-MB-231 cells, red scale bars indicate 10 μm; data are presented as mean ± SD from 10 randomized views and this experiment was performed independently for 3 times, statistical significance was determined using Student’s t-test and was two-sided. d Immunofluorescence showing the distribution of YAP1 protein in KK-LC-1−/− MDA-MB-468 cells and KK-LC-1+/+ MDA-MB-468 cells, red scale bars indicate 10 μm; data are presented as mean ± SD from 10 randomized views and this experiment was performed independently for 3 times, statistical significance was determined using Student’s t-test and was two-sided. e Western blotting showing SOX2, OCT4, NANOG, and ALDH1A1 protein levels in KK-LC-1−/− MDA-MB-231 cells and KK-LC-1+/+ MDA-MB-231 cells; data are presented as mean ± SD from three biologically independent experiments, statistical significance was determined using Student’s t-test and was two-sided. f Western blotting showing SOX2, OCT4, NANOG, and ALDH1A1 protein levels in KK-LC-1−/− MDA-MB-468 cells and KK-LC-1+/+ MDA-MB-468 cells; data are presented as mean ± SD from three biologically independent experiments, statistical significance was determined using Student’s t-test and was two-sided. g and h Immunofluorescence showing ALDH1A1 protein expression in tumors derived from KK-LC-1−/− MDA-MB-231 cells and KK-LC-1+/+ MDA-MB-231 cells, red scale bars indicate 10 μm; data are presented as mean ± SD from five randomized views and this experiment was performed independently for 3 times, statistical significance was determined using Student’s t-test and was two-sided. Source data are provided as a Source data file.
Fig. 5
Fig. 5. Z839878730 (Z8) disrupted KK-LC-1-FAT1 protein-protein interactions and prevented FAT1 degradation.
a 145 small molecular compounds were predicted to having binding affinity with KK-LC-1 and their binding signals with KK-LC-1 protein were tested. b Multi-concentration association-dissociation curve of Z8 and KK-LC-1 protein interaction, KD = 4.3 × 10−6 mol/L. c Structure of Z8. d Comparison between the initial conformation of the KK-LC-1-laminin G heterodimer receptor system and the last frame of the MD simulations,. e Hot-spot residues that contributed to the interaction between Z8 and KK-LC-1. Yellow lines radiating towards the ligands are hydrogen binding. Arcs with spokes radiating toward the ligands are hydrophobic interactions,. f Comparison between the initial conformation of the KK-LC-1-laminin G-Z8 complex and the last frame of the MD simulations,. g Co-immunoprecipitation of FAT1 and KK-LC-1 was reduced by treatment of MDA-MB-231 cells with 5 µM Z8 compared to DMSO, this experiment was performed 3 times independently with similar results. h Western blotting showing degradation of FAT1 was significantly decreased by treatment of MDA-MB-231 cells with 5 µM Z8 compared to DMSO; data are presented as mean ± SD from three biologically independent experiments, statistical significance was determined using Student’s t-test and was two-sided. i: Immunoprecipitation showing ubiquitination of FAT1 was decreased by treatment of MDA-MB-231 cells with various concentrations of Z8 compared to DMSO, this experiment was performed 3 times independently with similar results. j Western blotting showing FAT1, MST1, pMST1, LATS1, pLATS1, YAP1, and pYAP1 protein levels in MDA-MB-231 cells treated with different concentrations of Z8 or DMSO; data are presented as mean ± SD from three biologically independent experiments, statistical significance was determined using Student’s t-test and was two-sided. Source data are provided as a Source data file.
Fig. 6
Fig. 6. Z8 impaired ALDH+ cells and inhibited tumor growth in vivo.
a Proportion of ALDH+ cells in MDA-MB-231 cells treated with different concentrations of Z8; data are presented as mean ± SD from three biologically independent experiments, statistical significance was determined using Student’s t-test and was two-sided. b Proportion of ALDH+ cells in MDA-MB-468 cells treated with different concentrations of Z8; data are presented as mean ± SD from three biologically independent experiments, statistical significance was determined using Student’s t-test and was two-sided. c Sphere formation by ALDH+ MDA-MB-231 cells and ALDH- MDA-MB-231 cells treated with 5 µM Z8 or DMSO, red scale bars indicate 100 μm, sphere diameter and a number of spheres were analyzed; data are presented as mean ± SD from three biologically independent experiments. Regarding to sphere diameter, ‘a’ indicates P = 0.0486 when ALDH+ MDA-MB-231 cells + Z8 compared to ALDH+ MDA-MB-231 cells + DMSO at 24 h time point, ‘b’ indicates P = 0.0099 when ALDH+ MDA-MB-231 cells + Z8 compared to ALDH+ MDA-MB-231 cells + DMSO at 48 h time point, ‘c’ indicates P = 0.0324 when ALDH+ MDA-MB-231 cells + Z8 compared to ALDH+ MDA-MB-231 cells + DMSO at 72 h time point, ‘d’ indicates P = 0.0087 when ALDH+ MDA-MB-231 cells + Z8 compared to ALDH+ MDA-MB-231 cells + DMSO at 120 h time point; Regarding to sphere number, ‘a’ indicates P = 0.0292 when ALDH+ MDA-MB-231 cells + Z8 compared to ALDH+ MDA-MB-231 cells + DMSO at 24 h time point, ‘b’ indicates P = 0.0035 when ALDH+ MDA-MB-231 cells + Z8 compared to ALDH+ MDA-MB-231 cells + DMSO at 48 h time point, ‘c’ indicates P = 0.0060 when ALDH+ MDA-MB-231 cells + Z8 compared to ALDH+ MDA-MB-231 cells + DMSO at 72 h time point, ‘d’ indicates P < 0.001 when ALDH+ MDA-MB-231 cells + Z8 compared to ALDH+ MDA-MB-231 cells + DMSO at 120 h time point; statistical significance was determined using Student’s t-test and was two sided. d Sphere formation by ALDH+ MDA-MB-468 cells and ALDH- MDA-MB-468 cells treated with 5 µM Z8 or DMSO, red scale bars indicate 100 μm, sphere diameter and number of spheres were analyzed; data are presented as mean ± SD from three biologically independent experiments, Regarding to sphere diameter, ‘a’ indicates P = 0.0566 when ALDH+ MDA-MB-468 cells + Z8 compared to ALDH+ MDA-MB-468 cells + DMSO at 24 h time point, ‘b’ indicates P = 0.0019 when ALDH+ MDA-MB-468 cells + Z8 compared to ALDH+ MDA-MB-468 cells + DMSO at 48 h time point, ‘c’ indicates P = 0.0026 when ALDH+ MDA-MB-468 cells + Z8 compared to ALDH+ MDA-MB-468 cells + DMSO at 72 h time point, ‘d’ indicates P = 0.0045 when ALDH+ MDA-MB-468 cells + Z8 compared to ALDH+ MDA-MB-468 cells + DMSO at 120 h time point; Regarding to sphere number, ‘a’ indicates P = 0.1458 when ALDH+ MDA-MB-468 cells + Z8 compared to ALDH+ MDA-MB-468 cells + DMSO at 24 h time point, ‘b’ indicates P = 0.0035 when ALDH+ MDA-MB-468 cells + Z8 compared to ALDH+ MDA-MB-468 cells + DMSO at 48 h time point, ‘c’ indicates P = 0.0098 when ALDH+ MDA-MB-468 cells + Z8 compared to ALDH+ MDA-MB-468 cells + DMSO at 72 h time point, ‘d’ indicates P = 0.0041 when ALDH+ MDA-MB-468 cells + Z8 compared to ALDH+ MDA-MB-468 cells + DMSO at 120 h time point; statistical significance was determined using Student’s t-test and was two sided. e Immunofluorescence showing ALDH1A1 protein expression in spheres formed by ALDH+ MDA-MB-231 cells treated with 5 µM Z8 or DMSO, red scale bars indicate 50 μm; data are presented as mean ± SD from five randomized views, this experiment was performed 3 times independently with similar results, statistical significance was determined using Student’s t-test and was two-sided. f Immunofluorescence showing SOX2 protein expression in spheres formed by ALDH+ MDA-MB-231 cells treated with 5 µM Z8 or DMSO, red scale bars indicate 50 μm; data are presented as mean ± SD from five randomized views, this experiment was performed 3 times independently with similar results, statistical significance was determined using Student’s t-test and was two-sided. g Outcomes of tumors derived from MDA-MB-231 cells in mice treated with different doses of Z8, n = 5 mice for each group. h Volume of tumors derived from MDA-MB-231 cells in mice treated with different doses of Z8; data are presented as mean ± SD, n = 5 mice for each group, statistical significance was determined using Student’s t-test and was two-sided. i Weight of tumors derived from MDA-MB-231 cells in mice treated with different doses of Z8, data are mean ± SD; data are presented as mean ± SD, n = 5 mice for each group, statistical significance was determined using Student’s t-test and was two-sided. Source data are provided as a Source data file.
Fig. 7
Fig. 7. Z8 impaired tumor growth in patient-derived xenografts.
a Outcomes of PDX mouse models treated with DMSO, docetaxel, Z8, or a combination of both drugs, n = 5 mice for each group. b Volume of PDX in mice treated with DMSO, docetaxel, Z8, or a combination of both drugs; data are presented as mean ± SD, n = 5 mice for each group, statistical significance was determined using Student’s t-test and was two-sided. c Weight of PDX in mice treated with DMSO, docetaxel, Z8, or a combination of both drugs; data are presented as mean ± SD, n = 5 mice for each group, statistical significance was determined using Student’s t-test and was two-sided. d Immunohistochemistry staining showing KK-LC-1, FAT1, YAP1 and ALDH1A1 protein expression in PDX in mice treated with Z8 or DMSO, red scale bars indicate 50 μm; data are presented as mean ± SD from five randomized views, this experiment was performed 3 times independently with similar results, statistical significance was determined using Student’s t-test and was two-sided. e: Western blotting showing KK-LC-1, FAT1, YAP1, SOX2, and ALDH1A1 protein levels in PDX in mice treated with Z8 or DMSO; data are presented as mean ± SD from three biologically independent experiments, statistical significance was determined using Student’s t-test and was two-sided. f Schematic depicting the mechanisms underlying KK-LC-1 regulation of ALDH+ cell stemness. KK-LC-1 binds FAT1 and facilitates its ubiquitination and degradation. Hippo signaling is deactivated and YAP1 is translocated to the nucleus. SOX2 and ALDH1A1 transcription is increased, promoting stemness in breast cells. Source data are provided as a Source data file.

References

    1. Qiu J, et al. Comparison of clinicopathological features and prognosis in triple-negative and non-triple negative breast cancer. J. Cancer. 2016;7:167–173. doi: 10.7150/jca.10944. - DOI - PMC - PubMed
    1. Yin L, Duan JJ, Bian XW, Yu SC. Triple-negative breast cancer molecular subtyping and treatment progress. Breast Cancer Res. 2020;22:61. doi: 10.1186/s13058-020-01296-5. - DOI - PMC - PubMed
    1. Won KA, Spruck C. Triplenegative breast cancer therapy: Current and future perspectives (Review) Int. J. Oncol. 2020;57:1245–1261. doi: 10.3892/ijo.2020.5135. - DOI - PMC - PubMed
    1. Anders CK, Carey LA. Biology, metastatic patterns, and treatment of patients with triple-negative breast cancer. Clin. Breast Cancer. 2009;9:S73–S81. doi: 10.3816/CBC.2009.s.008. - DOI - PMC - PubMed
    1. Housman G, et al. Drug resistance in cancer: an overview. Cancers (Basel) 2014;6:1769–1792. doi: 10.3390/cancers6031769. - DOI - PMC - PubMed

Publication types