. 2023 May 5;14(1):2601.
doi: 10.1038/s41467-023-38195-0.

Circulating tumor DNA reveals mechanisms of lorlatinib resistance in patients with relapsed/refractory ALK-driven neuroblastoma

Affiliations

Circulating tumor DNA reveals mechanisms of lorlatinib resistance in patients with relapsed/refractory ALK-driven neuroblastoma

Esther R Berko et al. Nat Commun. .

Abstract

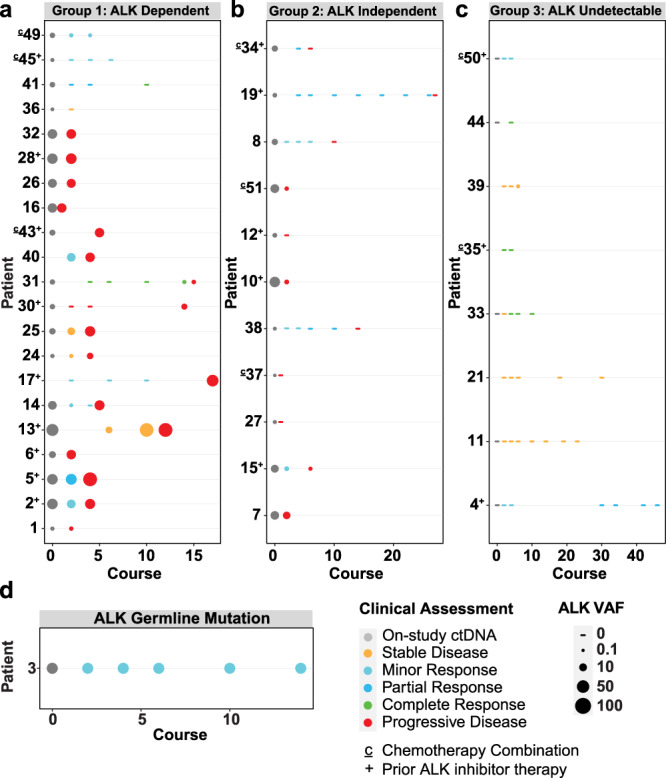
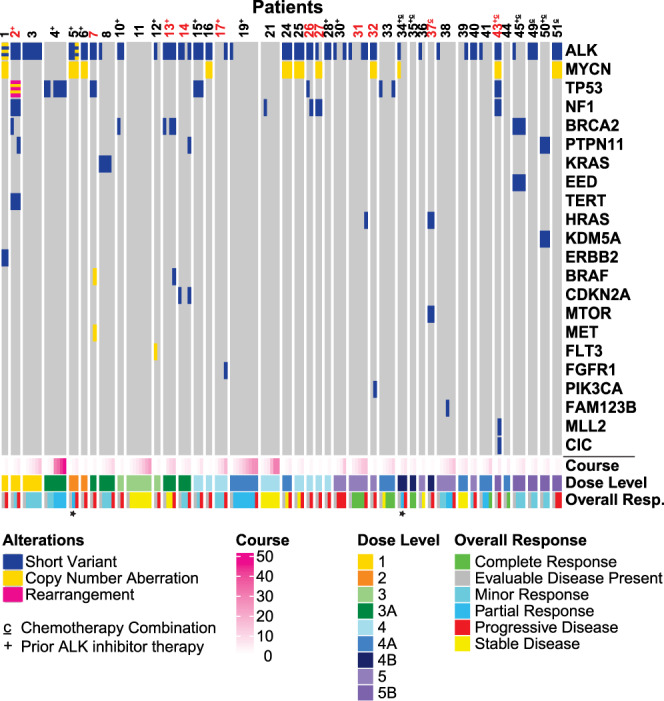
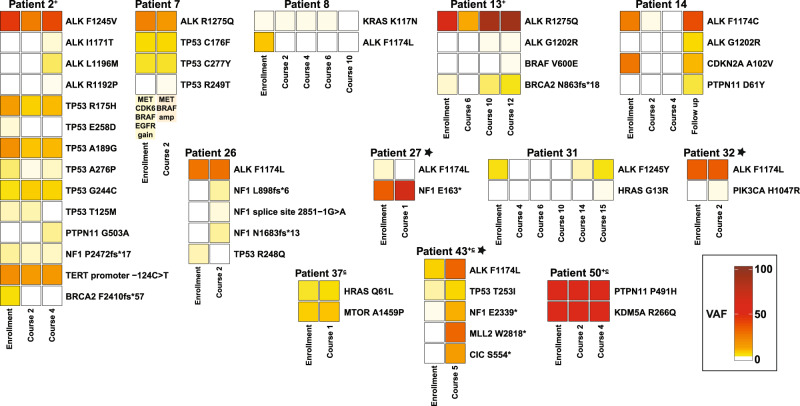
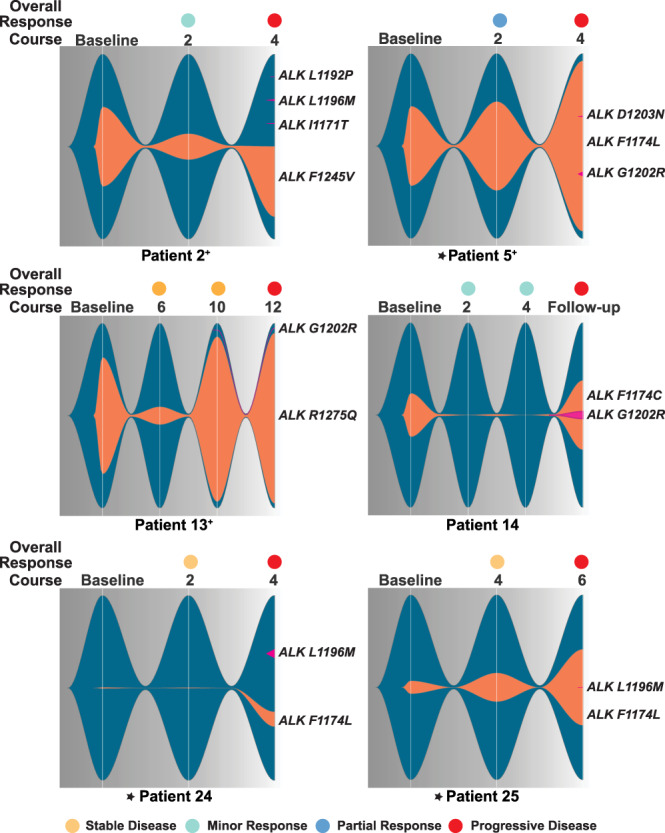
Activating point mutations in Anaplastic Lymphoma Kinase (ALK) have positioned ALK as the only mutated oncogene tractable for targeted therapy in neuroblastoma. Cells with these mutations respond to lorlatinib in pre-clinical studies, providing the rationale for a first-in-child Phase 1 trial (NCT03107988) in patients with ALK-driven neuroblastoma. To track evolutionary dynamics and heterogeneity of tumors, and to detect early emergence of lorlatinib resistance, we collected serial circulating tumor DNA samples from patients enrolled on this trial. Here we report the discovery of off-target resistance mutations in 11 patients (27%), predominantly in the RAS-MAPK pathway. We also identify newly acquired secondary compound ALK mutations in 6 (15%) patients, all acquired at disease progression. Functional cellular and biochemical assays and computational studies elucidate lorlatinib resistance mechanisms. Our results establish the clinical utility of serial circulating tumor DNA sampling to track response and progression and to discover acquired resistance mechanisms that can be leveraged to develop therapeutic strategies to overcome lorlatinib resistance.


Conflict of interest statement

Y.P.M. is the Principal Investigator of the NANT Phase 1 trial of lorlatinib and is a consultant for Pfizer. No research funding from Pfizer was received for this study. Y.P.M. has previously received research funding from Pfizer and Novartis. Y.P.M. has also served as a consultant for Lilly, Auron Therapeutics, and Jumo Health. Y.P.M. serves as a member of the Data and Safety Monitoring Committee for the ASCO TAPUR study and receives honoraria for this role. D.P. is an employee of Foundation Medicine. The remaining authors declare no competing interests.

Figures

Fig. 1
Fig. 1. Circulating plasma ALK VAF varies with clinical response to therapy.
a In Group 1, circulating ALK VAF correlated with disease response, as patients’ tumors remained dependent on mutated activated ALK. In patients 1, 2, 5, 6, 13, 14, 17, 24, 25, 30, 31, 40, and 43, ALK VAF decreased with clinical response to lorlatinib and subsequently increased with disease progression. In patients 16, 26, 28, and 32, ALK VAF remained elevated as patients had progressive disease despite treatment. In patients 36, 41, 45, and 49 ALK VAF decreased with ongoing response to lorlatinib therapy. b In Group 2, circulating ALK VAF did not correlate with tumor response, decreasing despite disease progression—suggesting potential emergence of alternative oncogenic drivers of tumor growth. c In Group 3, circulating ALK was never detectable, and patients demonstrated persistent response to therapy (with the exception of sample 3 in patient 39 where minimal ALK VAF was detected at 0.18%). d Patient 3 harbored a germline ALK R1275Q mutation that remained stable at the expected 50% VAF, with complete response to lorlatinib. Patient numbers are annotated with a ‘c’ if they were receiving combination lorlatinib/chemotherapy, and with a ‘+’ sign if they had received prior ALK inhibitor therapy. All VAF values are given as ‘SV percent reads’ in Source Data. VAF variant allele frequency, ctDNA circulating tumor DNA. Source data are provided as a Source Data file.
Fig. 2
Fig. 2. Landscape of detectable circulating tumor DNA genetic mutations during lorlatinib treatment.
An Oncoplot representation demonstrates mutations detectable at enrollment and throughout treatment in each patient. Each column shows the pathogenic or likely pathogenic alterations found in a single ctDNA sample from a study patient, with patient number denoted above (those annotated in red have acquired off-target genetic mechanisms of lorlatinib resistance). The corresponding treatment course, dose level, and clinical response at the time of genetic profiling for each sample is color coded below. Asterisks indicate samples in which radiography could not be incorporated as part of clinical evaluation. Patient numbers are annotated with a ‘c’ if they were receiving combination lorlatinib/chemotherapy, and with a ‘+’ sign if they had received prior ALK inhibitor therapy. Source data are provided as a Source Data file.
Fig. 3
Fig. 3. Emergence of new RAS-MAPK mutations during lorlatinib treatment.
VAFs for ALK mutations and mutations in RAS-MAPK pathway genes during lorlatinib treatment are listed, all corresponding with disease progression. Boxes are colored by VAF according to the scale shown. Patient numbers are annotated with a ‘+’ sign if they had received prior ALK inhibitor therapy, a ‘c’ if they were receiving combination lorlatinib/chemotherapy. Asterisks indicate patients with MYCN amplification. VAF variant allele frequency. Source data are provided as a Source Data file.
Fig. 4
Fig. 4. Development of compound ALK mutations corresponds with tumor resistance and disease progression.
Fishplots demonstrate detectable ALK at each timepoint, with dark blue background and orange clones showing the original neuroblastoma ALK mutation and the size of the fish proportional to VAF (see Source Data). Secondary ALK mutations are colored magenta; when occurring in cis they are depicted within the orange clone and when in trans or unknown, they are depicted outside the clone. Asterisks indicate patients with MYCN amplification, and patient numbers are annotated with a ‘+’ sign if they had received prior ALK inhibitor therapy. Source data are provided as a Source Data file.
Fig. 5
Fig. 5. Cellular and biochemical studies of ALK compound mutations.
a Cell viability assays at different lorlatinib concentrations of Kelly cells harboring either the single parental ALK F1174L driver mutation (red circles, solid curve) or the compound mutations F1174L/L1196M (medium red diamonds, dashed curve), or F1174L/G1202R (dark red squares, dotted curve) introduced in cis using CRISPR. b Cell viability assays at different lorlatinib concentrations of CHLA-20 neuroblastoma cells harboring either the single parental ALK R1275Q mutation (blue circles, solid curve) or the compound mutation F1174L/G1202R (dark blue squares, dotted curve). Data are plotted as the mean ± SD of three biological replicates, each performed in technical triplicate. c Comparison of in vitro inhibition of purified ALK-TKD for different F1174L-based variants. IC50 values for F1174L-mutated ALK-TKD were assessed for lorlatinib (red circles, solid red curve: IC50 = 2.3 ± 1.1 nM) and crizotinib (open gray circles, dashed gray curve: IC50 = 40 ± 20 nM), and compared with lorlatinib IC50 values for F1174L/L1196M (medium red diamonds, dashed curve: IC50 = 12 ± 6.2 nM) and F1174L/G1202R (dark red squares, dotted curve: IC50 = 26 ± 16 nM). d Comparison of in vitro inhibition of ALK-TKD for different R1275Q-based variants. IC50 values for R1275Q-mutated ALK-TKD were assessed for lorlatinib (blue circles, solid blue curve: IC50 = 2.9 ± 0.8 nM) and crizotinib (open gray circles, dashed gray curve: IC50 = 38 ± 24 nM), and compared with lorlatinib IC50 values for R1275Q/L1196M (medium blue diamonds, dashed curve: IC50 = 8 ± 5.2 nM) and R1275Q/G1202R (dark blue squares, dotted curve: IC50 = 40 ± 21 nM). e Measured KM,ATP values for different ALK-TKD variants, with numbers tabulated in Supplementary Table 1. f Focus formation assay results for ΔD1276-R1279InsE ALK (magenta) compared with wild-type (black), F1174L (red), and R1275Q (blue). Data are plotted as the mean ± SD of three biological replicates, each performed in technical duplicate. Source data are provided as a Source Data file.
Fig. 6
Fig. 6. Structural modeling of lorlatinib resistance due to compound mutations.
The color designations for ALK variants in this figure are as follows: F1174L (red) F1174L/G1202R (dark red), F1174L/L1196M (medium red), R1275Q (blue), R1275/G1202R (dark blue), R1275Q/L1196M (medium blue), L1196M (purple), and G1202R (gold). a Structure of wild-type ALK-TKD with bound lorlatinib (PDB ID: 4CLI), highlighting the positions of key structural elements, a bound lorlatinib molecule (green), F1174 (red), R1275 (blue), L1196 (purple) and G1202 (gold). b Distribution of lorlatinib-docking scores for modeled ALK-TKD variants, with lower (more negative) docking scores corresponding to increased binding energy. The docking scores were generated with n of 10 independently run induced fit docking experiments. For each variant, the filled symbol in the boxplot represents the mean, the horizontal line within the box represents the median, and upper and lower bounds of the box represent the 75th and 25th percentiles (to give interquartile range). The upper and lower whiskers represent the maximum and minimum values of the data that are within 1.5 times the interquartile range. c Best-fit docked lorlatinib (medium red) pose in the F1174L/L1196M ALK-TKD variant (docking score −10.213 kcal/mol), with lorlatinib shown in red and conserved interactions (blue dashed lines) with E1197 and M1199 of the hinge region marked, as well as position 1196 (replaced with M). d Best-docked lorlatinib pose for F1174L/G1202R (docking score −12.033 kcal/mol) showing conserved interactions (blue dashed lines) with E1197 and M1199 of the hinge region and the arginine introduced at position 1202. e Positions of R1202 and L1122 in the F1174L/G1202R ALK-TKD model in both the gate-open (left) and gate-closed (right) conformations, showing that ATP (green) placed as in PDB ID 3BU5 (bottom) can bind either conformation, whereas lorlatinib placed as in PDB ID: 4CLI (top) can only bind the gate-open conformation. f Plot of the percentage of time in the 300 ns MD simulations that each ALK-TKD variant noted spends in the gate-open conformation. Note that the F1174L/G1202R variant spends 10% of the time with the gate ʻopenʼ, and ~90% with the gate closed. g Lorlatinib inhibition curves generated in silico for R1275Q-based variants as described in Methods and Supplementary Note 2, with [ALK-TKD] set at 5 nM, and [ATP] at 1 mM, using only the gate-open kinetic model. h Lorlatinib inhibition curves generated in silico for F1174L-based variants as described in h. Curves for ALK-TKD with the F1174L (red circles, solid curve) or F1174L/L1196M (medium red diamonds, dashed curve) mutation were unaffected by whether or not the gate was allowed to close (see Supplementary Data Fig. 8e). Only with the gate closed ~90% of the time as predicted in f see Supplementary Data Fig. 8a, b) did the F1174L/G1202R variant (dark red squares, dotted curve) show the increased IC50 value plotted here. Source data are provided as a Source Data file.

References

    1. Smith MA, et al. Outcomes for children and adolescents with cancer: challenges for the twenty-first century. J. Clin. Oncol. 2010;28:2625–2634. doi: 10.1200/JCO.2009.27.0421. - DOI - PMC - PubMed
    1. Mosse YP, et al. Identification of ALK as a major familial neuroblastoma predisposition gene. Nature. 2008;455:930–935. doi: 10.1038/nature07261. - DOI - PMC - PubMed
    1. Chen Y, et al. Oncogenic mutations of ALK kinase in neuroblastoma. Nature. 2008;455:971–974. doi: 10.1038/nature07399. - DOI - PubMed
    1. George RE, et al. Activating mutations in ALK provide a therapeutic target in neuroblastoma. Nature. 2008;455:975–978. doi: 10.1038/nature07397. - DOI - PMC - PubMed
    1. Janoueix-Lerosey I, et al. Somatic and germline activating mutations of the ALK kinase receptor in neuroblastoma. Nature. 2008;455:967–970. doi: 10.1038/nature07398. - DOI - PubMed

Publication types

MeSH terms