. 2023 May 5;14(1):2589.
doi: 10.1038/s41467-023-37025-7.

Single-cell analysis reveals inflammatory interactions driving macular degeneration

Affiliations

Single-cell analysis reveals inflammatory interactions driving macular degeneration

Manik Kuchroo et al. Nat Commun. .

Abstract

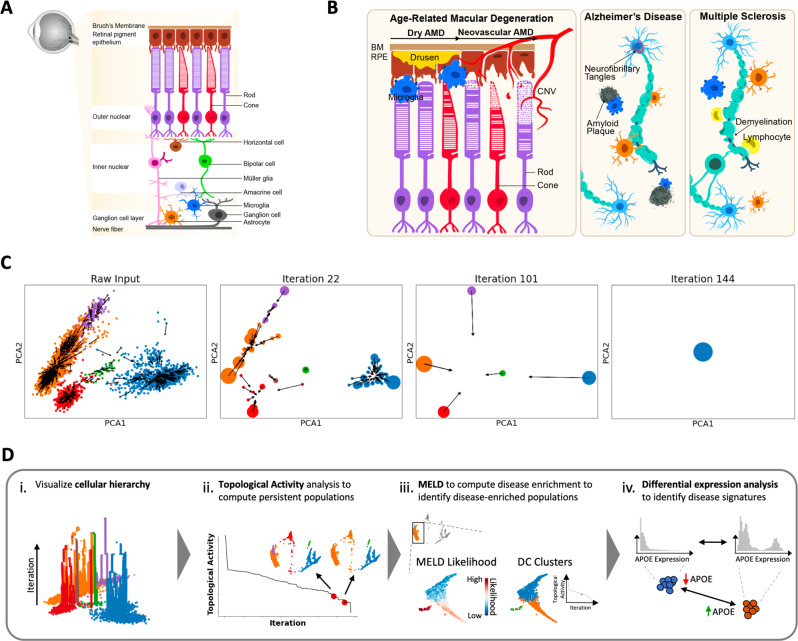
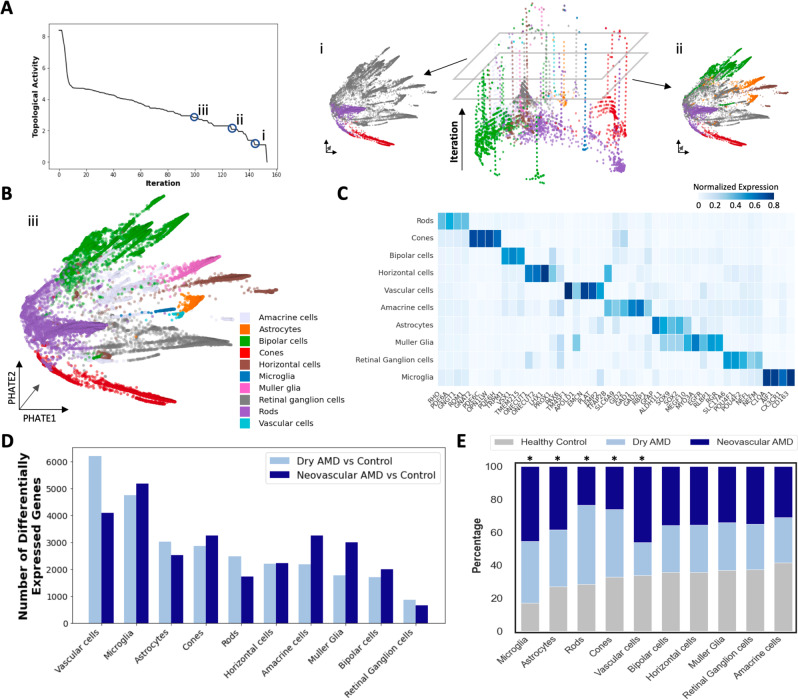
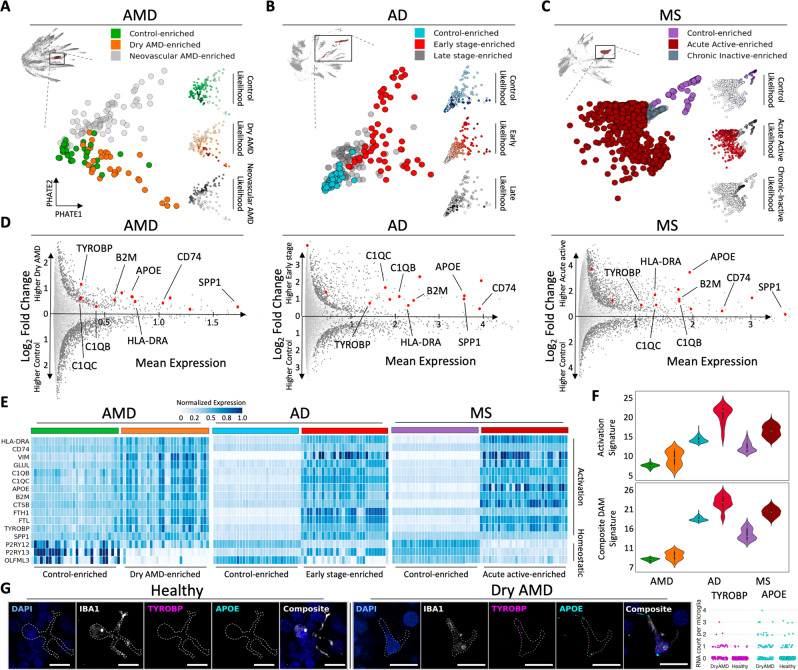
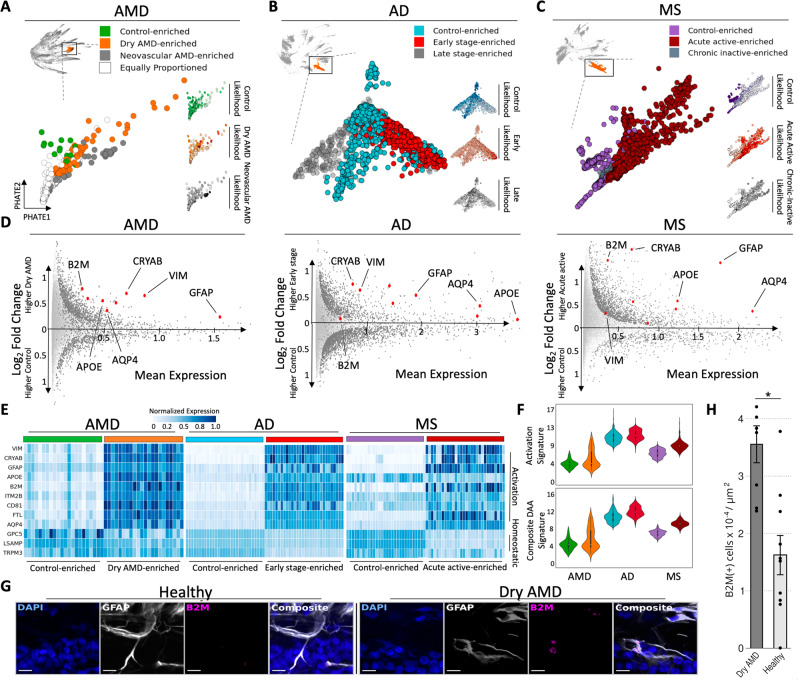
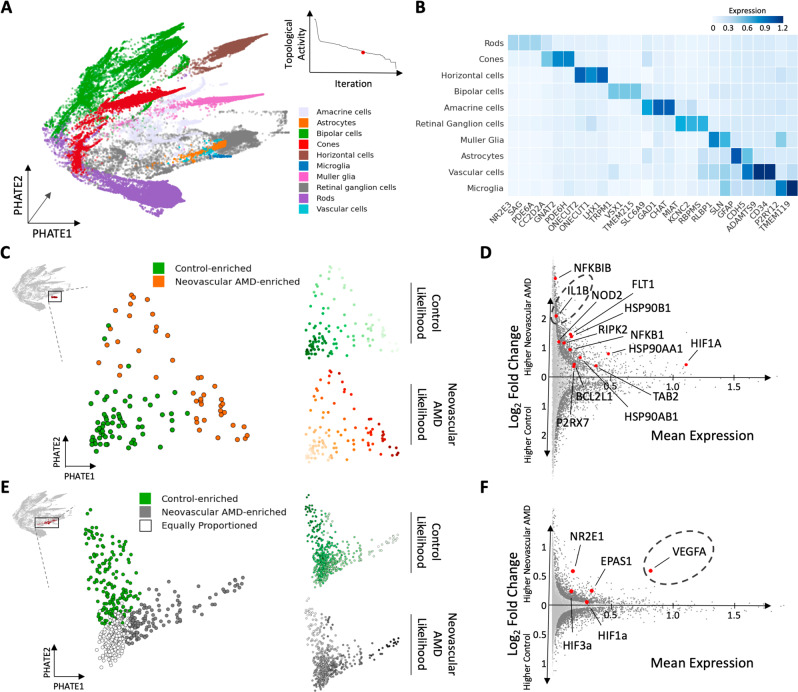
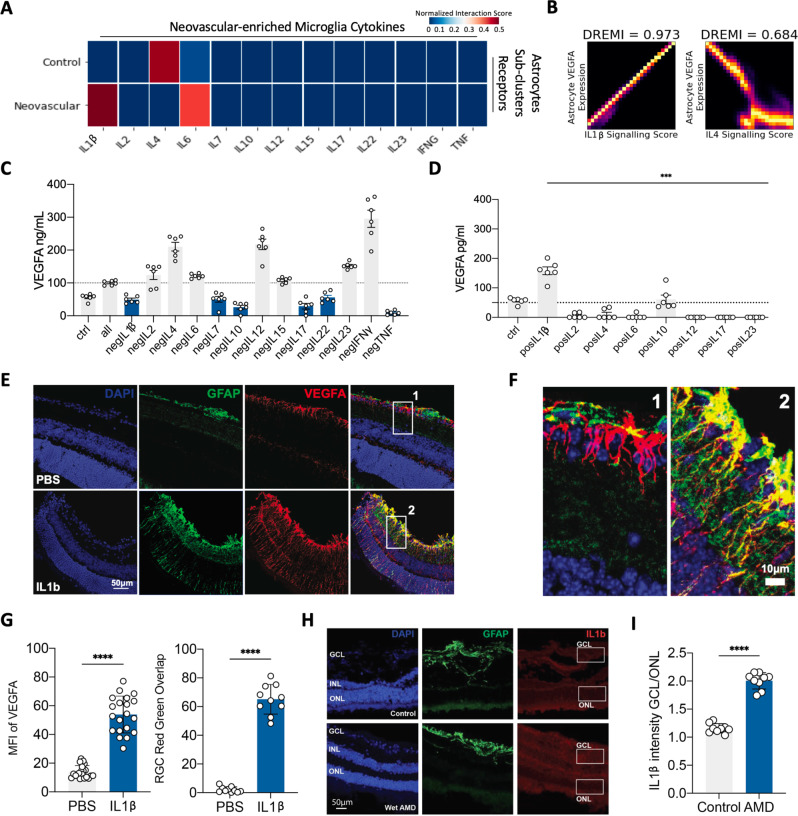
Due to commonalities in pathophysiology, age-related macular degeneration (AMD) represents a uniquely accessible model to investigate therapies for neurodegenerative diseases, leading us to examine whether pathways of disease progression are shared across neurodegenerative conditions. Here we use single-nucleus RNA sequencing to profile lesions from 11 postmortem human retinas with age-related macular degeneration and 6 control retinas with no history of retinal disease. We create a machine-learning pipeline based on recent advances in data geometry and topology and identify activated glial populations enriched in the early phase of disease. Examining single-cell data from Alzheimer's disease and progressive multiple sclerosis with our pipeline, we find a similar glial activation profile enriched in the early phase of these neurodegenerative diseases. In late-stage age-related macular degeneration, we identify a microglia-to-astrocyte signaling axis mediated by interleukin-1β which drives angiogenesis characteristic of disease pathogenesis. We validated this mechanism using in vitro and in vivo assays in mouse, identifying a possible new therapeutic target for AMD and possibly other neurodegenerative conditions. Thus, due to shared glial states, the retina provides a potential system for investigating therapeutic approaches in neurodegenerative diseases.


Conflict of interest statement

Dr. Krishnaswamy is on the scientific advisory board of KovaDx and AI Therapeutics. Dr. Hafler receives research funding from Nayan Therapeutics and Hoffmann-La Roche Pharmaceutical. Dr. Hafler is on the scientific advisory board of Carmine Therapeutics. All other authors declare no competing interests.

Figures

Fig. 1
Fig. 1. Overview of neurodegenerative disease processes and the topological diffusion condensation approach.
A Sketch of retina cross-section showing layers and major cell types. B Illustration of the role of innate immune cells in neurodegenerative disease pathogenesis. In the dry stage of AMD, there is accumulation of extracellular drusen debris between Bruch’s membrane (BM) and the retinal pigment epithelium (RPE), leading to activation of glia. In the neovascular late-stage of AMD, VEGF-mediated choroidal neovascularization (CNV) develops, which can lead to vision loss through rod and cone photoreceptor cell death. Accumulation of extracellular plaques and intracellular neurofibrillary tangles in Alzheimer’s disease and myelin damage in progressive multiple sclerosis are both accompanied by microglia (blue) and astrocyte (orange) activation. C Visual description of cellular condensation process undertaken by diffusion condensation across four granularities. Points are moved to and merged with their nearest neighbors as determined by a weighted random walk over the data graph. Over many successive iterations, cells collapse, denoting cluster identity at various iterations. D The coarse graining process described in C creates hundreds of granularities of clusters, which can be analyzed in meaningful ways: (i) we can visualize the hierarchy of clusters computed by diffusion condensation, to identify the merging behavior across granularities; (ii) we can identify meaningful, persistent partitions of the data by performing topological activity analysis; (iii) in conjunction with MELD, we can scan across these meaningful granularities to identify resolutions that optimally split disease-enriched populations of cells from healthy populations of cells and finally; (iv) we can compute differentially enriched genes between populations of interest.
Fig. 2
Fig. 2. Single-nucleus RNA-seq profiling of the macula from human individuals with varying stages of AMD pathology.
A (left) Topological activity analysis of human retina single-cell data across all condensation iterations. By computing gradients on topological activity (see Methods), we identify three granularities at which persistent partitions of the data occur (represented by resolutions i, ii and iii), and select them for downstream analysis. (right) Condensation process of AMD single-cell data visualized across iterations (from bottom to top) with the most coarse-grained granularity clusters visualized on PHATE embedding: resolution i. represents the most coarse-grained clusters and resolution ii. represents the second most coarse-grained clusters. B Populations identified at the finest granularity identified by topological activity analysis (resolution iii.) were visualized and all populations were assigned a cell type based on which cell-type gene signature they displayed the highest expression of. C Cell-type-specific genes visualized along with average normalized expression of known cell-type-specific marker genes. All major retinal cell types were identified by CATCH process described in A, B. D Differentially expressed genes identified by Wasserstein Earth Mover’s Distance (EMD) between cells from early-stage dry and late-stage neovascular AMD lesions and cells from control retinas on a cell-type-specific basis. Number of significantly differentially expressed genes between control and AMD cells reported in a cell type and stage-specific manner (FDR corrected p-value < 0.1). Cell types sorted by most differential genes between dry AMD and control comparison. Vascular cells, microglia and astrocytes have the most differentially expressed genes in dry AMD compared to control samples. E Bar chart indicates the contribution of cell types in each cluster from control, dry AMD and neovascular AMD samples. Microglia and astrocytes are the most statistically significantly enriched cell types in AMD, while rods and cones are the most depleted cell types in neovascular AMD. Vascular cells are the most enriched cell type in the neovascular AMD condition. All statistics were computed using two-sided multinomial tests with multiple comparisons correction (*p < 0.1).
Fig. 3
Fig. 3. Fine grain analysis of microglia reveals a shared activation signature enriched in the early phase of three different neurodegenerative diseases.
A 141 microglia identified by diffusion condensation at coarse granularity (upper left) can be further subdivided into three clusters at fine granularity, each enriched for cells from a different disease state. Disease state enrichment was calculated using MELD (right) for each condition: Control (top), dry AMD (middle) and neovascular AMD (bottom), with higher MELD likelihoods shown with darker colors. A resolution of the condensation homology, which optimally isolated MELD-likelihood scores from each condition was identified using topological activity analysis. Microglia are revisualized using PHATE. B As in panel A, three subsets of 288 microglia are found in AD with diffusion condensation and topological activity analysis, each enriched for cells from a different stage of pathology as computed by MELD (right). Cells are revisualized with PHATE. C As in panel A, three subsets of 1263 microglia are found in MS with diffusion condensation and topological activity analysis, each enriched for cells from a different stage of disease as computed by MELD (right). Cells are revisualized with PHATE. D Differential expression analysis between control-enriched and early or acute active disease-enriched microglia across neurodegenerative diseases reveals a shared activation pattern in early disease (increased expression of TYROBP, B2M, APOE, CD74, SPP1, HLA-DR, C1QB, C1QC). Significant differentially expressed genes are visualized in dark gray (two-sided EMD test with FDR corrected p-value < 0.1 as described in methods). E Heatmap demonstrating differences in expression of the neurodegenerative shared activation pattern and a homeostatic signature between control-enriched and early or acute active disease-enriched microglia across neurodegenerative diseases. Color conventions are as in panels AC. Rows correspond to genes and columns represent individual cells. We have plotted 40 cells from each dataset selected through random sampling to reveal the difference between control-like and early disease-like cellular states. (F, upper) Composite microglial activation signature for the neurodegenerative shared activation pattern in control-enriched and early or acute active disease-enriched microglia across neurodegenerative diseases (y-axis—gene expression of signature). (F, lower) Disease-associated microglia (DAM) signature (from ref. ) for control-enriched and early or acute active disease-enriched microglia across neurodegenerative diseases. Color conventions are as in panels AC (y-axis—gene expression of signature). Details on statistics are available in methods section. G Micrographs of combined in situ RNA hybridization and IBA1 immunofluorescence demonstrating elevated expression of key components of the neurodegenerative shared activation pattern (TYROBP and APOE) in IBA1-positive cells, a marker of microglia, from retinas with dry AMD (right group) compared to control retinas (left group). All scale bars = 10 μm. The average number of puncta identified per IBA1-positive cell for TYROBP was 0.28 ± 0.05 in dry AMD (n = 191) vs. 0.02 ± 0.01 for control (n = 464; p < 1e-10; Chi-square test for 0 vs. >0). The average number of puncta identified per IBA1-positive cell for APOE was 0.57 ± 0.09 in dry AMD vs. 0.14 ± 0.03 for control (p < 1e-08; Chi-square test for 0 vs. >0).
Fig. 4
Fig. 4. Fine grain analysis of astrocytes reveals a shared activation signature enriched in the early phase of neurodegenerative diseases.
A 474 astrocytes identified by diffusion condensation at coarse granularity (upper left) can be further subdivided into three clusters at fine granularity, each enriched for cells from a different stage of neurodegenerative disease. Disease state enrichment was calculated using MELD (right) for each condition: Control (top), dry AMD (middle) and neovascular AMD (bottom), with higher MELD likelihoods shown with darker colors. A resolution of the condensation homology, which optimally isolated MELD-likelihood scores from each condition was identified using topological activity analysis. Astrocytes are revisualized using PHATE. B As in panel A, three subsets of 2361 astrocytes are found in AD with diffusion condensation and topological activity analysis, each enriched for cells from a different stage of AD disease as computed by MELD (right). Astrocytes are revisualized with PHATE. C As in panel A, three subsets of 5469 astrocytes are found in MS with diffusion condensation and topological activity analysis, each enriched for cells from a different stage of MS as computed by MELD (right). Astrocytes are revisualized with PHATE. D Differential expression analysis between control-enriched and early stage of neurodegenerative disease-enriched clusters across neurodegenerative diseases reveals a shared activation pattern in the early stage of disease. This signature includes B2M, CRYAB, VIM, GFAP, AQP4, APOE, ITM2B, CD81, FTL. Significant differentially expressed genes visualized in dark gray (two-sided EMD test with FDR corrected p-value < 0.1 as described in methods). E Heatmap demonstrating differences in astrocyte expression of the neurodegenerative shared activation pattern and a homeostatic signature between control-enriched and early or acute active disease-enriched astrocytes across neurodegenerative diseases. Color conventions are as in panels A–C. Rows correspond to genes and columns represent individual cells. We have plotted 40 cells from each dataset selected through random sampling to reveal the difference between control-like and early-disease-like cellular states. F Composite astrocyte activation signature (top) and disease-associated astrocyte signature (DAA) for the neurodegenerative shared activation pattern in control-enriched cluster and early-disease-enriched cluster across neurodegenerative diseases. Color conventions are as in panels AC (y-axis—gene expression of signature). Details on statistics are available in methods section. G Micrographs of combined in situ RNA hybridization and GFAP immunofluorescence showing more abundant B2M expression in astrocyte-rich retinal layers from dry AMD retina when compared to control. All scale bars = 10 μm. H Bar plot showing density of B2M transcripts in the astrocyte-rich inner plexiform layer, retinal ganglion cell layer, and nerve fiber layers in retina samples affected by dry AMD (n = 8 cells) and control (n = 10 cells). Data are presented as mean values ± SEM; *p < 1e-03; Welch Two Sample t-test.
Fig. 5
Fig. 5. Cell-type-specific changes in gene expression during AMD disease progression.
A PHATE visualization of 46,783 nuclei isolated from neovascular AMD and control retinas. CATCH analysis identified a resolution of the condensation homology, which isolated cell types. As in Figure 3, each cellular cluster was assigned a cell-type identity based on which gene signature it expressed at the highest level. B CATCH-identified cell types, as shown by the average normalized expression of known cell-type-specific marker genes. C Disease state enrichment was calculated using MELD (right) for each condition: Control (top), and neovascular AMD (bottom), with higher MELD likelihoods shown with darker colors. A resolution of the condensation homology, which optimally isolated MELD-likelihood scores from each condition was identified using topological activity analysis. Microglia are revisualized using PHATE. Two subsets of microglial cells, one enriched for microglia from retinas with neovascular AMD and another from control retinas. D Differential expression analysis between control-enriched and neovascular disease-enriched microglial clusters revealed a different activation pattern in late disease. Significant differentially expressed genes visualized in dark gray (two-sided EMD test with FDR corrected p-value < 0.1 as described in methods). This signature includes NFKBIB, IL1B, NOD2, FLT1, HSP90B1, RIPK2, NFKB1, HSP90AA1, HIF1A, BCL2L1, P2RX7, TAB2, HSP90AB1. E Disease state enrichment was calculated using MELD (right) for each condition: Control (top) and neovascular AMD (bottom) with higher MELD likelihoods shown with darker colors. A resolution of the condensation homology, which optimally isolated MELD-likelihood scores from each condition was identified using topological activity analysis. Astrocytes are revisualized using PHATE. CATCH-identified three subsets of astrocyte cells, one enriched for astrocytes from neovascular retinas, another from control retinas and a third equally split between conditions. F Differential expression analysis between the control-enriched and neovascular disease-enriched astrocyte clusters reveals a different activation pattern in late-stage neovascular disease. Significant differentially expressed genes visualized in dark gray (two-sided EMD test with FDR corrected p-value < 0.1 as described in Methods section). This signature includes NR2E1, EPAS1, VEGFA, HIF1A, HIF3A.
Fig. 6
Fig. 6. Identifying cytokine regulators of astrocyte VEGFA secretion.
A Interaction analysis between diffusion condensation identified subtypes of astrocytes and neovascular-enriched microglia (detailed in Fig. 5) computed with CellPhoneDB. Interactions between cytokines produced from neovascular-enriched microglia were computed against cytokine-receptors on astrocyte subtypes. Interactions between specific cytokine-receptor pairs were added to produce a single cytokine interaction value for control and neovascular astrocyte subtypes. B DREMI association analysis between astrocyte VEGFA expression, IL-1β signaling score, and IL-4 signaling score. Signaling scores for IL-1β and IL-4 were computing by adding receptor expression of IL-1β and IL-4, respectively, neovascular-enriched astrocytes from Fig. 5. C Conducted negative screen in human iPSC-derived astrocytes 24 h after stimulation, subtracting one cytokine (e.g., 'negIL2') from the combinatorial pool to test its necessity in generating a VEGFA-producing astrocyte compared to vehicle control (ctrl). All represents stimulation with a mixture of cytokines (IL-1β, IL-2, IL-4, IL-6, IL-7, IL-10, IL-12, IL-15, IL-17, IL-22, IL-23, IFNγ, TNF). VEGFA protein is measured using enzyme-linked immunosorbent assay (ELISA). Data were evaluated using one-way ANOVA with multiple comparisons correction using Dunnetts. D Conducted single cytokine positive screen in human iPSC-derived astrocytes to test the sufficiency of each cytokine to stimulate astrocyte VEGFA production. VEGFA protein levels are measured using ELISA 24 h after stimulation with each cytokine compared to vehicle control (ctrl). Data were evaluated using one-way ANOVA with multiple comparisons correction using Dunnetts. E IL-1β or PBS was injected intravitreally into a mouse eye. Retinas were collected 72 h later for immunofluorescent imaging. GCL: ganglion cell layer; IPL: inner plexiform layer; INL: inner nuclear layer; OPL: outer plexiform layer; ONL: outer nuclear layer. PBS phosphate-buffered saline (control). Experiments were repeated at least three independent times with similar results. F Zoomed in images of regions indicated in E. G Quantification of mean fluorescence intensity (MFI) of VEGFA after injection of IL-1β or PBS in the mouse eyes after 72 h (left) and quantification of amount of VEGFA and GFAP overlap in the ganglion cell layer of the mouse retina after injection of IL-1β or PBS (right). The center of the error bars is the mean. A two-sided Student’s t-test was performed. **** represents p < 0.0005. H Immunofluorescence imaging of human postmortem control and neovascular AMD retinas. Experiments were repeated at least three independent times with similar results. I Quantification of IL-1β intensity in the ganglion cell layer (GCL) over the outer nuclear layer (ONL) of the retina from F. Data are presented as mean values ± SEM; ****p < 0.0005; two-tailed unpaired Student’s t-test.

References

    1. Wong WL, et al. Global prevalence of age-related macular degeneration and disease burden projection for 2020 and 2040: a systematic review and meta-analysis. Lancet Glob. Health. 2014;2:e106–e116. doi: 10.1016/S2214-109X(13)70145-1. - DOI - PubMed
    1. Mitchell P, Liew G, Gopinath B, Wong TY. Age-related macular degeneration. Lancet. 2018;392:1147–1159. doi: 10.1016/S0140-6736(18)31550-2. - DOI - PubMed
    1. Bird AC, et al. An international classification and grading system for age-related maculopathy and age-related macular degeneration. The International ARM Epidemiological Study Group. Surv. Ophthalmol. 1995;39:367–374. doi: 10.1016/S0039-6257(05)80092-X. - DOI - PubMed
    1. Mathys H, et al. Single-cell transcriptomic analysis of alzheimer’s disease. Nature. 2019;570:332–337. doi: 10.1038/s41586-019-1195-2. - DOI - PMC - PubMed
    1. Schirmer L, et al. Neuronal vulnerability and multilineage diversity in multiple sclerosis. Nature. 2019;573:75–82. doi: 10.1038/s41586-019-1404-z. - DOI - PMC - PubMed

Publication types