. 2023 May 5;14(1):2593.
doi: 10.1038/s41467-023-38316-9.

Methionine consumption by cancer cells drives a progressive upregulation of PD-1 expression in CD4 T cells

Affiliations

Methionine consumption by cancer cells drives a progressive upregulation of PD-1 expression in CD4 T cells

Mahesh Pandit et al. Nat Commun. .

Abstract

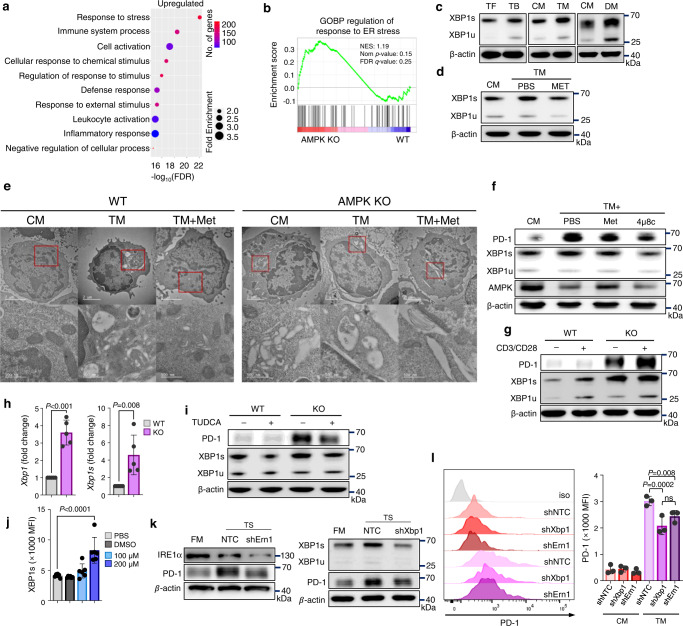
Programmed cell death protein 1 (PD-1), expressed on tumor-infiltrating T cells, is a T cell exhaustion marker. The mechanisms underlying PD-1 upregulation in CD4 T cells remain unknown. Here we develop nutrient-deprived media and a conditional knockout female mouse model to study the mechanism underlying PD-1 upregulation. Reduced methionine increases PD-1 expression on CD4 T cells. The genetic ablation of SLC43A2 in cancer cells restores methionine metabolism in CD4 T cells, increasing the intracellular levels of S-adenosylmethionine and yielding H3K79me2. Reduced H3K79me2 due to methionine deprivation downregulates AMPK, upregulates PD-1 expression and impairs antitumor immunity in CD4 T cells. Methionine supplementation restores H3K79 methylation and AMPK expression, lowering PD-1 levels. AMPK-deficient CD4 T cells exhibit increased endoplasmic reticulum stress and Xbp1s transcript levels. Our results demonstrate that AMPK is a methionine-dependent regulator of the epigenetic control of PD-1 expression in CD4 T cells, a metabolic checkpoint for CD4 T cell exhaustion.


Conflict of interest statement

The authors declare no competing interests.

Figures

Fig. 1
Fig. 1. Reduced methionine augments PD-1 expression in CD4 T cells.
a Immunoblot analysis of PD-1 expression in CD4, Treg, CD8, and B cells isolated from the inguinal lymph node of tumor-free mice (n = 6) and dLN of tumor-bearing mice (n = 6). The experiment was performed three times. b Immunoblots showing PD-1 expression in activated immune cells were cultured in complete medium (CM) or tumor-conditioned medium (TM) for 72 h. c Immunoblots of PD-1 expression in cells cultured in CM or dialyzed medium (DM) for 72 h. The experiment was performed three times. d Effects of nutrient supplementation on PD-1 expression in DM-cultured CD4 T cells. Immunoblots for PD-1 and the mean fluorescence intensity (MFI) of PD-1 expression are represented in bar graphs (n = 3). The experiment was performed three times. e Immunoblots of PD-1 expression in CD4 T cells cultured in CM or DM supplemented with individual essential amino acids. The experiment was performed two times. f, g PD-1 expression on activated murine CD4 (f) and human CD4 T cells (g) cultured in CM or TM with or without methionine. The experiment was performed two times. h Effect of additional methionine treatment (200 μM) on PD-1 expression in activated human CD4 T cells (n = 18). Statistical analyses were performed using one-way analysis of variance (d). ANOVA followed by Holm-Sidak’s multiple comparisons test (h). Data are presented as mean ± standard error of the mean. Source data are provided as a Source Data file.
Fig. 2
Fig. 2. Methionine supplementation enhances antitumor immunity.
Tumor volume and weight (n = 5 per group) (a) and PD-1 expression in tumor infiltrating CD4 T cells (n = 4 per group) (b) of mice transplanted with B16F10 melanoma cells and treated with methionine (40 mg/kg; intra-tumor) or control phosphate-buffered saline (PBS) every alternate day starting at day 8. c B16F10 tumor volume and tumor mass of Rag1−/− mice who underwent PBS or methionine treatment every alternate day starting at day 8 (n = 3 per group). d Tumor-specific CD8 T cell-mediated cytotoxicity in vitro assay in the presence of CD4 T cells obtained from TC-1-bearing mice treated with PBS or methionine (n = 3 per group; the experiment was repeated twice). e, f Tumor volume and tumor mass (e) and PD-1 expression in tumor-infiltrating CD4 T cells analyzed using flow cytometry (f) in wild-type (WT) mice (n = 5 per group) injected with SLC43A2 KO or SLC43A2-intact B16F10 cells. g Tumor volume and tumor mass of SLC43A2-intact and SLC43A2 KO B16F10 cells were monitored in Rag1−/− KO mice (n = 3 per group). Statistical analyses were performed using two-way analysis of variance (ANOVA) for tumor volume (a, e) and Two-tailed Student’s t test (ag). Data are presented as mean ± standard error of the mean. Source data are provided as a Source Data file.
Fig. 3
Fig. 3. Methionine restrains PD-1 via H3K79 methylation.
a Heat maps showing mRNA levels of antitumoral immunity-related proteins in CD4 T cells cultured in CM and DM alone or DM supplemented with methionine (n = 2 biological samples). b GSEA plot showing enriched PD-1 neighborhood genes in DM-cultured CD4 T cells. Enriched PD-1 neighborhood genes in CD4 T cells were downregulated by methionine supplementation (n = 2 biologically independent samples). c Volcano plot representing metabolic changes in CD4 T cells cultured in TM alone or TM supplemented with methionine (n = 3 independent samples per group). d Analysis of intracellular methionine, S-adenosyl methionine (SAM), and S-adenosyl homocysteine (SAH) concentrations via Liquid chromatography-mass spectrometry (LC-MS) in CD4 T cells cultured in CM, TM alone, and TM supplemented with methionine (n = 3 independent samples per group). e Immunoblots of PD-1 expression in CD4 T cells cultured for 72 h in CM, DM, or DM supplemented with methionine and its metabolites. The experiment was repeated two times. f Effects of TM and methionine treatments on the histone methylation profiles of cultured CD4 T cells. The experiment was repeated three times. g Immunoblots for H3K79me2 in CD4 T cells cultured in TM with methionine and its metabolites. The experiment was repeated two times. h Effects of the TME and methionine treatment on histone methylation profiles. Immunoblots of CD4 T cells isolated from tumor-free (n = 6), PBS-treated tumor-bearing (n = 6), and methionine-treated tumor-bearing mice (n = 6). The experiment was repeated two times. i Histone methylation profiles of tumor-infiltrated CD4 T cells isolated from SLC43A2-intact and SLC43A2 KO tumor-bearing mice (n = 6 in each group). The experiment was repeated two times. j PD-1 and H3K79me2 immunoblots in CD4 T cells with DOT1L (EPZ004777) inhibitor treatment. The experiment was repeated two times. PD-1 MFI in CD4 T cells via FACS after DOT1L inhibitor treatment (n = 6 per group). Statistical analyses were performed using two-tailed Student’s t test & TMM + CPM normalized method for correction (b), one-way analysis of variance (d, j) and Tukey HSD test (posthoc) after ANOVA (c). Data are presented as mean ± standard error of the mean. Source data are provided as a Source Data file.
Fig. 4
Fig. 4. Loss of H3K79me2 reduces AMPK expression.
a Metabolomic analysis of CD4 T cells cultured in CM and TM representing changes in carbohydrates, fatty acids, glycerides, and organic acids (n = 3 per group). b Volcano plot showing different metabolism-related genes in CD4 T cells cultured in CM and DM (n = 2 biologically independent samples). c Immunoblots showing AMPK expression in immune cells isolated from tumor-free (n = 6) and tumor-bearing mice (n = 6). The experiment was repeated three times. d Immunoblots showing AMPK expression in CD4 T cells cultured in CM, DM, or DM supplemented with individual amino acids. The experiment was repeated three times. e Expression of AMPK protein and Prkaa1 in activated CD4 T cells cultured in CM, TM, and TM supplemented with methionine (n = 3 per group). f Immunoblots for PD-1 expression in unstimulated and stimulated CD4 T cells isolated from WT and AMPK KO mice. The experiment was repeated three times. g PD-1 expression in WT and AMPK KO CD4 T cells in CM and TM with or without methionine supplementation. The experiment was repeated three times. h AMPK was overexpressed using a lentivirus vector in CD4 T cells cultured in CM and TM. AMPK overexpression and PD-1 expression were observed by western blotting. The experiment was repeated two times. i Immunoblot for AMPK in CD4 T cells cultured in CM, DM, and DM with methionine and its metabolites. The experiment was repeated two times. j Chromatin immunoprecipitation (ChIP) assay showing H3K79me2 occupancy in the Prkaa1 promoter of CD4 T cells (left). ChIP assay showing H3K79me2 occupancy of the Prkaa1 promoter in CD4 T cells cultured in CM, TM, and TM supplemented with methionine (right) (n = 3 per group). k Isolated CD4 T cells were cultured in the DOT1L inhibitor EPZ004777 for 12 h. Western blotting was performed for the detection of AMPK. The experiment was performed two times. Statistical analyses were performed using Tukey HSD test (posthoc) after ANOVA (b), two-tailed Student’s t test (e) or one-way analysis of variance (j). Data are presented mean ± standard error of the mean. Source data are provided as a Source Data file.
Fig. 5
Fig. 5. AMPK activation in CD4 T cells enhances antitumor immunity.
a, b B16F10 tumor volume and mass monitored in wild-type (WT) and AMPK KO mice (n = 5 per group) (a). Expression of PD-1 from CD4 TIL analyzed using FACS (n = 4 per group) (b). cf B16F10 tumors were transplanted into WT or AMPK KO mice. Intratumoral injection of PBS or methionine (40 mg/kg) was administered every other day starting at day 8. Tumor volume was monitored daily, tumor weight was measured on day 22 (n = 4 per group) (c), and PD-1 expression in tumor infiltrating CD4 was analyzed using FACS (n = 5 per group) (d). Tumor-infiltrated CD4 and CD8 T cell percentages (n = 5 per group) (e). IFN-γ and GZB cytokine secretions by tumor-infiltrating T cells (n = 5 per group) (f). gj B16F10 tumors transplanted in WT mice followed by treatment with methionine (40 mg/kg) or AICAR (500 mg/kg) alone or in combination every other day starting at day 8 (n = 5 per group). The tumor volume and weight were measured (g). PD-1 expression in tumor infiltrating CD4 T cells was analyzed using FACS (h). Percentages of tumor-infiltrated CD4 and CD8 T cells (i). IFN-γ and GZB cytokine secretions by tumor-infiltrating T cells (j). k B16F10 tumor cells were injected into Rag1−/− mice, followed by treatment with methionine (40 mg/kg) or AICAR (500 mg/kg) alone or in combination every other day starting at day 8. Tumor volume and weight were monitored (n = 4 per group). Statistical analyses were performed using two-way analysis of variance (ANOVA) for tumor volume (a, c, g, k). (WT + PBS vs WT + Met P < 0.0001; KO + PBS vs KO + Met P = 0.4190 (c); PBS vs Met + AICAR P < 0.0001; Met vs Met + AICAR P < 0.0001; AICAR vs Met + AICAR P < 0.0001 (g)). two-tailed Student’s t test (a, b) or one-way ANOVA multiple comparison tests were performed for bar graphs (ck). Data are presented mean ± standard error of the mean. Source data are provided as a Source Data file.
Fig. 6
Fig. 6. AMPK regulates PD-1 via XBP1s.
a, b RNA-seq was performed on wild-type (WT) and AMPK KO CD4 T cells. Gene Ontology (GO) biological process analysis revealed the top 10 upregulated pathways in AMPK KO CD4 T cells. The x-axis is -log10 (FDR); the different colors show the number of significantly regulated genes and the circles represent the fold-change in the enriched pathways. b GSEA plot of the response to ER stress-related genes. (a, b; n = 3 biological independent samples). c Immunoblots showing XBP1s and XBP1u expression in CD4 T cells from tumor-free and tumor-bearing mice (left panel) (n = 4 in each group) and cultured CD4 T cells in CM and TM (middle panel) or CM and DM (right panel). The experiment was repeated three times. d Immunoblot of XBP1s and XBP1u in CD4 T cells cultured in CM, TM, or TM supplemented with methionine. The experiment was repeated two times. e Representative TEM analysis showing the ER structure of WT or AMPK KO CD4 T cells in CM, TM, and TM supplemented with methionine. The size of scale bars is 2 µM (upper panels) and 500 nm (lower panels). f Immunoblots for PD-1, XBP1 and AMPK expression in CD4 T cells cultured in CM, TM, TM with methionine, and TM with an IRE1α inhibitor (4µ8c, 10 µM). The experiment was repeated three times. g Immunoblots for PD-1, XBP1s and XBP1u in activated or non-activated WT and AMPK KO CD4 T cells. The experiment was repeated three times. h Fold-change in total XBP1 and XBP1s transcripts in WT and AMPK KO CD4 T cells analyzed using RT-PCR (n = 5 per group). i Immunoblots for PD-1, XBP1s and XBP1u expression in WT and AMPK KO CD4 T cells with or without an ER stress inhibitor (TUDCA, 0.5 mM). The experiment was repeated three times. j Flow cytometry analysis of XBP1s in CD4 T cells with different doses of the DOT1L inhibitor (n = 6 per group). k Immunoblot analysis of PD-1 expression for ERN1(IRE1α) and XBP1 knockdown CD4 T cells cultured in CM and TM. The experiment was repeated three times. l PD-1 expression in XBP1 and ERN1(IRE1α) knockdown CD4 T cells determined using flow cytometry. (n = 3 per group). The experiment was repeated three times. Statistical analyses were performed using two-tailed Student’s t test & TMM + CPM normalized method for correction (b), two-tailed Student’s t test (h) or one-way analysis of variance (j, l). Data are presented as mean ± standard error of the mean. Source data are provided as a Source Data file.

References

    1. Pavlova NN, Zhu J, Thompson CB. The hallmarks of cancer metabolism: Still emerging. Cell Metab. 2022;34:355–377. doi: 10.1016/j.cmet.2022.01.007. - DOI - PMC - PubMed
    1. Habtetsion T, et al. Alteration of tumor metabolism by CD4+ T cells leads to TNF-α-dependent intensification of oxidative stress and tumor cell death. Cell Metab. 2018;28:228–242.e226. doi: 10.1016/j.cmet.2018.05.012. - DOI - PMC - PubMed
    1. Ho PC, Kaech SM. Reenergizing T cell anti-tumor immunity by harnessing immunometabolic checkpoints and machineries. Curr. Opin. Immunol. 2017;46:38–44. doi: 10.1016/j.coi.2017.04.003. - DOI - PMC - PubMed
    1. Waldman AD, Fritz JM, Lenardo MJ. A guide to cancer immunotherapy: from T cell basic science to clinical practice. Nat. Rev. Immunol. 2020;20:651–668. doi: 10.1038/s41577-020-0306-5. - DOI - PMC - PubMed
    1. Borst J, Ahrends T, Bąbała N, Melief CJM, Kastenmüller W. CD4+ T cell help in cancer immunology and immunotherapy. Nat. Rev. Immunol. 2018;18:635–647. doi: 10.1038/s41577-018-0044-0. - DOI - PubMed

Publication types