. 2023 May 5;13(1):7376.
doi: 10.1038/s41598-023-32927-4.

Anti-inflammatory effects of CBD in human microglial cell line infected with HIV-1

Affiliations

Anti-inflammatory effects of CBD in human microglial cell line infected with HIV-1

Adriana Yndart Arias et al. Sci Rep. .

Abstract

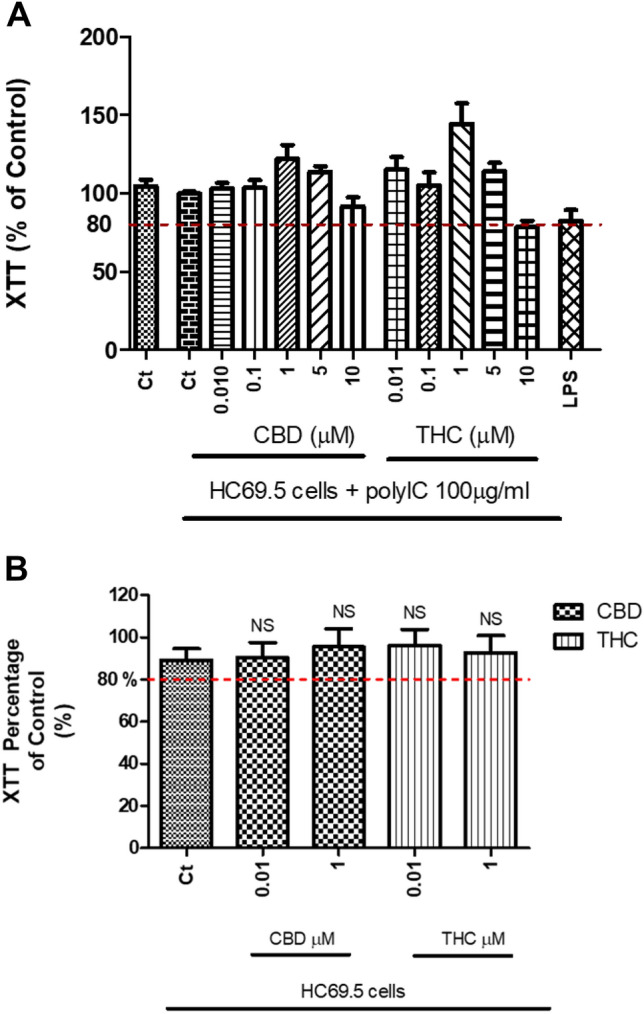
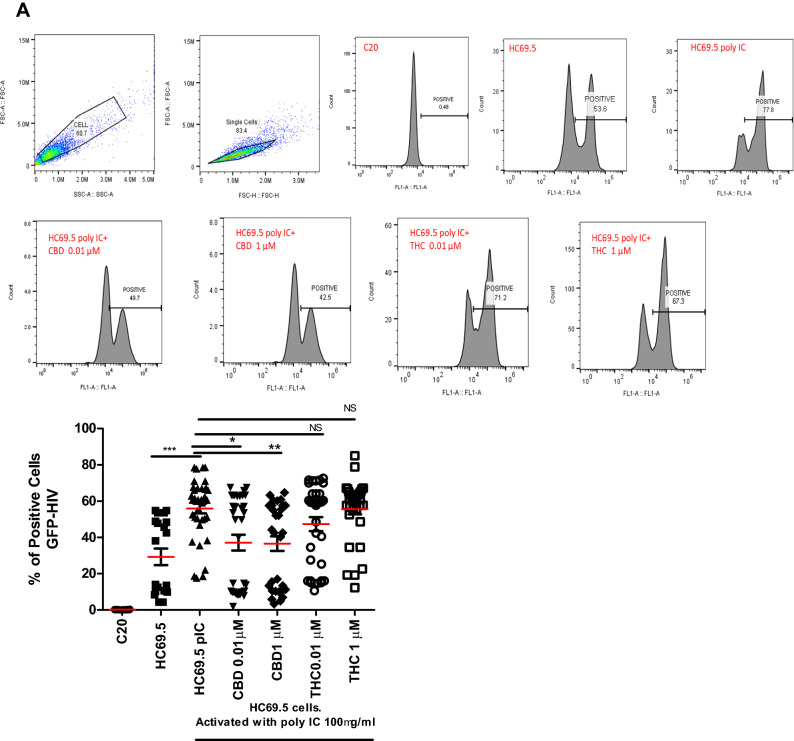
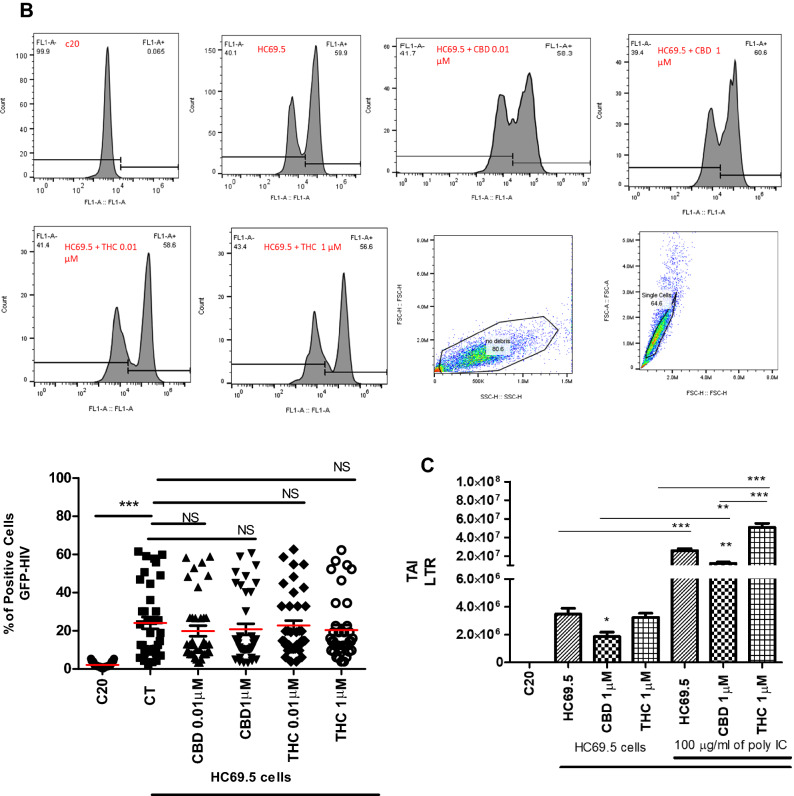
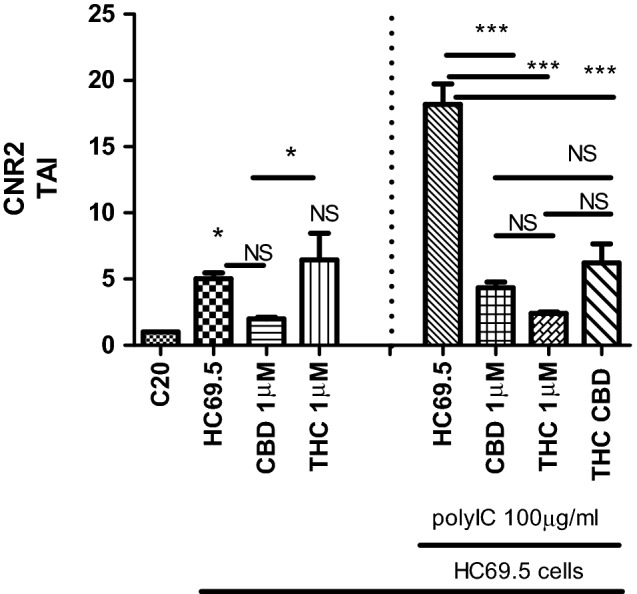
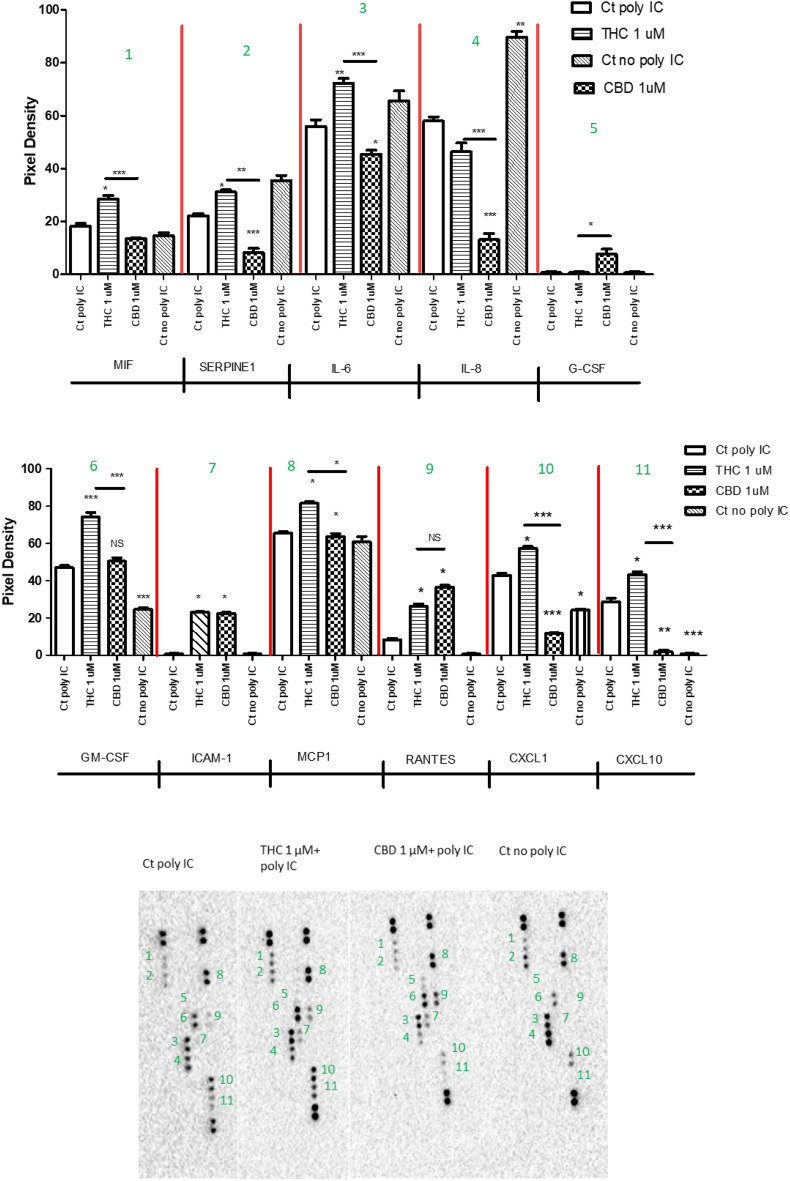
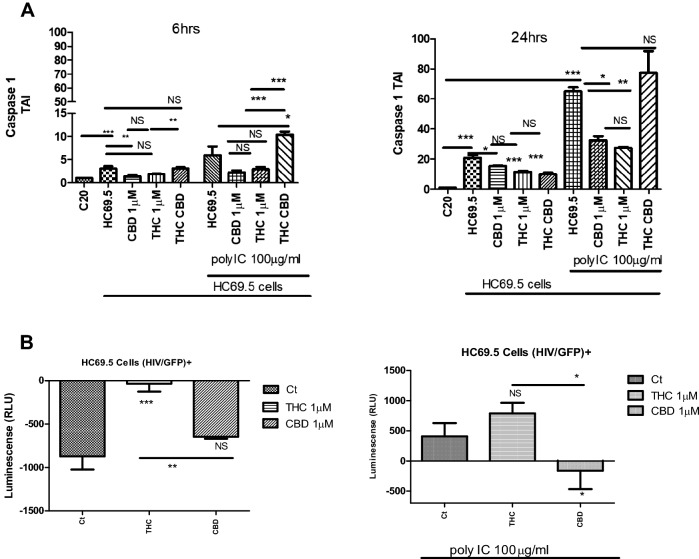
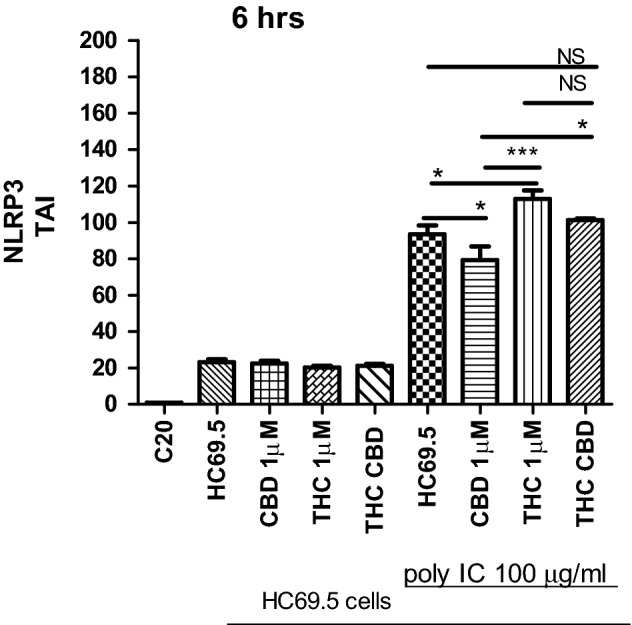
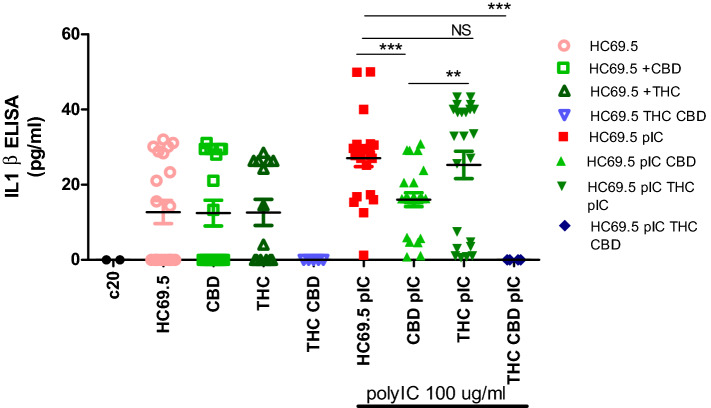
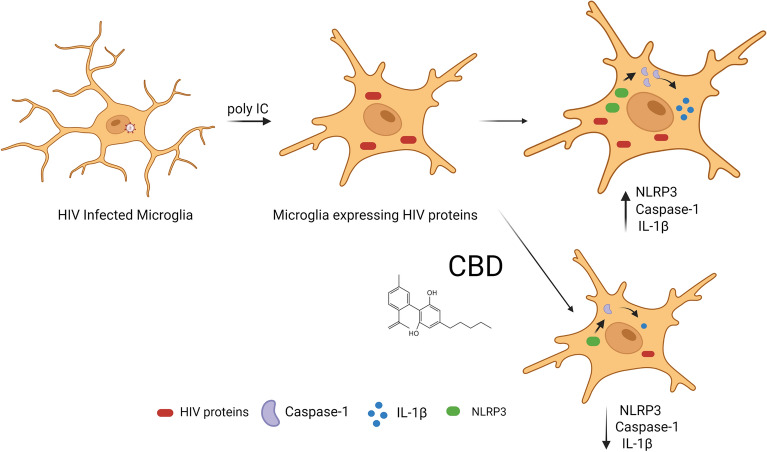
Human immunodeficiency virus (HIV) infection is associated with a chronic inflammatory stage and continuous activation of inflammasome pathway. We studied the anti-inflammatory effects of the compound cannabidiol (CBD) in comparison with Δ (9)-tetrahydrocannabinol [Δ(9)-THC] in human microglial cells (HC69.5) infected with HIV. Our results showed that CBD reduced the production of various inflammatory cytokines and chemokines such as MIF, SERPIN E1, IL-6, IL-8, GM-CSF, MCP-1, CXCL1, CXCL10, and IL-1 β compared to Δ(9)-THC treatment. In addition, CBD led to the deactivation of caspase 1, reduced NLRP3 gene expression which play a crucial role in the inflammasome cascade. Furthermore, CBD significantly reduced the expression of HIV. Our study demonstrated that CBD has anti-inflammatory properties and exhibits significant therapeutic potential against HIV-1 infections and neuroinflammation.


Conflict of interest statement

The authors declare no competing interests.

Figures

Figure 1
Figure 1
(A) HC69.5 cells were treated with 100 µg/ml of poly IC and different concentrations of CBD or THC. After 24 h of drug treatment, the XTT-activated reagent was added. Cells treated with LPS were used as positive control. (B) Similarly, cells without poly IC were treated with different concentrations of CBD or THC. After 24 h of drug treatments, the XTT-activated reagent was added, and absorbance was measured after 4 h. Results are presented as a percentage of control, untreated HC69.5 cells. GraphPad Prism 5 software was used to plot and conduct statistical analysis. Normality distribution was checked by Kolmogorov–Smirnov test, while ANOVA and Dunns calculated statistical significance as a post-hoc test. Experiments were performed at least three times in replicates.
Figure 2
Figure 2
(A) HC69.5. HIV (GFP+) cells were treated with 100 μg/ml poly IC and different concentrations of Δ (9)-THC or CBD (0.01 and 1 μM). Cells were incubated overnight and were fixed using the Fixation and Permeabilization Solution Kit (Cat. No. 554715). Flow cytometry analysis was performed to detect the HIV infection by expressing GFP-positive cells. Immortalized human microglia cells (C20) (HIV-; GFP-) were used as untreated and uninfected control. Results were expressed as percentage of positive cells. Experiments were performed at least three times in replicates. GraphPad Prism 5 software was used to graph and conduct statistical analysis. The normality distribution was evaluated by Kolmogorov–Smirnov test, while statistical significance (p ≤ 0.05) was calculated by ANOVA and Dunns as a post-hoc test. (B) HC69.5. HIV (GFP +) cells were treated with different concentrations of Δ (9)-THC or CBD (0.01 and 1 μM). Cells were incubated overnight and were fixed using the Fixation and Permeabilization Solution Kit (Cat. No. 554715). Flow cytometry analysis was performed to detect the HIV infection by expressing GFP-positive cells. Immortalized human microglia cells (C20) (HIV−; GFP−) were used as untreated and uninfected control. Results were expressed as number of positive cells. Experiments were performed at least three times in replicates. GraphPad Prism 5 software was used to graph and conduct statistical analysis. The normality distribution was evaluated by Kolmogorov–Smirnov test, while statistical significance (p ≤ 0.05) was calculated by ANOVA and Dunns as a post-hoc test. (C) LTR gene expression on HC69.5. HIV (GFP+) cells was assessed by RT PCR. H69.5 cells treated with/without 100 μg/ml poly IC, 1 μM concentration of CBD or Δ (9)-THC as figure is showing. After 24 h of treatments, RNAs were extracted, and reverse transcribed followed by real time PCR for LTR gene (HIV LTR Pa03453409_s1; Thermofisher Scientific). GAPDH (Hs99999905_m1) was used as a housekeeping gene. Data represent the means ± standard error of three independent experiments. Graph represents the transcript accumulation index respect to negative control C20. Data were analyzed using GraphPad Prism software. The normality distribution was evaluated by Kolmogorov–Smirnov test, while statistical significance was calculated by ANOVA and Dunns Multiple Comparison Test as a post-hoc test. Differences were considered significant at p ≤ 0.05.
Figure 2
Figure 2
(A) HC69.5. HIV (GFP+) cells were treated with 100 μg/ml poly IC and different concentrations of Δ (9)-THC or CBD (0.01 and 1 μM). Cells were incubated overnight and were fixed using the Fixation and Permeabilization Solution Kit (Cat. No. 554715). Flow cytometry analysis was performed to detect the HIV infection by expressing GFP-positive cells. Immortalized human microglia cells (C20) (HIV-; GFP-) were used as untreated and uninfected control. Results were expressed as percentage of positive cells. Experiments were performed at least three times in replicates. GraphPad Prism 5 software was used to graph and conduct statistical analysis. The normality distribution was evaluated by Kolmogorov–Smirnov test, while statistical significance (p ≤ 0.05) was calculated by ANOVA and Dunns as a post-hoc test. (B) HC69.5. HIV (GFP +) cells were treated with different concentrations of Δ (9)-THC or CBD (0.01 and 1 μM). Cells were incubated overnight and were fixed using the Fixation and Permeabilization Solution Kit (Cat. No. 554715). Flow cytometry analysis was performed to detect the HIV infection by expressing GFP-positive cells. Immortalized human microglia cells (C20) (HIV−; GFP−) were used as untreated and uninfected control. Results were expressed as number of positive cells. Experiments were performed at least three times in replicates. GraphPad Prism 5 software was used to graph and conduct statistical analysis. The normality distribution was evaluated by Kolmogorov–Smirnov test, while statistical significance (p ≤ 0.05) was calculated by ANOVA and Dunns as a post-hoc test. (C) LTR gene expression on HC69.5. HIV (GFP+) cells was assessed by RT PCR. H69.5 cells treated with/without 100 μg/ml poly IC, 1 μM concentration of CBD or Δ (9)-THC as figure is showing. After 24 h of treatments, RNAs were extracted, and reverse transcribed followed by real time PCR for LTR gene (HIV LTR Pa03453409_s1; Thermofisher Scientific). GAPDH (Hs99999905_m1) was used as a housekeeping gene. Data represent the means ± standard error of three independent experiments. Graph represents the transcript accumulation index respect to negative control C20. Data were analyzed using GraphPad Prism software. The normality distribution was evaluated by Kolmogorov–Smirnov test, while statistical significance was calculated by ANOVA and Dunns Multiple Comparison Test as a post-hoc test. Differences were considered significant at p ≤ 0.05.
Figure 3
Figure 3
Cannabinoid receptor type 2 gene expression on HC69.5. HIV (GFP+) cells was assessed by RT PCR. H69.5 cells treated with/without 100 μg/ml Poly IC, 1 μM concentration of CBD or /and Δ (9)-THC. After 24 h of treatments, RNAs were extracted, and reverse transcribed followed by real time PCR for CNR2 gene (Hs00275635_m1; Thermofisher Scientific). GAPDH (Hs99999905_m1) was used as a housekeeping gene. Data represent the means ± standard error of three independent experiments. Graph represents the transcript accumulation index respect to negative control C20. Data were analyzed using GraphPad Prism software. The normality distribution was evaluated by Kolmogorov–Smirnov test, while statistical significance was calculated by ANOVA and Tukey Multiple Comparison Test as a post hoc test. Differences were considered significant at p ≤ 0.05.
Figure 4
Figure 4
HC69.5 cells were exposed to 1 μM concentration of THC or CBD after HIV activation with 100 μg/ml of poly IC. 48 h after adding the drugs, supernatants were collected and assayed by Proteome Profiler Human Cytokine Array (R&D system: ARY005B) following provider instructions. (Control Ct: control (HC69.5 cells)). GraphPad Prism 5 software was used to graph and conduct statistical analysis. First, normality distribution was checked by the Kolmogorov–Smirnov test for each cytokines. Then, statistical significances (p ≤ 0.05) were calculated by ANOVA followed by Tukey's Multiple Comparison Test as post-hoc test. Each of the dysregulated proteins is numbered in graph and membrane pictures.
Figure 5
Figure 5
(A) Caspase 1 gene expression on HC69.5. HIV (GFP+) cells was assessed by RT PCR. H69.5 cells treated with/without 100 μg/ml Poly IC, 1 μM concentration of CBD or/and Δ (9)-THC. After 6 h and 24 h of treatments, RNAs were extracted, and reverse transcribed followed by real time PCR for Caspase 1 gene (Hs00354836_m1; Thermofisher Scientific). GAPDH (Hs99999905_m1) was used as a housekeeping gene. Data represent the means ± standard error of three independent experiments. Graph represents the transcript accumulation index respect to negative control C20. Data were analyzed using GraphPad Prism software. The normality distribution was evaluated by Kolmogorov–Smirnov test, while statistical significance was calculated by ANOVA and Tukey Multiple Comparison Test as a post hoc test. Differences were considered significant at p ≤ 0.05. (B) Caspase 1 Activation. HIV infection in HC69.5. HIV (GFP+) with and without 100 μg/ml poly IC and cells were treated with 1 μM of Δ(9)-THC or CBD. After 24 h. of treatment, Caspase 1 activation was analyzed using Caspase-Glo® 1 Inflammasome Assay kit (Promega; cat: G9951). (Ct = Control). GraphPad Prism 5 software was used to graph and conduct statistical analysis. Normality distribution was checked by the Kolmogorov–Smirnov test. Then, statistical significances (p ≤ 0.05) were calculated by ANOVA followed by Dunn ‘s as a post-hoc test.
Figure 6
Figure 6
NLRP3 gene expression on HC69.5. HIV (GFP+) cells was assessed by RT PCR. H69.5 cells treated with/without 100 μg/ml Poly IC, 1 μM concentration of CBD or/and Δ (9)-THC. After 6 h of treatments, RNAs were extracted, and reverse transcribed followed by real time PCR for NLRP3 gene (Hs00918082_m1; Thermofisher Scientific). GAPDH (Hs99999905_m1) was used as a housekeeping gene. Data represent the means ± standard error of three independent experiments. Graph represents the transcript accumulation index respect to negative control C20. Data were analyzed using GraphPad Prism software. The normality distribution was evaluated by Kolmogorov–Smirnov test, while statistical significance was calculated by ANOVA and Tukey Multiple Comparison Test as a post hoc test. Differences were considered significant at p ≤ 0.05.
Figure 7
Figure 7
HC69.5. HIV (GFP+) were treated with/without 100 μg/ml poly IC, 1 μM of Δ(9)-THC or CBD. Supernatants were collected after 24 h of treatment and analyzed by ELISA MAX™ Deluxe Set Human IL-1ß (Biolegend; cat# 437004). GraphPad Prism 5 software was used to graph and conduct statistical analysis. Normality distribution was checked by the Kolmogorov–Smirnov test. Then, statistical significances (p ≤ 0.05) were calculated by ANOVA followed by Dunn’s test as post-hoc test.
Figure 8
Figure 8
Representation of the mechanisms of action of the CBD on HIV infected microglia cells.

References

    1. Hanus LO, et al. Phytocannabinoids: A unified critical inventory. Nat. Prod. Rep. 2016;33(12):1357–1392. doi: 10.1039/C6NP00074F. - DOI - PubMed
    1. McPartland JM, Glass M, Pertwee RG. Meta-analysis of cannabinoid ligand binding affinity and receptor distribution: Interspecies differences. Br. J. Pharmacol. 2007;152(5):583–593. doi: 10.1038/sj.bjp.0707399. - DOI - PMC - PubMed
    1. Mechoulam R, Parker LA, Gallily R. Cannabidiol: An overview of some pharmacological aspects. J. Clin. Pharmacol. 2002;42(S1):11S–19S. doi: 10.1002/j.1552-4604.2002.tb05998.x. - DOI - PubMed
    1. Bisogno T, et al. Molecular targets for cannabidiol and its synthetic analogues: Effect on vanilloid VR1 receptors and on the cellular uptake and enzymatic hydrolysis of anandamide. Br. J. Pharmacol. 2001;134(4):845–852. doi: 10.1038/sj.bjp.0704327. - DOI - PMC - PubMed
    1. Bhunia S, Kolishetti N, Arias AY, Vashist A, Nair M. Cannabidiol for neurodegenerative disorders: A comprehensive review. Front Pharmacol. 2022;13:989717. doi: 10.3389/fphar.2022.989717. - DOI - PMC - PubMed

Publication types