. 2023 Aug 2;31(8):2472-2488.
doi: 10.1016/j.ymthe.2023.04.021. Epub 2023 May 4.

A chemically inducible IL-2 receptor signaling complex allows for effective in vitro and in vivo selection of engineered CD4+ T cells

Affiliations

A chemically inducible IL-2 receptor signaling complex allows for effective in vitro and in vivo selection of engineered CD4+ T cells

Peter J Cook et al. Mol Ther. .

Abstract

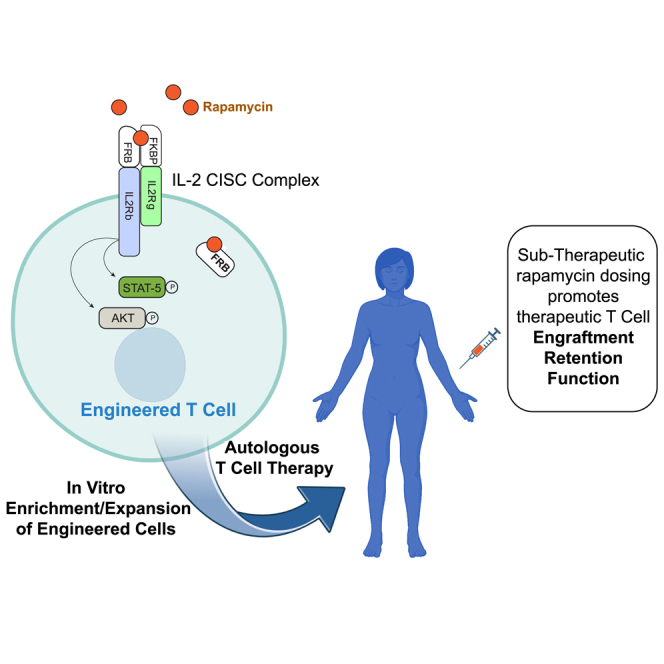
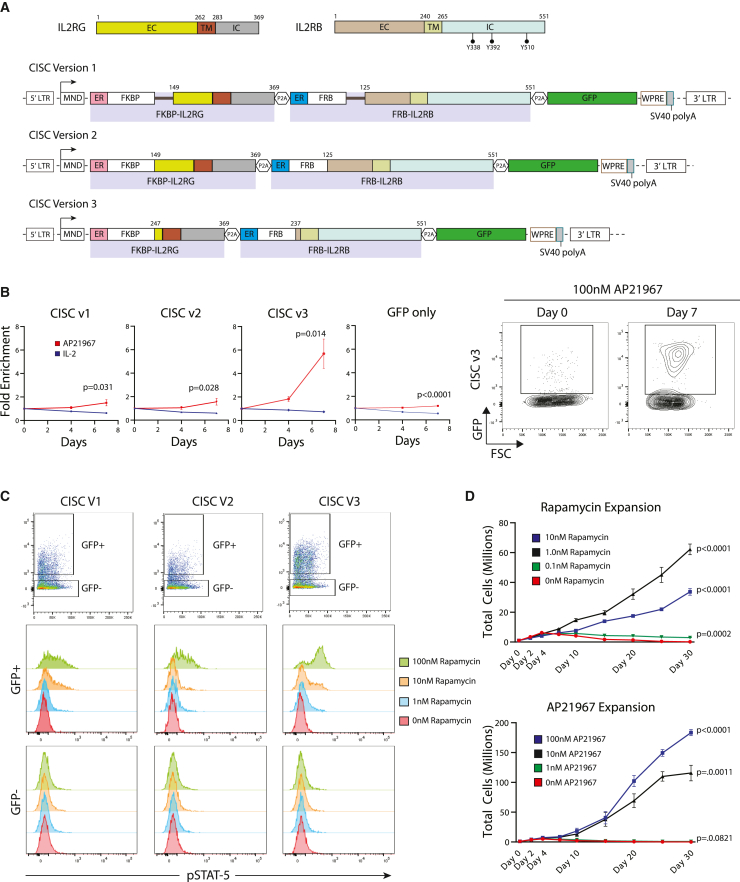
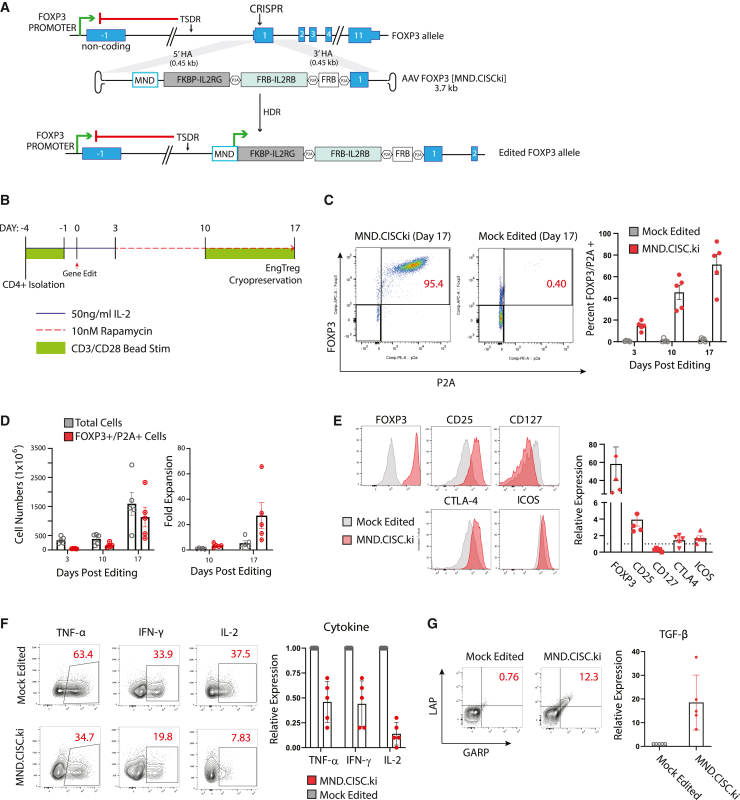
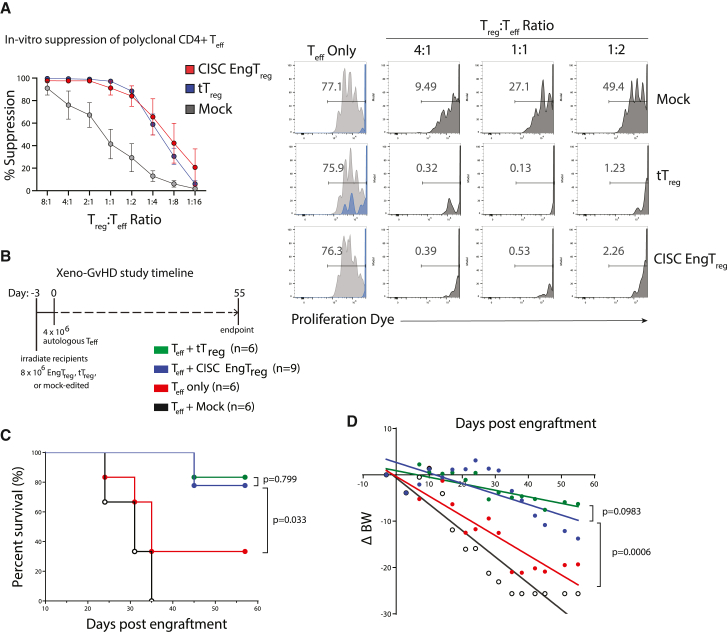
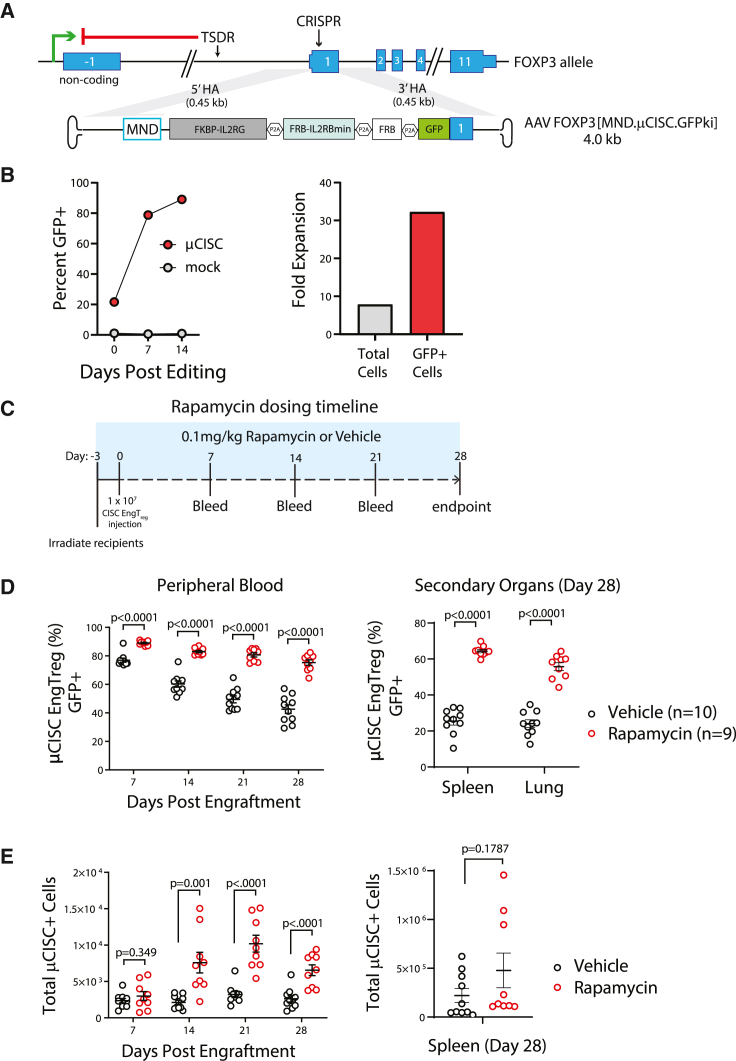
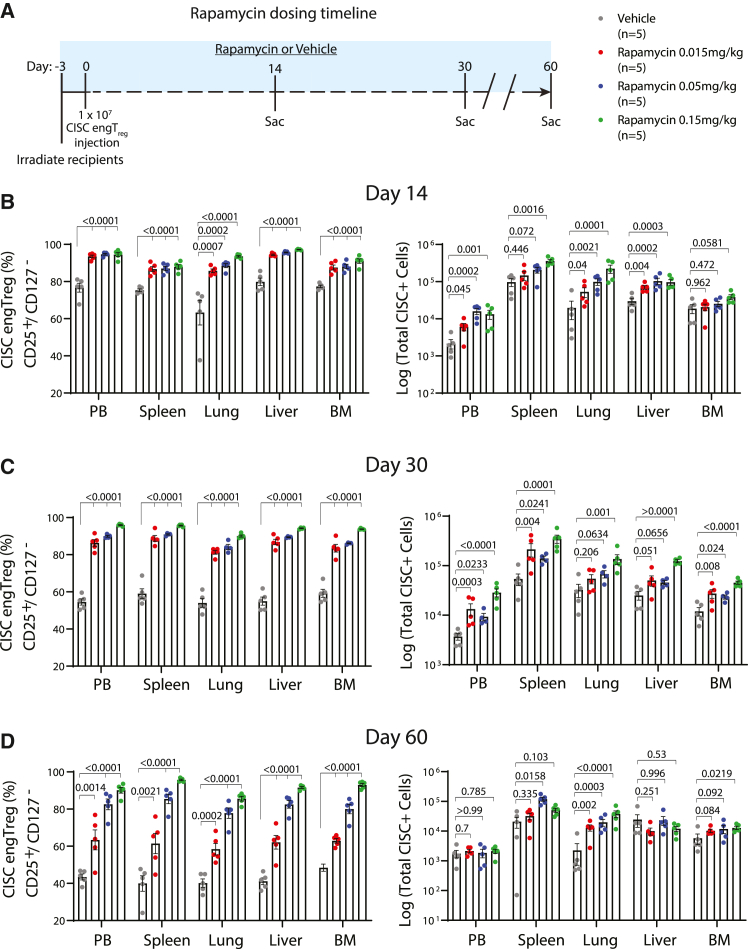
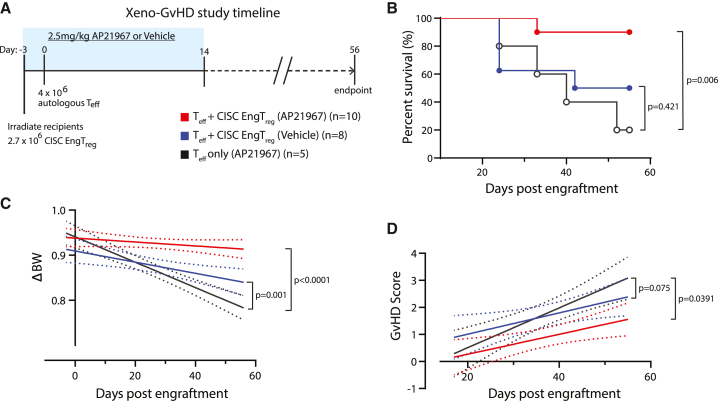
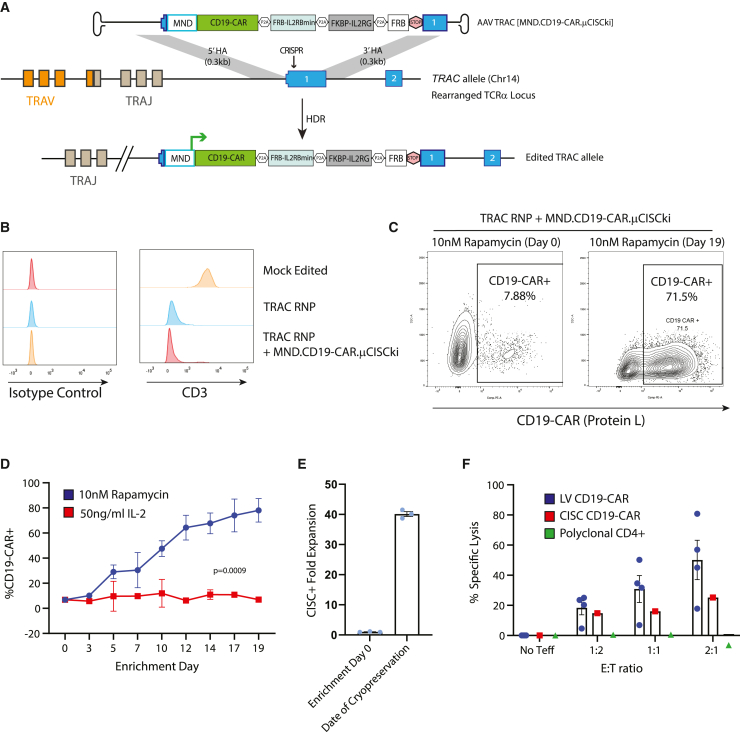
Engineered T cells represent an emerging therapeutic modality. However, complex engineering strategies can present a challenge for enriching and expanding therapeutic cells at clinical scale. In addition, lack of in vivo cytokine support can lead to poor engraftment of transferred T cells, including regulatory T cells (Treg). Here, we establish a cell-intrinsic selection system that leverages the dependency of primary T cells on IL-2 signaling. FRB-IL2RB and FKBP-IL2RG fusion proteins were identified permitting selective expansion of primary CD4+ T cells in rapamycin supplemented medium. This chemically inducible signaling complex (CISC) was subsequently incorporated into HDR donor templates designed to drive expression of the Treg master regulator FOXP3. Following editing of CD4+ T cells, CISC+ engineered Treg (CISC EngTreg) were selectively expanded using rapamycin and maintained Treg activity. Following transfer into immunodeficient mice treated with rapamycin, CISC EngTreg exhibited sustained engraftment in the absence of IL-2. Furthermore, in vivo CISC engagement increased the therapeutic activity of CISC EngTreg. Finally, an editing strategy targeting the TRAC locus permitted generation and selective enrichment of CISC+ functional CD19-CAR-T cells. Together, CISC provides a robust platform to achieve both in vitro enrichment and in vivo engraftment and activation, features likely beneficial across multiple gene-edited T cell applications.

Keywords: CAR-T; CISC; CRISPR; IL-2; T(reg); mTOR.


Conflict of interest statement

Declaration of interests D.J.R. is a scientific co-founder and Scientific Advisory Board (SAB) member of GentiBio, Inc., and scientific co-founder and SAB member of BeBiopharma, Inc. A.M.S. is a scientific co-founder and SAB member of GentiBio, Inc., and scientific co-founder and CEO of Umoja Biopharma. D.J.R. received past and current funding from GentiBio, Inc., for related work. D.J.R., A.M.S., P.J.C., and K.S. are inventors on patents describing methods for generating antigen-specific engineered regulatory T cells and/or use of the CISC platform. G.I.U. was a previous employee of Casebia Therapeutics and a current employee of GentiBio, Inc.

Figures

None
Graphical abstract
Figure 1
Figure 1
Identification of an optimized IL-2 CISC architecture for in vitro enrichment and expansion of CD4+ T cells (A) Schematic representation of domain structures of human IL2RG and IL2RB (upper schematic) and the alternative IL-2 CISC LV expression cassettes (lower schematics). Numbering indicates amino acid residues within relevant protein structure. EC, extracellular domain; TM, transmembrane domain; IC, intracellular domain; ER, endoplasmic reticulum targeting signal sequence. Black bars in CISCv1 represent a flexible linker sequence. (B) Left panel: progressive fold enrichment for GFP+ primary human CD4+ T cells following transduction with alternative CISC LV constructs following culture in 50 ng/mL IL-2 versus 100 nM AP21967. Right panel: representative GFP flow plots for CISCv3 on days 0 and 7. Data are presented as mean ± SEM for n = 3 technical replicates. (C) Flow cytometry analysis of STAT-5 phosphorylation in primary human CD4+ T cells expressing alternative CISC constructs following 30 min treatment with increasing doses of rapamycin. Upper panels: GFP+ and GFP–gating for each sample. Lower histograms: intracellular phospho-STAT-5 staining within each GFP gate. (D) Primary human CD4+ T cells transduced with CISCv3 were expanded for 25 days using the indicated doses of rapamycin (upper panel, n = 4) or AP21967 (lower panel, n = 3). Total cell numbers were determined for each technical replicate at the indicated time points. Data are presented as mean ± SEM.
Figure 2
Figure 2
CISC EngTreg cells have Treg-like immunophenotype and cytokine profile after rapamycin enrichment (A) Diagram of the FOXP3 locus and an AAV donor template [MND.CISCki] designed to introduce the CISC elements via CRISPR-meditated HDR. Successfully gene-edited locus (bottom) drives constitutive expression of the CISC components and endogenous FOXP3 from the transgene’s MND promoter, bypassing the methylated TSDR silencing element. (B) CISC EngTreg manufacturing strategy. Timing of CD3/CD28 activation beads, IL-2, and rapamycin inclusion in the culture medium is shown. Mock-edited cells were cultured with 50 ng/mL IL-2 throughout with matched CD3/CD28 activation. (C) Left panel: representative FOXP3/P2A flow plots for MND.CISCki gene-edited cells and mock-edited cells on day 17. Right panel: proportion of FOXP3+/P2A+ cells on days 3, 10, and 17 post-editing. CISC EngTreg were manufactured using five independent PBMC donors (mean ± SEM, n = 5). (D) Quantification of the cell number (left) and relative fold expansion (right) for total cells versus HDR-edited (FOXP3+/P2A+) cells. (E) Immunophenotyping of mock-edited versus CISC EngTreg. Left panels: expression of Treg markers at day 3 after thawing of cryopreserved cell populations. Right panel: relative fold change in MFI of indicated Treg markers in CISC EngTreg versus mock cells (dotted line). (F) Mock and CISC EngTreg cells were stimulated with PMA/ionomycin for 5 h to assess production of inflammatory cytokines TNF-α, IFN-γ, and IL-2. Left panels: representative flow plots. Right panels: relative expression for indicated cytokines in CISC EngTreg versus mock cells. (G) Mock-edited or CISC EngTreg cells were stimulated with soluble CD3 and CD28 antibodies for 24 h, followed by flow analysis for LAP and GARP to assess TGF-β production. Left panels: representative flow plots. Right graph: relative TGF-β expression in CISC EngTreg versus mock cells. For (C)–(G), data represent n = 5 biological replicates and are presented as mean ± SEM.
Figure 3
Figure 3
CISC EngTreg are immunosuppressive in vitro and in vivo (A) Left: graph shows the percent suppression (mean ± SEM; n = 5) of effector T cell proliferation after 4 days in culture with CD3/CD28 activation beads and the indicated ratio of autologous CISC EngTreg, mock, or tTreg. Percentage suppression was calculated as ((%) Teff dividing without Treg – (%) Teff dividing with Treg)/(%) Teff dividing without Treg) × 100. Right panels: representative flow cytometry histograms for the in vitro suppression assay. Fluorescence of the CTV-labeled Teff cells is shown for the Treg treatment groups indicated at the top of each column. For the Teff only group (no Treg), histograms of CD3/CD28-stimulated Teff cells (gray) are shown overlaid with that of the same cells cultured without stimulation (blue). Histograms for dye-labeled Teff cells co-cultured with different ratios of mock cells, CISC EngTreg, or tTreg are shown in dark gray. (B–D) Xenogeneic GvHD study in NSG mice. (B) Timeline of murine xeno-GvHD study. Minimally irradiated NSG mice were delivered tTreg, mock-edited cells, CISC EngTreg cells, or nothing (8 × 106 cells/mouse, day −3) followed by CD4+ Teff cells (4 × 106 cells/mouse) delivered 3 days later for all groups (day 0). (C) Kaplan-Meier survival curve of NSG mice monitored up to 57 days after Teff injection; mice were euthanized at pre-determined humane endpoints. p values were calculated based on log rank (Mantel-Cox) test. (D) Linear regression analyses of body weight changes (ΔBW, %) were calculated as ((current BW − original BW on day −3)/original BW at day −3) × 100.
Figure 4
Figure 4
Systemic rapamycin improves in vivo persistence of adoptively transferred CISC EngTreg cells (A) Diagram of FOXP3 locus and an AAV donor template [MND.μCISC.GFPki] designed to introduce a truncated CISC with a shortened IL2RB subunit in conjunction with a GFP tag via CRISPR-meditated HDR. The homology arms flanking the MND.μCISC.GFPki cassette are the same as the full-length CISC AAV donor template used in the previous figures. (B) Left panel: enrichment of μCISC EngTreg and (right panel) fold change in cell numbers over time post-editing when cultured in 10 nM rapamycin. (C) Timeline of rapamycin in vivo study. NSG mice were minimally irradiated and received 1 × 107 μCISC EngTreg cells on day 0. Rapamycin (0.1 mg/kg) or vehicle solution were delivered i.p. to corresponding groups of animals every other day, starting at day −3 and extending until the end of study (4 weeks after cell delivery). Peripheral blood was collected weekly from all animals and tissues from spleen and lung were collected at the time of sacrifice. (D) The percentage of GFP+ cells (of hCD45+, hCD4+) in peripheral blood at each collection point and indicated tissues at time of sacrifice as assessed by flow cytometry. (E) Total numbers of GFP+, hCD45+, and hCD4+ cells per 100 μL sample in peripheral blood and spleen. Data presented as mean ± SEM.
Figure 5
Figure 5
In vivo persistence of CISC EngTreg cells is rapamycin dose dependent (A) Timeline of rapamycin dose-response study. On day 0, 60 mice were delivered CISC EngTreg cells (8 × 106 cells/mouse) 3 days after minimal irradiation. Animals were divided into 4 treatment groups of 15 mice receiving 0.015, 0.05, and 0.15 mg/kg rapamycin or vehicle, respectively. Five animals among each group were sacrificed at days 14, 30, and 60 post engraftment. Rapamycin or vehicle solution were delivered i.p. to corresponding groups every other day, starting at day 0 when CISC EngTreg cells were i.v. delivered (3 days after irradiation). (B–D) Peripheral blood and tissues from spleen, lung, liver, and bone marrow were collected at time of sacrifice and subjected to flow analyses to examine CISC EngTreg percentage and absolute numbers. Data presented as mean ± SEM. p values as listed are for vehicle versus each individual rapamycin dose.
Figure 6
Figure 6
AP20187 supports GvHD prevention by CISC EngTreg in vivo (A) Timeline of the AP20187-treated murine xeno-GvHD study. Blue box indicates the time period of daily i.p. administration of AP20187 (2.5 mg/kg) or vehicle solution. Body weight was monitored three times per week, starting on day −3 until the end of study; GvHD symptoms were scored weekly starting at day 14. (B) Kaplan-Meier survival curve of NSG mice; mice were euthanized at pre-determined humane endpoints. p values were calculated based on log rank (Mantel-Cox) test. (C) Linear regression analysis of body weight changes (ΔBW) was calculated as (current BW − original BW on day −3)/original BW at day −3. (D) Linear regression of weekly GvHD scores.
Figure 7
Figure 7
Generation of TCR-deleted, CISC-expressing, selectable, and functional CD19-CAR-T cells (A) Schematic of engineering strategy for knockin of MND.CD19-CAR.P2A.μCISC cassette into human TRAC locus. STOP element consists of a TAA stop codon followed by an SV40 polyadenylation sequence. (B) Flow cytometry histogram of CD3 surface expression in primary human CD4+ T cells 3 days after the indicated editing procedure. Isotype control stain shown in the left panel. (C) Representative Protein-L flow cytometry plots for MND.CD19-CAR.P2A.μCISC-edited CD4+ T cells at days 0 and 19 of rapamycin enrichment. CD19-CAR CISC T cell percentage (D) and fold expansion (E) after culture in 50 ng/mL IL-2 or 10 nM rapamycin for 19 days. (F) Specific killing (% lysis) of CD19+ K562 target cells in a mixed-target assay at 48 h post-mixing with indicated proportion of effector T cells. LV CD19-CAR-T cells were generated by transduction of CD4+ T cells with MND.CD19-CAR lentivirus (E:T ratios, ratio of effector cell to target cell). Data presented as mean ± SEM (n = 4).

Comment in

References

    1. June C.H., Sadelain M. Chimeric antigen receptor therapy. N. Engl. J. Med. 2018;379:64–73. - PMC - PubMed
    1. Young R.M., Engel N.W., Uslu U., Wellhausen N., June C.H. Next-generation CAR T-cell therapies. Cancer Discov. 2022;12:1625–1633. - PMC - PubMed
    1. Stadtmauer E.A., Fraietta J.A., Davis M.M., Cohen A.D., Weber K.L., Lancaster E., Mangan P.A., Kulikovskaya I., Gupta M., Chen F., et al. CRISPR-engineered T cells in patients with refractory cancer. Science. 2020;367 - PMC - PubMed
    1. Raffin C., Vo L.T., Bluestone J.A. Treg cell-based therapies: challenges and perspectives. Nat. Rev. Immunol. 2020;20:158–172. - PMC - PubMed
    1. Ferreira L.M.R., Muller Y.D., Bluestone J.A., Tang Q. Next-generation regulatory T cell therapy. Nat. Rev. Drug Discov. 2019;18:749–769. - PMC - PubMed

Publication types

MeSH terms

LinkOut - more resources